[Preprint]. 2024 Sep 23:2024.09.18.613749.
doi: 10.1101/2024.09.18.613749.

BCR ligation selectively inhibits IgE class switch recombination

Affiliations

BCR ligation selectively inhibits IgE class switch recombination

Adam K Wade-Vallance et al. bioRxiv. .

Abstract

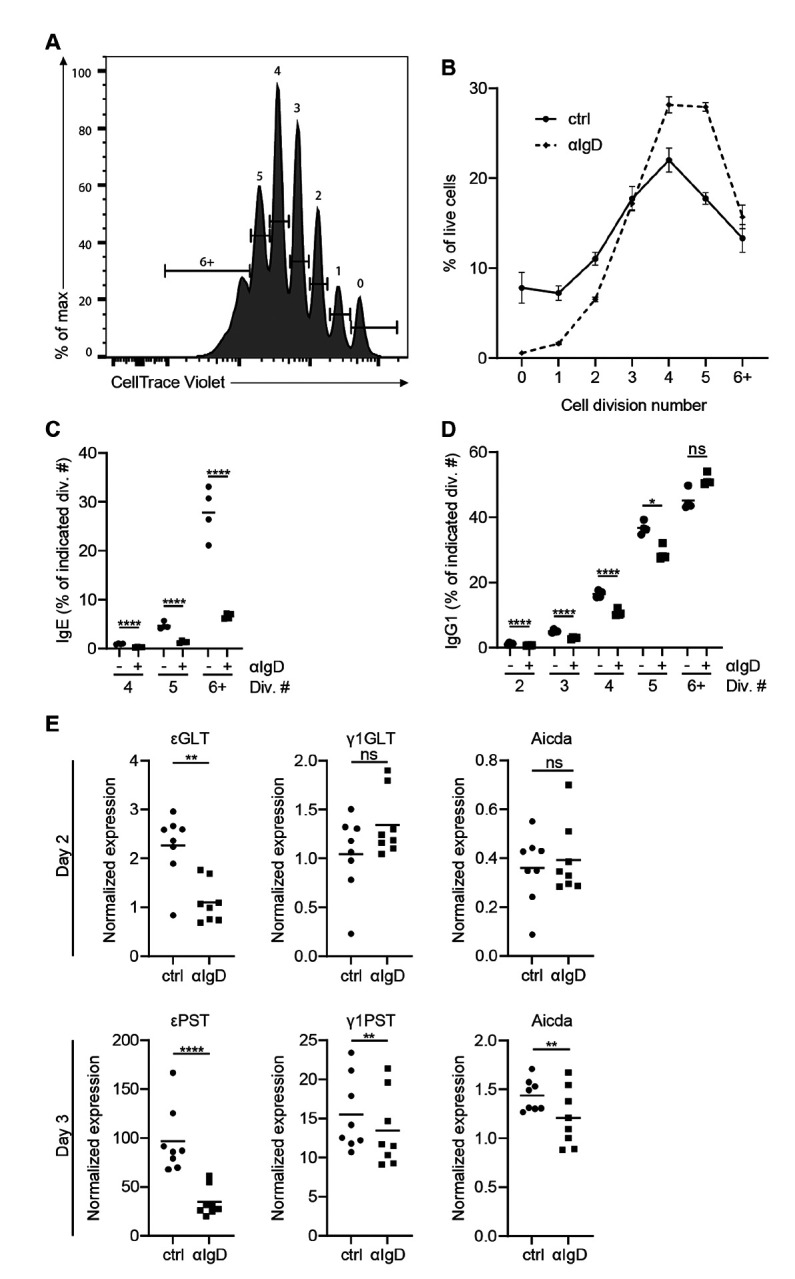
Mechanisms that restrict class switch recombination (CSR) to IgE limit the subsequent production of IgE antibodies and therefore the development of allergic disease. Mice with impaired B cell receptor (BCR) signaling have significantly increased IgE responses, consistent with a role for BCR signaling in IgE regulation. While prior work focused on BCR signaling in IgE-expressing cells to explain these findings, it has been reported that BCR signaling can reduce CSR. Therefore, we investigated the possibility that IgE CSR might be particularly sensitive to inhibition by BCR signaling in unswitched B cells. We found that immunization of mice with high-affinity antigen resulted in reduced representation of IgE-expressing cells among germinal center B cells and plasma cells relative to a low-affinity antigen. Mechanistic experiments with cultured mouse B cells demonstrated that BCR ligands selectively inhibited IgE CSR in a dose-, affinity-, and avidity-dependent manner. Signaling via Syk was required for the inhibition of IgE CSR following BCR stimulation, whereas inhibition of the PI3K subunit p110δ increased IgE CSR independently of BCR ligation. The inhibition of IgE CSR by BCR ligands synergized with IL-21 or TGFβ1. BCR ligation also inhibited CSR to IgE in human tonsillar B cells, and this inhibition was also synergistic with IL-21. These findings establish that IgE CSR is uniquely susceptible to inhibition by BCR signaling in mouse and human B cells, with important implications for the regulation and pathogenesis of allergic disease.


Figures

Figure 1.
Figure 1.. BCR stimulation reduces the representation of IgE cells in vivo and in vitro.
(A) Hy10 B cells were adoptively transferred into congenically-marked recipient mice that were then immunized with ovalbumin-conjugated DEL or HEL in alum adjuvant. Shown are the proportions of IgE cells (left column) and IgG1 cells (right column) within the GC (top row) and PC (bottom row) compartments of transferred cells in the dLN at d7, quantified by flow cytometry. (B) Quantification of surface IgM (top) and IgD (bottom) levels on follicular B cells from wildtype or Igα+/− mice by flow cytometry. (C) Wildtype and Igα+/− mice were immunized subcutaneously with NP-CGG in alum adjuvant and the resultant immune response in the dLN at d7 was analyzed by flow cytometry. Plots are laid out as described for panel A. (D-E) Wildtype mouse B cells were cultured with IL-4, αCD40, and the indicated treatments for 4 days prior to analysis by flow cytometry. (D) Representative flow cytometry plots of IgE and IgG1 staining among class-switched (IgMIgD) cells according to treatment condition (from left to right; ctrl [GGG], αIgD, αIgM, αIgκ; all at 1 μg/mL). (E) Quantification of the effects of treatment with low (L; 100 ng/mL), medium (M; 300 ng/mL), or high (H; 1 μg/mL) doses of αIgD (black squares), αIgM (grey squares), αIgκ (white squares), or ctrl (GGG; 1 μg/mL; black circles) antibodies on the proportions of IgE (left) and IgG1 (right) cells among class-switched (IgMIgD) cells. (A-C, E) Dots represent samples from individual mice and bars represent the mean values. ns, not significant; *, P < 0.05; **, P < 0.01; ***, P < 0.001; ****, P < 0.0001 (unpaired t test [A-C], one-way repeated measures ANOVA [E] with Dunnett’s post-test comparing each condition to the control with the Holm-Sidak correction for multiple comparisons). Results are pooled from three (A) or two (B, C, E) independent experiments or are representative of two independent experiments (D).
Figure 2.
Figure 2.. B cell culture with cognate antigen reduces yields of IgE cells.
(A-C) Purified B1–8i B cells were cultured with IL-4 and αCD40 for 4 days with control (‘-’ is no treatment, ‘ctrl’ is BSA at 50 ng/mL; black circles) or cognate antigen (NIP24BSA, NP25BSA, or NP4BSA; black squares) prior to analysis by flow cytometry. Doses of cognate antigen ascend from left to right as represented by the gradient triangles, exact doses are as follows (ng/mL): NIP24BSA; 0.002, 0.005, 0.015, 0.05, 0.25 | NP25BSA; 0.016, 0.08, 0.4, 2, 10 | NP4BSA; 20, 200, 1.25 × 10³, 1 × 10⁴. (A-B) Quantification of the proportion of IgE (top) or IgG1 (bottom) cells among all live cells (A) or within the class-switched (IgMIgD) compartment (B) as assessed by flow cytometry. (C) Quantification of the frequency of IgE cells (black circles) and IgG1 cells (white circles) among live cells in the antigen-treated condition as a fraction of their frequency among live cells in the control condition. (A-C) Dots represent samples from individual mice and bars represent the mean values. ns, not significant; *, P < 0.05; **, P < 0.01; ***, P < 0.001; ****, P < 0.0001 (one-way repeated measures ANOVA with Dunnett’s post-test comparing each condition to the untreated control with the Holm-Sidak correction for multiple comparisons). Results are representative of two independent experiments.
Figure 3.
Figure 3.. BCR stimulation inhibits IgE CSR.
(A-D) Purified naïve mouse B cells were loaded with CTV (see Methods) and then cultured for 4 days with IL-4, αCD40, and control (GGG) or αIgD antibodies (3 μg/mL) prior to analysis by flow cytometry. (A) Representative histogram from the control-treated condition showing CTV staining and cell division number gating. (B) Quantification of the frequency (%) of live cells at each cell division for control- and αIgD-treated conditions, n=4. (C-D) Quantification of the proportion of IgE (C) and IgG1 (D) cells among live cells within each cell division (gated as shown in panel A) for control (black circles) and αIgD (black squares) treatments. (E) Purified naïve mouse B cells were cultured with IL-4, αCD40, and the indicated treatments for two (top row) or three (bottom row) days prior to quantification of the indicated transcripts by RT-qPCR; numbers on the y axis are relative arbitrary units normalized to HPRT. Dots represent average values (B), or samples from individual mice (C-E). Error bars show the SEM (B). Bars represent the mean values (C-E). ns, not significant; *, P < 0.05; **, P < 0.01; ****, P < 0.0001 (one-way repeated measures ANOVA with Dunnett’s post-test comparing the indicated pairs of conditions with the Holm-Sidak correction for multiple comparisons [C-D], paired t test [E]). Results are representative of five similar experiments (A-D) or are pooled from three independent experiments (E).
Figure 4.
Figure 4.. BCR stimulation represses IgE CSR via Syk-dependent rather than p110δ-dependent signaling.
(A-E) Purified B cells were cultured with IL-4 and αCD40 for 4 days under various conditions of stimulation and/or inhibitor treatment (as indicated on the x axes) prior to analysis by flow cytometry. (A) Quantification of the proportion of IgE cells among class-switched (IgMIgD) cells according to treatment with αIgD or ctrl (GGG) at 1 μg/mL, as well as different doses of nemiralisib (L – 25nM, M – 100nM, H – 250nM) or vehicle control (DMSO). (B) Normalization was performed by dividing the frequency of IgE cells among class-switched (IgMIgD) cells in the αIgD-treated (3 μg/mL) condition by their frequency in the control-treated condition (GGG; 1 μg/mL), for each dose of nemiralisib. (C) Quantification of the proportion of IgE cells among class-switched cells treated with αIgD (1 μg/mL; +) or control (no treatment; −), in the presence of vehicle (veh; DMSO) or different doses of inhibitors of Syk (PRT062607, L – 0.4μM, M - 1μM, H – 2.5μM), Btk (ibrutinib; L – 1nM, M – 10nM, H – 50nM), all p110 isoforms and mTOR (omipalisib; L – 1nM, M – 5nM, H – 10nM), p110δ (idelalisib; L – 10nM, M – 50nM, H – 250nM), or all PI3K isoforms (wortmannin; L – 40nM, H – 200nM). See Supplementary Table 1 for statistical comparisons. (D) Quantification, for each dose of inhibitor or vehicle control described for panel D, of the frequency of IgE cells among class-switched (IgMIgD) cells in the αIgD-treated condition as a percentage of their frequency in the untreated control condition. (E) Quantification of the frequency of IgE (left) or IgG1 (right) cells among live cells following treatment with the indicated doses (in ng/mL) of PMA and/or ionomycin. Dots represent samples from individual mice and bars represent the mean values. ns, not significant; *, P < 0.05; **, P < 0.01; ***, P < 0.001; ****, P < 0.0001 (one-way repeated measures ANOVA [A-E] with Dunnett’s post-test comparing the indicated pairs of conditions [A-B], the αIgD-treated condition [D], or the vehicle control [E] using the Holm-Sidak correction for multiple comparisons). See Supplementary Table 1 for statistics for panel C. Results are representative (A, C-E) or pooled from (B) two independent experiments.
Figure 5.
Figure 5.. B cell receptor stimulation acts synergistically with IL-21 or TGFβ1 to inhibit IgE CSR.
(A) Purified B1–8i B cells were cultured for four days with IL-4, αCD40, and cognate antigen (NP-BSA – 10 ng/mL) or control antigen (ctrl, BSA – 10 ng/mL) in the presence or absence of IL-21 (25 ng/mL). The frequencies of IgE and IgG1 cells among class-switched (IgMIgD) cells were quantified by flow cytometry. (B) Purified B cells were cultured for four days with or without αIgD (3μg/mL) and in the presence or absence of TGFβ1 (2 ng/mL). The frequencies of IgE and IgG1 cells among class-switched cells were quantified by flow cytometry. (A-B) Dots represent samples from individual mice and bars represent the mean. ns, not significant; *, p < 0.05; **, p < 0.01; ***, p < 0.001; ****, P < 0.0001 (one-way repeated measures ANOVA with Dunnett’s post-test comparing the indicated pairs of conditions with the Holm-Sidak correction for multiple comparisons). Results are pooled from two independent experiments.
Figure 6.
Figure 6.. BCR stimulation inhibits IgE CSR in human B cells.
(A-D) Purified human tonsillar naïve B cells were cultured in IL-4, IL-10, αCD40, and the indicated treatment conditions for 8 days prior to analysis by flow cytometry. (A-B) Representative flow cytometry plots and gating strategies for class-switched (IgMIgD) cells (A), IgE cells (B; top row), or IgG1 and IgG4 cells (B; bottom row) for cells treated with low, medium, or high (0.1, 0.3, or 3 μg/mL, respectively) doses of αIgM or control (GGG; 3 μg/mL). Cells in (B) were pre-gated as IgMIgD, as shown in (A). Note that the IgG1 antibody cross-reacts with IgG4 and therefore IgG4-expressing cells appear as IgG4+ IgG1+, whereas IgG1-expressing cells appear as IgG4 IgG1+. (C-D) The proportions of IgE (left), IgG1 (center), and IgG4 (right) cells within the class-switched (IgMIgD) compartment were quantified by flow cytometry according to the indicated treatment conditions. (C) Quantification of the impact of αIgM titration on CSR. Treatment doses were as described for panels A-B. (D) Quantification of the synergistic impacts of IL-21 and BCR ligation on CSR. Treatment doses were: ‘-’ – untreated; ctrl – GGG at 300 ng/mL (grey) or 2 μg/mL (black), αIgM – 300 ng/mL (grey) or 2 μg/mL (black); IL-21 – 5 (grey) or 10 (black) ng/mL. (C-D) Dots represent samples from individual human tonsil donors and bars represent the mean. ns, not significant; *, P < 0.05; **, P < 0.01; ***, P < 0.001; ****, P < 0.0001 (one-way repeated measures ANOVA with Dunnett’s post-test comparing the indicated pairs of conditions and the Holm-Sidak correction for multiple comparisons). Results are representative of (A-B) or pooled from (C-D) two experiments.

Similar articles

References

    1. Wade-Vallance A. K. & Allen C. D. C. Intrinsic and extrinsic regulation of IgE B cell responses. Curr Opin Immunol 72, 221–229 (2021). - PMC - PubMed
    1. Yang Z., Wu C.-A. M., Targ S. & Allen C. D. C. IL-21 is a broad negative regulator of IgE class switch recombination in mouse and human B cells. J Exp Medicine 217, e20190472 (2020). - PMC - PubMed
    1. Wade-Vallance A. K. et al. B cell receptor ligation induces IgE plasma cell elimination. J Exp Med 220, e20220964 (2023). - PMC - PubMed
    1. Omori S. A. et al. Regulation of Class-Switch Recombination and Plasma Cell Differentiation by Phosphatidylinositol 3-Kinase Signaling. Immunity 25, 545–557 (2006). - PubMed
    1. Hauser J. et al. B-cell receptor activation inhibits AID expression through calmodulin inhibition of E-proteins. P Natl Acad Sci Usa 105, 1267–72 (2008). - PMC - PubMed

Publication types

LinkOut - more resources