[Preprint]. 2024 Sep 16:2024.09.12.612706.
doi: 10.1101/2024.09.12.612706.

A structural MRI marker predicts individual differences in impulsivity and classifies patients with behavioral-variant frontotemporal dementia from matched controls

Affiliations

A structural MRI marker predicts individual differences in impulsivity and classifies patients with behavioral-variant frontotemporal dementia from matched controls

Valérie Godefroy et al. bioRxiv. .

Abstract

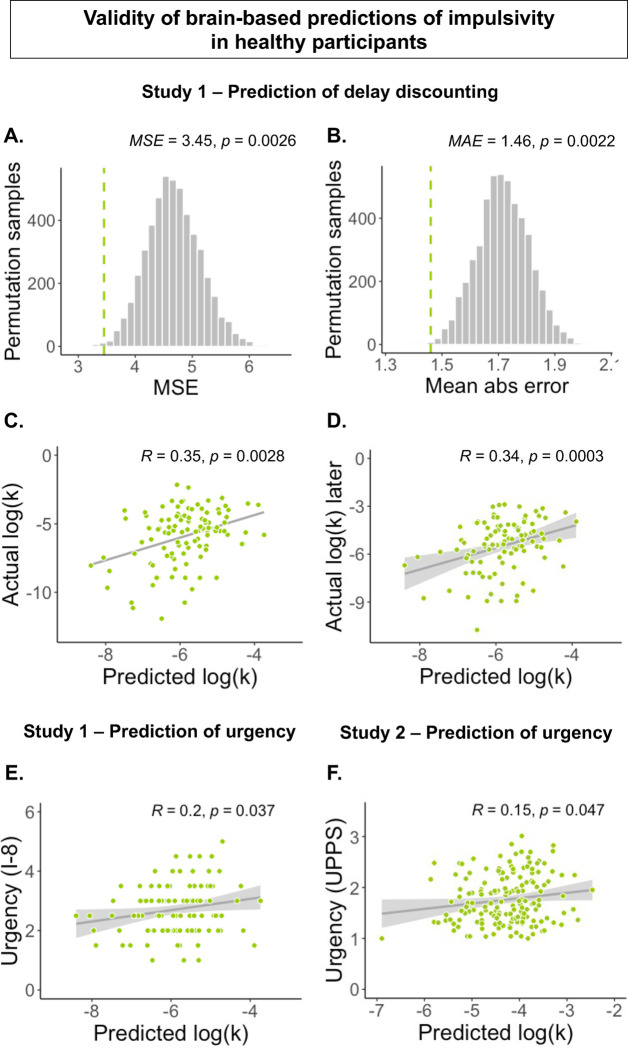
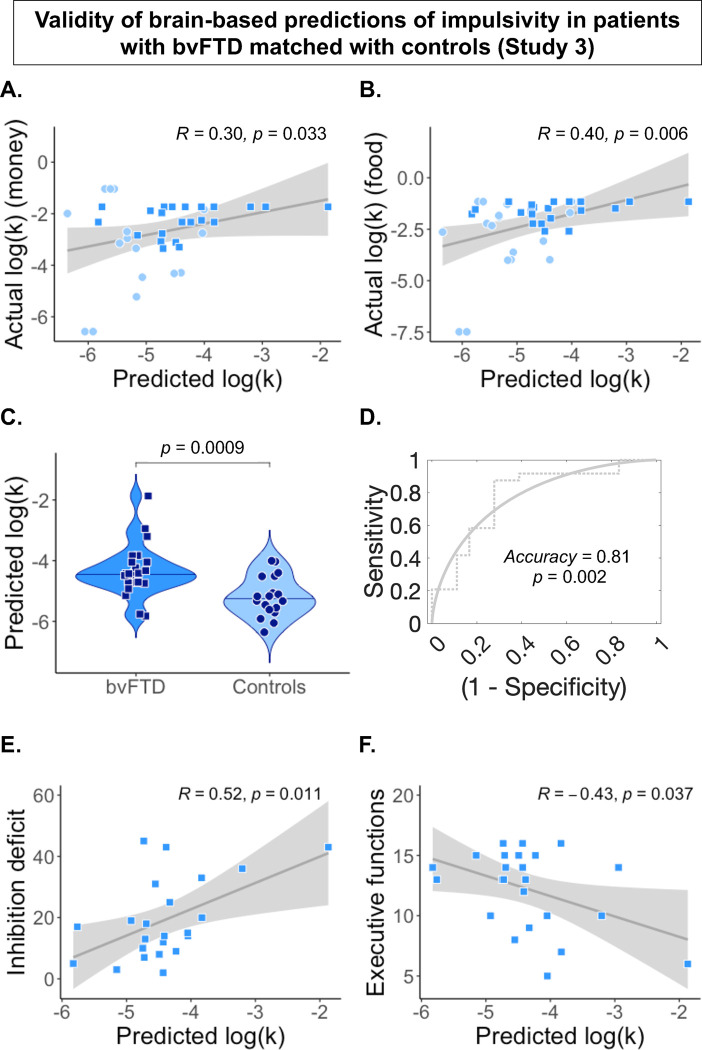
Impulsivity and higher preference for sooner over later rewards (i.e., delay discounting) are transdiagnostic markers of many psychiatric and neurodegenerative disorders. Yet, their neurobiological basis is still debated. Here, we aimed at 1) identifying a structural MRI signature of delay discounting in healthy adults, and 2) validating it in patients with behavioral variant frontotemporal dementia (bvFTD)-a neurodegenerative disease characterized by high impulsivity. We used a machine-learning algorithm to predict individual differences in delay discounting rates based on whole-brain grey matter density maps in healthy male adults (Study 1, N=117). This resulted in a cross-validated prediction-outcome correlation of r=0.35 (p=0.0028). We tested the validity of this brain signature in an independent sample of 166 healthy adults (Study 2) and its clinical relevance in 24 bvFTD patients and 18 matched controls (Study 3). In Study 2, responses of the brain signature did not correlate significantly with discounting rates, but in both Studies 1 and 2, they correlated with psychometric measures of trait urgency-a measure of impulsivity. In Study 3, brain-based predictions correlated with discounting rates, separated bvFTD patients from controls with 81% accuracy, and were associated with the severity of disinhibition among patients. Our results suggest a new structural brain pattern-the Structural Impulsivity Signature (SIS)-which predicts individual differences in impulsivity from whole-brain structure, albeit with small-to-moderate effect sizes. It provides a new brain target that can be tested in future studies to assess its diagnostic value in bvFTD and other neurodegenerative and psychiatric conditions characterized by high impulsivity.

Keywords: brain signature; decision-making; delay discounting; dementia; intertemporal choice; machine-learning; prediction.


Figures

Figure 1.
Figure 1.. Methodological approach for the development and validation of a structural brain signature of impulsivity.
A) Grey matter density (GMD) maps from healthy participants of Study 1 were used for the prediction of delay discounting (log(k)) by LASSO-PCR with 10-fold cross-validation. In each fold, the classifier was trained on 90% of the data and tested on the remaining 10% hold-out data to evaluate its predictive accuracy. The predictive whole-brain pattern obtained from Study 1 was then tested in two independent samples, on the data of participants of Study 2 (healthy participants), and Study 3 (patients with neurodegenerative dementia and matched healthy control participants). The brain pattern was applied to the grey matter density maps of each study’s participants to evaluate the validity of its predictions in different types of population. B) Several tests were performed in each of the four studies to assess the validity of the structural signature trained and cross-validated in Study 1. In Study 1 (the training and cross-validation sample), permutation tests on different metrics (MSE, RMSE, MAE) and in particular on the correlation between predicted and actual log(k) were used to investigate the predictive accuracy of the developed brain pattern; the validity of predictions was also assessed through testing their correlation with out-of-sample log(k) measured several weeks later and with a self-report measure of the urgency component of impulsivity trait (subscale of Impulsive Behavior Short Scale). Study 2 and 3 served as independent test samples to further validate and generalize the structural signature developed in Study 1. In Study 2, we tested whether brain-based predictions correlated with the actual log(k)’s computed in the sample and with self-reported urgency trait (mean of positive and negative urgency subscales of UPPS- Impulsive Behavior Scale). In Study 3, which involved patients with behavioral variant frontotemporal dementia (bvFTD) matched with healthy controls, we tested: 1) correlations between the brain pattern predictions and observed delay discounting for two types of stimuli (money and food) across patients and controls; 2) the ability of brain-based predictions to distinguish patients from controls; 3) correlations between measures of impulsivity symptoms (inhibition and executive deficits) and brain-based predictions among patients.
Figure 2.
Figure 2.. Predictive validity of the structural brain pattern in Study 1 and Study 2.
A) Mean squared error (MSE) of prediction and significance obtained by permutation test (5,000 samples – N=113 males). B) Mean absolute error (MAE) of prediction and significance obtained by permutation test (5,000 samples – N=113 males). C) Correlation between predicted log(k) and actual log(k) in Study 1 and significance of prediction-outcome correlation obtained by permutation test (5,000 samples – N=113 males). D) Test of the parametric correlation between predicted log(k) and actual log(k) assessed 7 weeks later in Study 1 (R=0.34, p<0.001, 95%-CI= [0.15, 0.50]). E) Test of the parametric correlation between predicted log(k) and self-reported urgency (subscale of I-8 Impulsive Behavior Short Scale) in Study 1 (R=0.20, p=0.037, 95%-CI= [0.01, 0.37]). F) Test of the parametric correlation between predicted log(k) and self-reported urgency (mean of positive and negative urgency subscales of UPPS-P Impulsive Behavior Scale) in Study 2 (R=0.15, p=0.047, 95%-CI= [0.002, 0.30]).
Figure 3.
Figure 3.. Predictive validity of the structural brain pattern in Study 3.
(A) Parametric correlation between predicted log(k) and actual log(k) assessed with monetary rewards in Study 3 (R=0.30, p=0.07, 95%-CI= [−0.02, 0.57]). Patients are represented as squares in darker blue and controls as circles in lighter blue. (B) Parametric correlation between predicted log(k) and actual log(k) assessed with food rewards in Study 3 (R=0.45, p=0.01, 95%-CI= [0.1, 0.64]). Patients are represented as squares in darker blue and controls as circles in lighter blue. (C) As expected, predicted log(k) was higher in bvFTD patients (N=24) than in controls (N=18) (t=3.60, p=0.0009, Cohen’s d=1.09, 95%-CI=[0.41, 1.76]). (D) ROC curve showing the performance of the brain-based prediction of log(k) in classification of bvFTD patients versus healthy controls (single interval test thresholded for optimal accuracy: accuracy=81 %, p= 0.002, AUC = 0.80, sensitivity = 87.5%, specificity = 72.2%). (E) Higher predicted log(k) was related to greater inhibition deficits (Hayling-error score) in bvFTD patients (R=0.52, p=0.01, 95%-CI= [0.14, 0.77]). (F) Higher predicted log(k) was related to more impaired executive functions (as measured with the FAB score) in bvFTD patients (R=−0.43, p=0.04, 95%-CI= [−0.71, −0.03]).
Figure 4.
Figure 4.. Spatial organization of the structural brain pattern developed in Study 1.
A) Whole-brain weight map thresholded at p=0.05 (uncorrected for multiple comparisons across the brain) resulting from a bootstrapping procedure (5,000 samples); negative weights (contributing to lower discounting with higher grey matter density) are shown in blue. Positive weights (contributing to higher discounting with higher grey matter density) are shown in orange. The three framed clusters correspond to the three clusters in which peaks are significant at q=0.05 FDR-corrected. Regions indicated in italics are some of the main regions significant at p=0.001, uncorrected (OFC: orbitofrontal cortex; vmPFC: ventromedial prefrontal cortex; VS: ventral striatum; AI: anterior insula; ACC: anterior cingulate cortex). B) On the left, spatial correlations of the unthresholded delay discounting brain pattern with thresholded meta-analytic uniformity maps from Neurosynth (http://www.neurosynth.org). As in , we selected meta-analytic maps corresponding to three types of functions assumed to be involved in delay discounting: 1/ valuation and emotion processing; 2/ executive control; 3/ memory and prospection. Spatial correlations are descriptive and indicate the extent of spatial similarities between the structural brain pattern and the functional networks of interest . Highest correlations (or similarities) were observed with the “Emotions”, “Affect”, “Conflict”, and “Imagery” meta-analytic maps, and were all negative, meaning that higher grey matter density in these functional regions is associated with lower discounting. On the right, we show the spatial distribution and overlap between the four meta-analytic maps found to be the most negatively correlated with the structural brain pattern (from 1, corresponding to non-overlapping regions from only one map, to 4, corresponding to regions of overlap between the 4 maps).
Figure 5.
Figure 5.. Spatial distribution of regions contributing to higher predicted discounting in bvFTD in Study 3.
We computed an importance map as the unsummed matrix dot product between the Structural Impulsivity Signature (SIS) (developed in Study 1) and the individual grey matter density map of each Study 3 participant. Since higher resulting dot product contributes to higher predicted discounting, the importance map shows how brain regions contribute to increased (or decreased) predicted discounting in each individual. We performed a t-test contrasting bvFTD patients and controls (bvFTD > controls) on the resulting importance maps, to show in particular the regions in which the contribution to higher discounting was significantly higher in bvFTD than in controls. Within regions showing atrophy in bvFTD (see 6.A), those corresponding to negative (/positive) weights in the whole-brain predictive pattern (see 6.B) contributed to increase (/decrease) discounting in bvFTD (see 6.C). (A) VBM–derived grey matter atrophy map of bvFTD patients contrasted with matched controls (bvFTD<Controls), FWE-corrected and thresholded at p < 0.05. (B) Unthresholded whole-brain weight map of the structural brain pattern developed in Study 1 and used in Study 2 to predict delay discounting in bvFTD patients (N=24) and matched controls (N=18). Negative weights (contributing to lower discounting with higher grey matter density) are in blue and positive weights (contributing to higher discounting with higher grey matter density) are in orange. (C) Contrast between bvFTD patients and controls (bvFTD>Controls)) on the importance map, FWE-corrected and thresholded at p < 0.05; this map shows regions contributing to increase discounting in bvFTD patients (compared to controls) in red and regions contributing to decrease discounting in bvFTD patients (compared to controls) in blue, the balance being in favor of a global increase in predicted discounting in bvFTD patients.

References

    1. Chamberlain S. R. & Sahakian B. J. The neuropsychiatry of impulsivity. Curr. Opin. Psychiatry 20, 255–261 (2007). - PubMed
    1. Chamberlain S. R., Stochl J., Redden S. A. & Grant J. E. Latent traits of impulsivity and compulsivity: toward dimensional psychiatry. Psychol. Med. 48, 810–821 (2018). - PMC - PubMed
    1. Goodwin B. C., Browne M., Hing N. & Russell A. M. Applying a revised two-factor model of impulsivity to predict health behaviour and well-being. Personal. Individ. Differ. 111, 250–255 (2017).
    1. Rogers M. M., Kelley K. & McKinney C. Trait impulsivity and health risk behaviors: A latent profile analysis. Personal. Individ. Differ. 171, 110511 (2021).
    1. Bjork J. M., Momenan R. & Hommer D. W. Delay discounting correlates with proportional lateral frontal cortex volumes. Biol. Psychiatry 65, 710–713 (2009). - PubMed

Publication types

LinkOut - more resources