[Preprint]. 2024 Sep 16:2024.04.23.590798.
doi: 10.1101/2024.04.23.590798.

Immune perturbations in human pancreas lymphatic tissues prior to and after type 1 diabetes onset

Affiliations

Immune perturbations in human pancreas lymphatic tissues prior to and after type 1 diabetes onset

Gregory J Golden et al. bioRxiv. .

Update in

Abstract

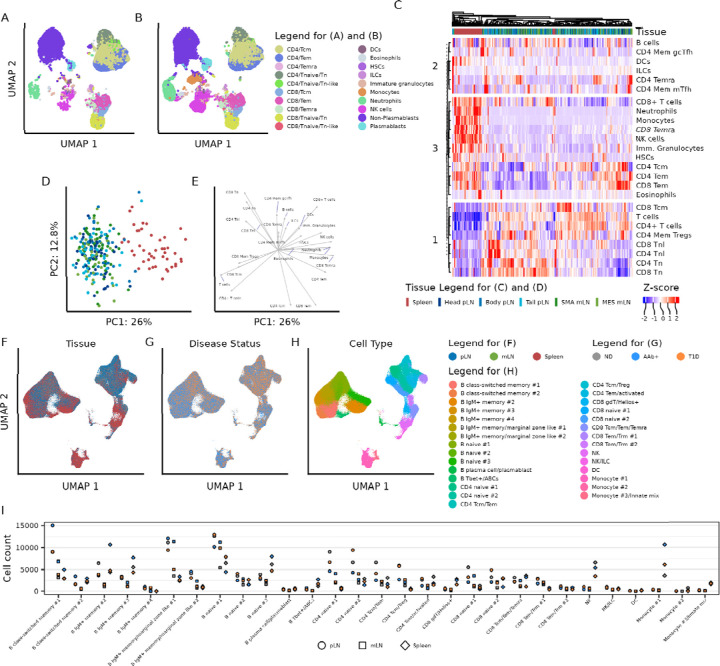
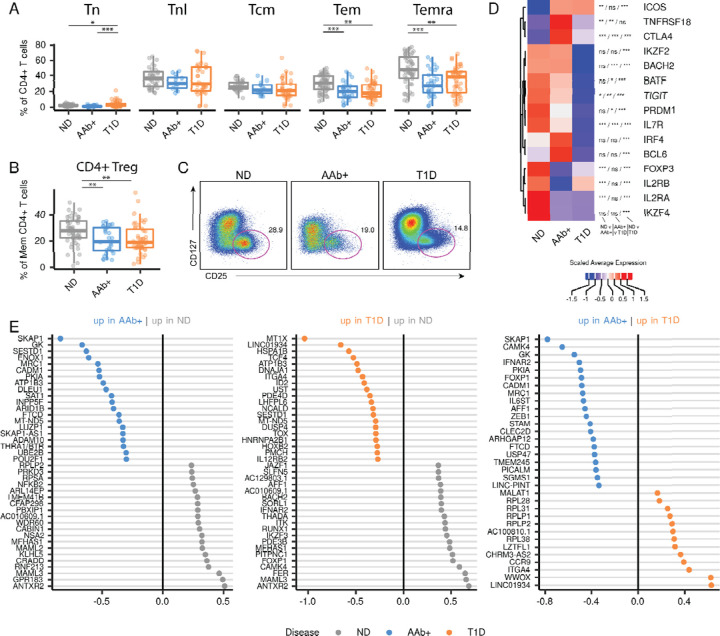
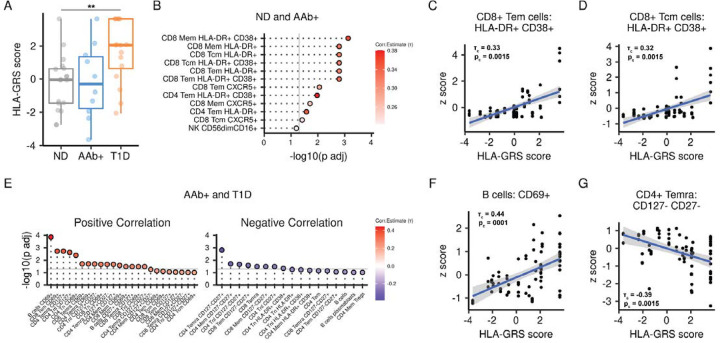
Autoimmune destruction of pancreatic β cells results in type 1 diabetes (T1D), with pancreatic immune infiltrate representing a key feature in this process. Studies of human T1D immunobiology have predominantly focused on circulating immune cells in the blood, while mouse models suggest diabetogenic lymphocytes primarily reside in pancreas-draining lymph nodes (pLN). A comprehensive study of immune cells in human T1D was conducted using pancreas draining lymphatic tissues, including pLN and mesenteric lymph nodes, and the spleen from non-diabetic control, β cell autoantibody positive non-diabetic (AAb+), and T1D organ donors using complementary approaches of high parameter flow cytometry and CITEseq. Immune perturbations suggestive of a proinflammatory environment were specific for T1D pLN and AAb+ pLN. In addition, certain immune populations correlated with high T1D genetic risk independent of disease state. These datasets form an extensive resource for profiling human lymphatic tissue immune cells in the context of autoimmunity and T1D.

Keywords: CITEseq; Type 1 diabetes; flow cytometry; mesenteric lymph node; pancreatic lymph node; spleen.


Conflict of interest statement

Ethics Declarations The authors declare no competing interests.

Figures

Figure 1.
Figure 1.. Immune profiling of pancreatic, mesenteric, and splenic lymphatic tissues
(A) UMAP representation of pLN-Tail lymphocytes and (B) splenocytes, highlighting immune lineage populations detected with flow cytometry. (C) Hierarchical clustering of all samples within the flow cytometry dataset using major immune lineage populations. Coloring of the heatmap represents an individual sample’s Z-score within the respective immune population. Immune lineage population clustering patterns were labeled and partitioned at k-means clustering level 3. (D) PCA and (E) biplot of all flow cytometry samples using frequencies of major immune lineage populations. (F) UMAP representation of the RNA component of the CITEseq dataset colored by tissue origin, (G) disease status, and (H) cluster annotation of each cell. (I) Number of cells within each cluster, further subsetted by tissue type and disease state.
Figure 2.
Figure 2.. AAb+ and T1D associated shifts in immune phenotypes
(A) Heatmap of immune populations, detected by flow cytometry, from each tissue type that are significantly different in frequency in at least one comparison between disease states. Coloring of the heatmap represents the mean of Z-scores for a specific immune population within the specified tissue type. Statistical significance was calculated with robust one-way ANOVA, with post hoc testing using Hochberg’s multiple comparison adjustment. Only immune populations with a differential p-value < 0.01 in at least one disease comparison were plotted. (B) Modules of interest generated using WGCNA analysis on scRNAseq data from pLN lymphocytes in ND and T1D disease states. (C) Correlations of modules of interest between ND and T1D disease states, across all immune cell clusters. For all panels, * is p < 0.05, ** is p < 0.01, *** is p < 0.001.
Figure 3.
Figure 3.. Loss and dysfunction of CD4+ Tregs in the pLN
(A) Frequency of pLN CD25+ cells or (B) CD25+ CD127− CD4+ Treg cells within CD4+ T cell subsets, as determined by flow cytometry. Statistical significance determined by robust ANOVA with post hoc testing using Hochberg’s multiple comparison adjustment. Boxplot represents median and interquartile range. (C) Representative two-parameter density plots of CD4+ Treg cells within the pLN, as measured by flow cytometry. (D) Expression of CD4+ Treg-associated genes within the CD4+ Treg/Tcm cluster from pLN. Expression scaled within each gene. Statistical significance determined by Wilcoxon Rank Sum Test and p-value adjustment using the Bonferroni method. (E) Top 20 differentially expressed genes (adjusted p value < 0.05, excluding common genes (see STAR Methods)) between disease states in FOXP3+ cells within the CD4 Treg/Tcm cluster in the pLN only. Statistical significance determined by Wilcoxon Rank Sum with genes with a log fold change threshold > 0.1 and p-value adjustment with the Bonferroni method across all combinatorial comparisons. For all panels in this figure, * is p < 0.05, ** is p < 0.01, *** is p < 0.001.
Figure 4.
Figure 4.. Decreased naive T cell signatures in T1D pLN
A) Frequency of pLN CD4+ Tn within total CD4+ T cells or (B) pLN CD8+ Tn within total CD8+ T cells, as determined by flow cytometry. Statistical significance determined by robust ANOVA with post hoc testing using Hochberg’s multiple comparison adjustment. Boxplot represents median and interquartile range. (C) Mean normalized expression of the top 10 most inter-connected genes in WGCNA module 15, plotted across the naive T cell clusters in the pLN and disease state. (D) Frequency of the two naive CD4+ T cell clusters and (E) the two naive CD8+ T cell clusters in the pLN, across disease states. Boxplot represents median and interquartile range. P value determined by Wilcoxon ranked sum test with Benjamini-Hochberg multiple test correction. (F) Normalized expression of genes of interest from WGCNA module 15, from the pLN only. Statistical significance determined by Wilcoxon Rank Sum Test with a log fold change threshold of 0.1 and p-value adjustment using the Bonferroni method. (G) Differentially expressed WGCNA module 15 genes CD4 Naive #1 and CD4 Naive #2 clusters and (H) CD8 Naive #1 and CD8 Naive #2 clusters from the pLN, between ND and T1D donors. Statistical significance tested using Wilcoxon Rank Sum Test with p-value adjustment using the Bonferroni method. For all panels in this figure, * is p < 0.05, ** is p < 0.01, *** is p < 0.001.
Figure 5.
Figure 5.. Memory CD8+ T cells display a stem-like phenotype in AAb+ and T1D pLN
(A) Frequency of pLN CD25+ cells or (B) CD38+ cells within pLN CD8+ T cell subsets, as determined by flow cytometry. Statistical significance determined by robust ANOVA with post hoc testing using Hochberg’s multiple comparison adjustment. Boxplot represents median and interquartile range. (C) WGCNA module 7 and effector CD8+ T cell genes of interest mean normalized expression in the pLN, across disease state. (D) Normalized expression of CXCR3 and TOX in CD8 Tcm/Tem/Temra cells in the pLN. Statistical significance determined by Wilcoxon Rank Sum test with Bonferroni correction done between all combinatorial tests. Dashed red line indicates the exclusive threshold (> 0.5) for demarcating positive gene expression for later plots. (E) Frequency of pLN CD8 Tcm/Tem/Temra cells expressing permutations of CXCR3 and TOX, across disease state. P value determined by Wilcoxon rank sum test with Benjamini-Hochberg multiple test correction. (F) Differential surface protein ADTs enriched in CXCR3-TOX+ cells and (G) CXCR3+TOX- cells compared to all other permutations of CXCR3 and TOX expression within CD8 Tcm/Tem/Temra cluster in the pLN. Total CD8+ T cells, total CD8+ T cells, the NK/ILC cell cluster, and total B cells were used as comparators. Surface markers are ranked in descending order of fold change between CXCR3-TOX+ cells and CXCR3+TOX− cells. Statistical significance determined by Wilcoxon rank sum test on ADTs with log fold change threshold > 0.1 followed by Bonferroni multiple test adjustment (adjusted p value < 0.05 denotes significant differential expression). Populations of interest highlighted by the black outline. (H) Genes differentially expressed in CXCR3-TOX+ cells and (I) CXCR3+TOX− cells compared to all other permutations of CXCR3 and TOX expression within CD8 Tcm/Tem/Temra cluster in the pLN. Genes are ranked in descending order of fold change between CXCR3-TOX+ cells and CXCR3+TOX− cells. Statistical significance determined by Wilcoxon rank sum test with log fold change threshold > 0.25 followed by Bonferroni multiple test adjustment (adjusted p value < 0.05). Only genes with a p < 0.0001 are plotted. Populations of interest highlighted by the black outline. For all panels in this figure, * is p < 0.05, ** is p < 0.01, *** is p < 0.001.
Figure 6.
Figure 6.. Cytotoxic NK cells more prominent in T1D pLN
(A) Frequency of CD56dimCD16+ NK cells within the pLN, as measured by flow cytometry. Statistical significance determined by robust ANOVA with post hoc testing using Hochberg’s multiple comparison adjustment. Boxplot represents median and interquartile range. (B) Representative two-parameter density plots images of NK cell subsets within the pLN. (C) List of differentially expressed genes, ranked by descending log2 fold change, of genes that are significantly more expressed in T1D pLN. Cells are from a combination of the NK and NK/ILC clusters, from the pLN only. Gene sets to test came from the Module 7 of the WGCNA analysis, which was significantly increased in NK cell clusters in T1D, and from the “Natural killer cell mediated cytotoxicity” gene set from Kyoto Encyclopedia of Genes and Genomes (KEGG). (D) Normalized expression of GZMB and (E) KLRB1 within the combined NK and NK/ILC clusters in the pLN. Statistical significance tested using Wilcoxon Rank Sum Test with p-value adjustment using the Bonferroni method. (F) Mean normalized expression of genes significantly increased in GZMB+ and (G) GZMB− cells from the combined NK and NK/ILC clusters in the pLN. P value determined by Wilcoxon Rank Sum Test with p-value adjustment using the Bonferroni method. For all panels in this figure, * is p < 0.05, ** is p < 0.01, *** is p < 0.001.
Figure 7.
Figure 7.. Immune populations correlate with HLA genetic risk
(A) HLA-GRS score of donors in the cohort. Boxplot represents median and interquartile range. P value generated with Dunn’s test with multiple hypothesis correction adjustment using Holm’s method. * is p < 0.05. (B) Immune populations that significantly correlate with HLA-GRS in ND and AAb+ donors. Grey line represents an adjusted p value ≥ 0.05. Dot fill represents a Kendall tau correlation value corrected for disease state effects. (C) and (D) Representative plots of HLA-GRS versus immune population frequency in ND and AAb+ donors. τc is the Kendall tau correlation value corrected for disease state effects, represented by the blue linear regression line with standard error in grey. pc is the p value adjusted for disease state effects and corrected with Benjamini-Hochberg multiplicity adjustment. (E) Immune populations that significantly correlate with HLA-GRS in AAb+ and T1D donors. All plot parameters follow (B). (F) and (G) Representative plots of HLA-GRS versus immune population frequency in AAb+ and T1D donors. All plot parameters follow (C) and (D).

Similar articles

References

    1. Atkinson M. A., Eisenbarth G. S. & Michels A. W. Type 1 diabetes. Lancet 383, 69–82 (2014). - PMC - PubMed
    1. Insel R. A., Dunne J. L., Atkinson M. A., Chiang J. L., Dabelea D., Gottlieb P. A., Greenbaum C. J., Herold K. C., Krischer J. P., Lernmark Å., Ratner R. E., Rewers M. J., Schatz D. A., Skyler J. S., Sosenko J. M. & Ziegler A.-G. Staging presymptomatic type 1 diabetes: a scientific statement of JDRF, the Endocrine Society, and the American Diabetes Association. Diabetes Care 38, 1964–1974 (2015). - PMC - PubMed
    1. Oram R. A., McDonald T. J., Shields B. M., Hudson M. M., Shepherd M. H., Hammersley S., Pearson E. R., Hattersley A. T. & UNITED Team. Most people with long-duration type 1 diabetes in a large population-based study are insulin microsecretors. Diabetes Care 38, 323–328 (2015). - PMC - PubMed
    1. Williams G. M., Long A. E., Wilson I. V., Aitken R. J., Wyatt R. C., McDonald T. J., Wong F. S., Hattersley A. T., Williams A. J. K., Bingley P. J. & Gillespie K. M. Beta cell function and ongoing autoimmunity in long-standing, childhood onset type 1 diabetes. Diabetologia 59, 2722–2726 (2016). - PMC - PubMed
    1. Gubitosi-Klug R. A., Braffett B. H., Hitt S., Arends V., Uschner D., Jones K., Diminick L., Karger A. B., Paterson A. D., Roshandel D., Marcovina S., Lachin J. M., Steffes M., Palmer J. P. & DCCT/EDIC Research Group. Residual β cell function in long-term type 1 diabetes associates with reduced incidence of hypoglycemia. J. Clin. Invest. 131, (2021). - PMC - PubMed

Publication types

LinkOut - more resources