[Preprint]. 2024 Sep 19:2023.07.06.547975.
doi: 10.1101/2023.07.06.547975.

Contributions of associative and non-associative learning to the dynamics of defensive ethograms

Affiliations

Contributions of associative and non-associative learning to the dynamics of defensive ethograms

Quan-Son Eric Le et al. bioRxiv. .

Update in

Abstract

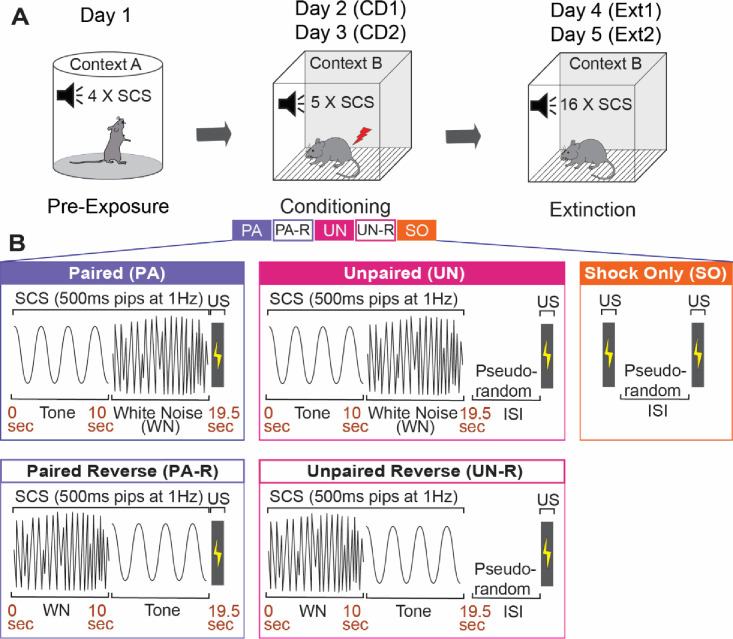
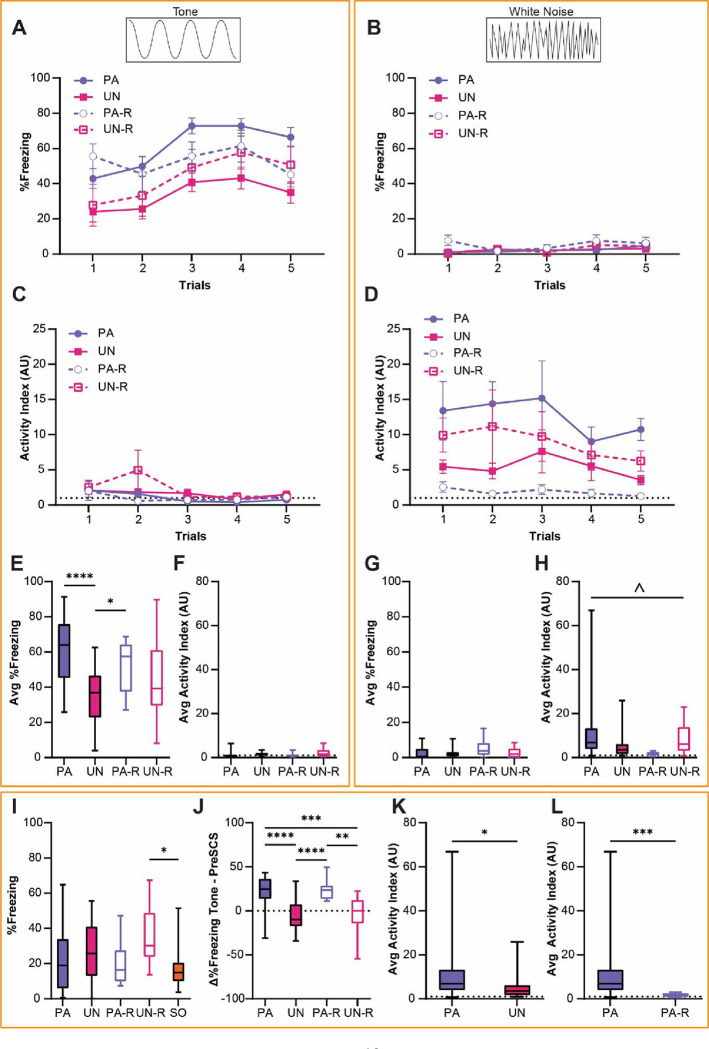
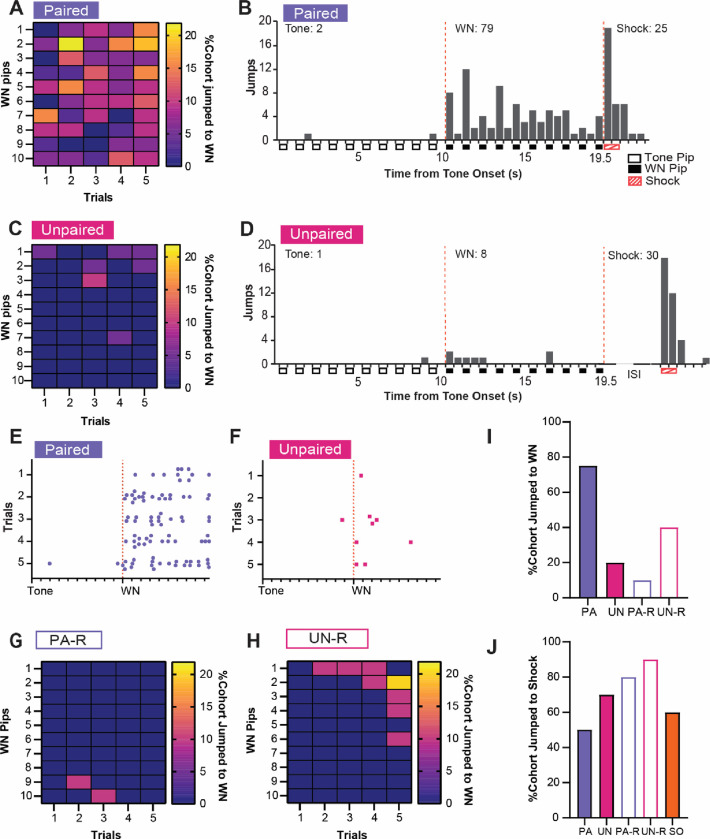
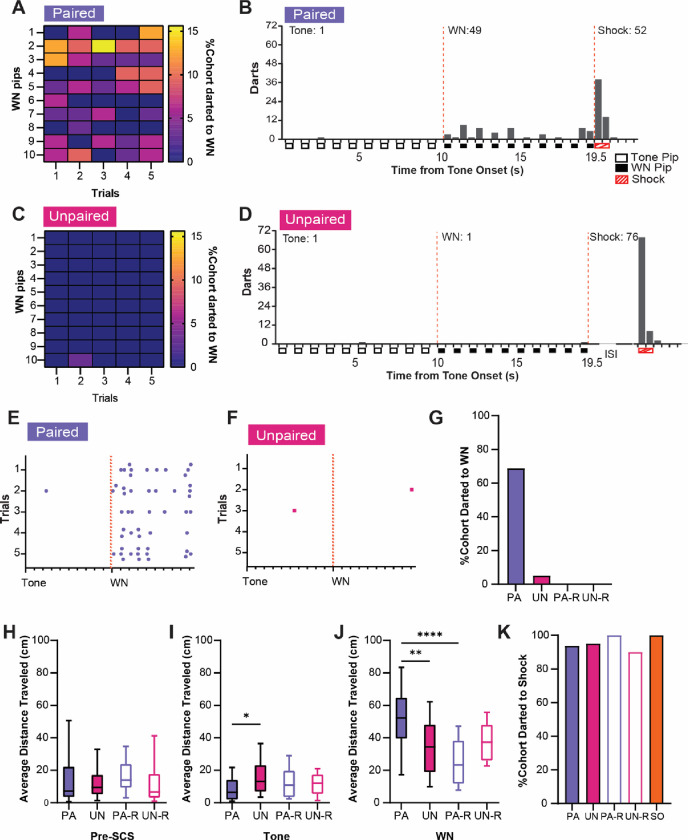
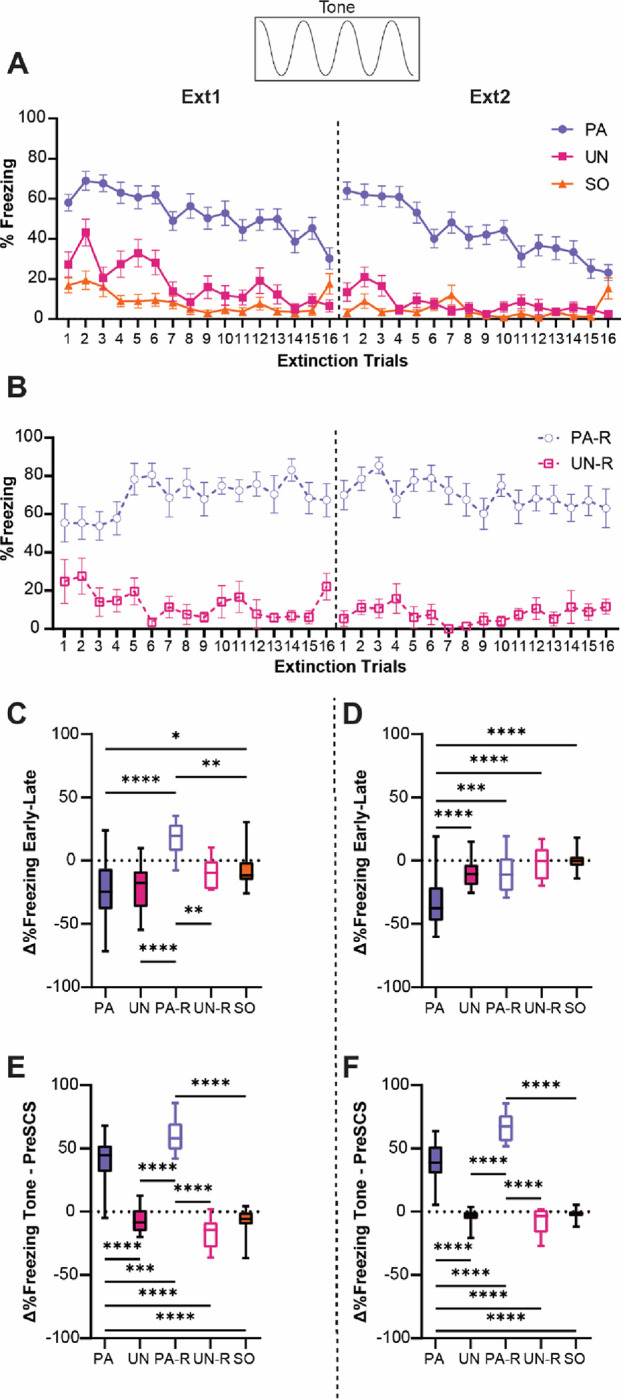
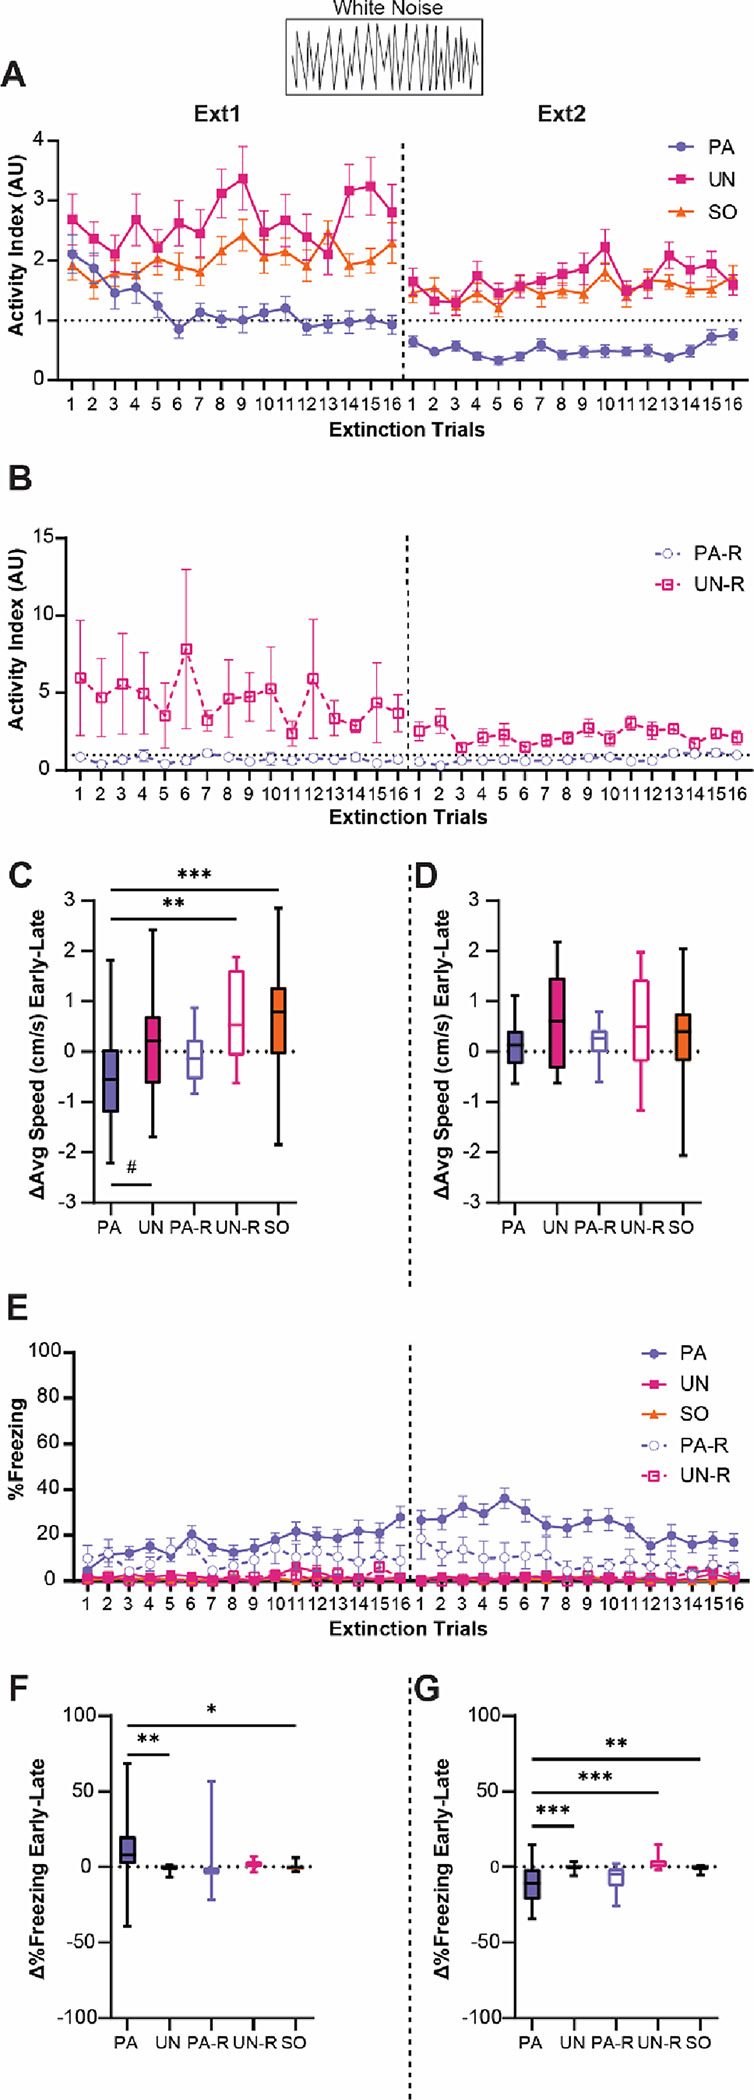
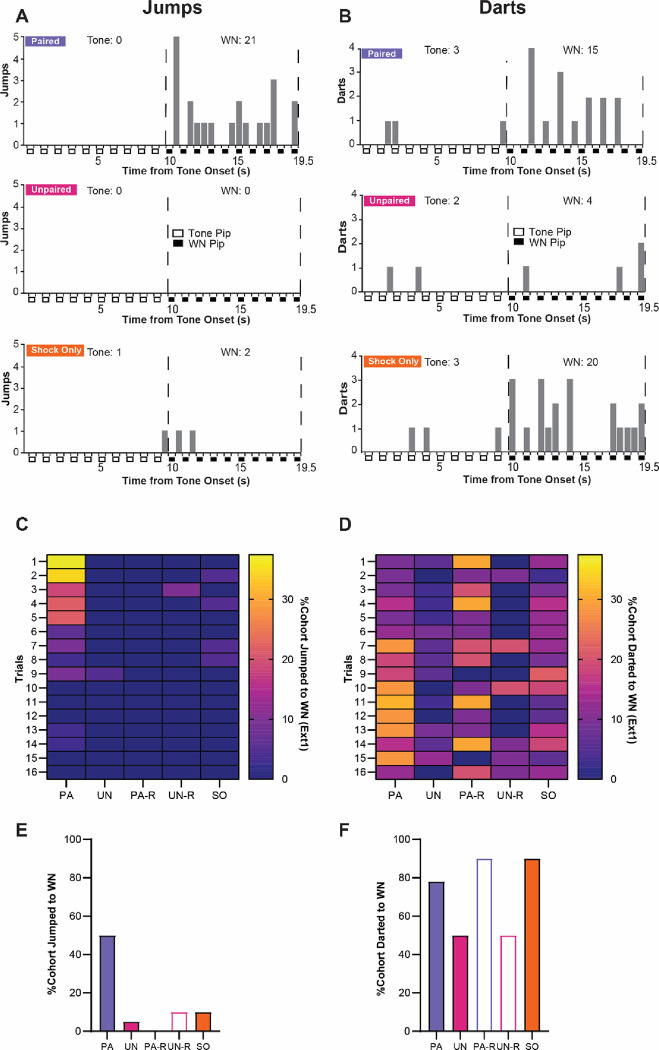
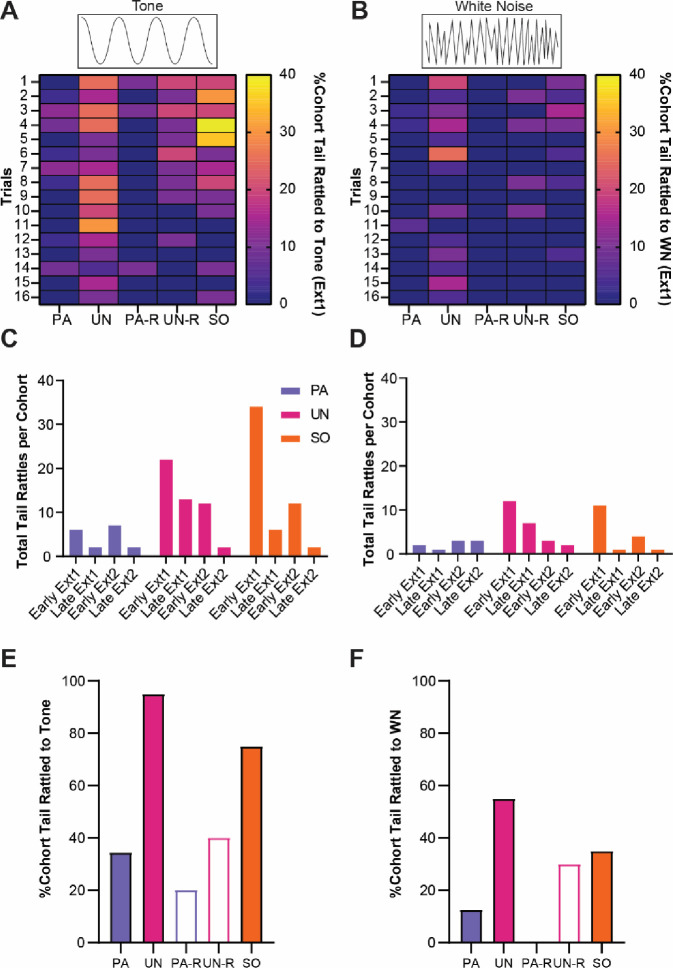
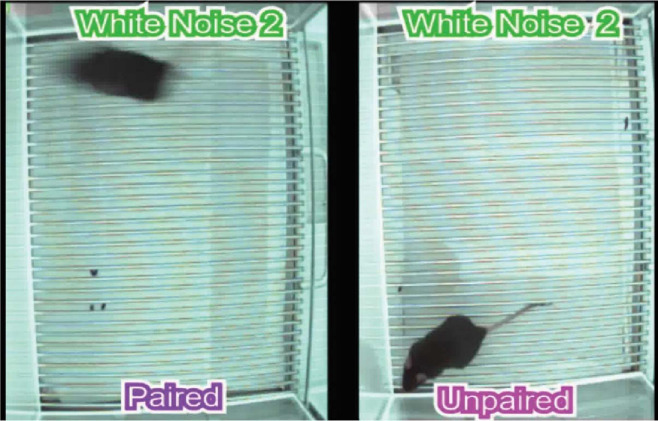
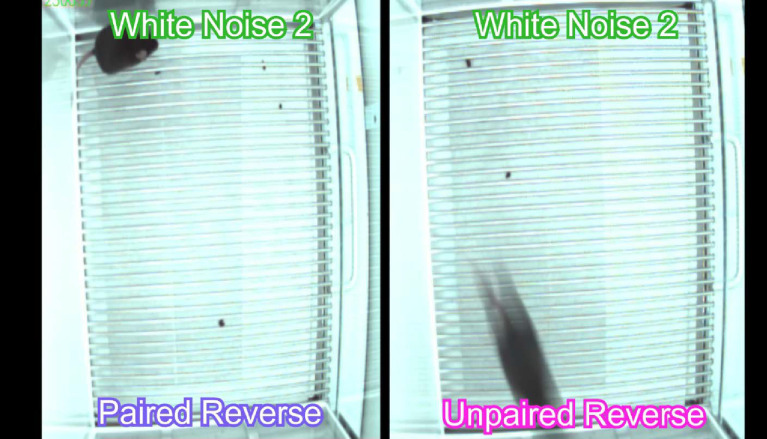
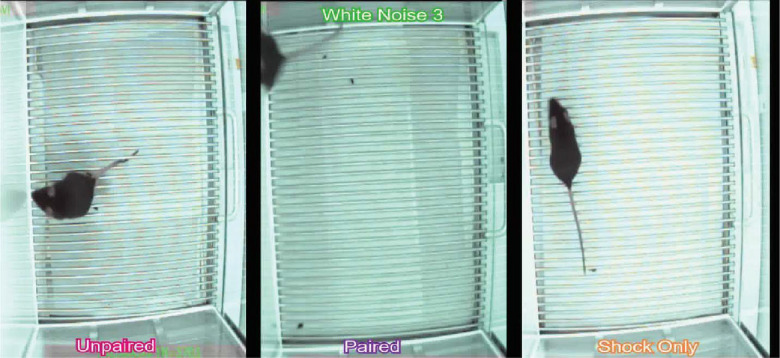
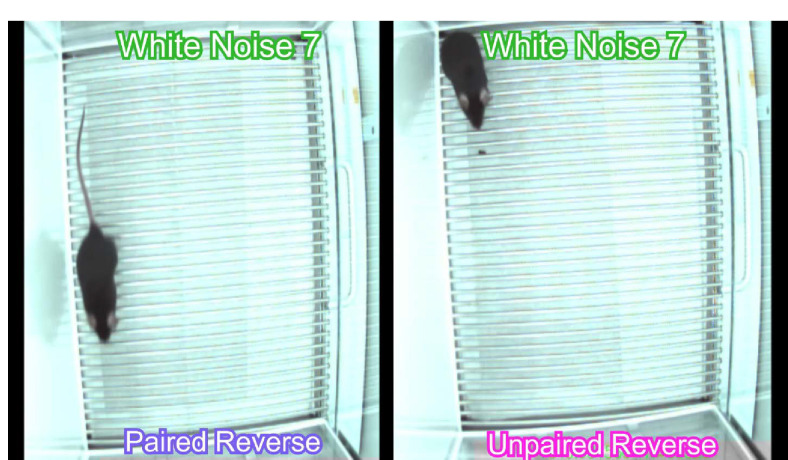
Defensive behavior changes based on threat intensity, proximity, and context of exposure, and learning about danger-predicting stimuli is critical for survival. However, most Pavlovian fear conditioning paradigms focus only on freezing behavior, obscuring the contributions of associative and non-associative mechanisms to dynamic defensive responses. To thoroughly investigate defensive ethograms, we subjected male and female adult C57BL/6J mice to a Pavlovian conditioning paradigm that paired footshock with a serial compound stimulus (SCS) consisting of distinct tone and white noise (WN) stimulus periods. To investigate how associative and non-associative mechanisms affect defensive responses, we compared this paired SCS-footshock group with four control groups that were conditioned with either pseudorandom unpaired presentations of SCS and footshock, shock only, or reversed SCS presentations with inverted tone--WN order, with paired or unpaired presentations. On day 2 of conditioning, the paired group exhibited robust freezing during the tone period with switching to explosive jumping and darting behaviors during the WN period. Comparatively, the unpaired and both reverse SCS groups expressed less tone-induced freezing and rarely showed jumping or darting during WN. Following the second day of conditioning, we observed how defensive behavior changed over two extinction sessions. During extinction, the tone-induced freezing decreased in the paired group and mice rapidly shifted from escape jumping during WN to a combination of freezing and darting. The unpaired, unpaired reverse, and shock-only groups displayed defensive tail rattling and darting during the SCS, with minimal freezing and jumping. Interestingly, the paired reverse group did not jump to WN, and tone-evoked freezing was resistant to extinction. These findings demonstrate that non-associative factors promote some defensive responsiveness, but associative factors are required for robust cue-induced freezing and high-intensity flight expression.


Conflict of interest statement

Conflict of interest statement: The authors declare no competing financial interests.

Figures

Figure 1.
Figure 1.
Experimental Design. A, Graphical representation of the three stages of the SCS conditioning paradigm. B, Five SCS-shock association variants were used during conditioning. SCS, Serial compound stimulus; CD1, Conditioning Day 1; CD2, Conditioning Day 2; Ext1, Extinction Day 1; Ext2, Extinction Day 2; US, Unconditioned stimulus; ISI, Inter-stimulus interval.
Figure 2.
Figure 2.
Stimulus-evoked freezing and activity during CD2 are affected by SCS-shock contingency. A, Trial-by-trial freezing during the tone period. B, Trial-by-trial freezing during the WN period. C, Trial-by-trial activity index during the tone period. D, Trial-by-trial activity index during the WN period. E, Average freezing during the tone period from all trials of CD2. F, Average activity index scores during the tone period from all trials of CD2. G, Average freezing during the WN period from all trials of CD2. H, Average activity index scores during the WN period from all trials of CD2. I, Baseline contextual freezing levels during CD2. J, Differences in freezing between pre-SCS and tone periods from all trials of CD2. K, Average activity index scores during the WN period for the PA and UN groups from all trials of CD2. L, Average activity index scores during the WN for the PA and PA-R groups from all trials of CD2. Data from Figures 2A–2D are presented as mean ± SEM. Data from Figures 2E–2L are presented as box-and-whisker plots from min to max. *p<0.05; **p<0.01; ***p<0.001; ****p<0.0001; ^p<0.05, effect of group.
Figure 3.
Figure 3.
Associative pairings of the SCS and shock lead to robust escape jumping during WN. A, The percentage of the PA group that exhibited jumping during WN on CD2. Data are distributed across 1 s bins, each coinciding with one of the ten pips of WN that occurred during each SCS presentation. B, The cumulative distribution of jumps from 20 randomly selected subjects of the PA group across the duration of the SCS from all 5 trials of CD2. Empty boxes represent each 0.5 s pip of tone, filled boxes represent each 0.5 s pip of WN, and striped boxes represent the 1 s shock stimulus. The vertical dotted lines depict the onset and termination of the WN period. Total jumps per stimulus are listed above histogram bars. C, The percentage of the UN group that exhibited jumping during WN on CD2. Data are distributed across 1 s bins, each coinciding with one of the ten pips of WN that occurred during each SCS presentation. D, The cumulative distribution of jumps from the UN group across the duration of the SCS from all 5 trials of CD2. Empty boxes represent each 0.5 s pip of tone, filled boxes represent each 0.5 s pip of WN, and striped boxes represent the 1 s shock stimulus. The vertical dotted lines depict the onset and termination of the WN period. ISI represents the period between SCS and shock. Total jumps per stimulus are listed above histogram bars. E, The distribution of jumps across the duration of the SCS from 20 randomly selected subjects of the PA group for each trial of CD2. Each dot represents a single jump event, and each tick on the x-axis represents the onset of each pip of tone or WN. The vertical dotted line depicts the onset of the WN period. F, The distribution of jumps across the duration of the SCS from the UN group for each trial of CD2. Each dot represents a single jump event, and each tick on the x-axis represents the onset of each pip of tone or WN. The vertical dotted line depicts the onset of the WN period. G, The percentage of the PA-R group that exhibited jumping during WN on CD2. Data are distributed across 1 s bins, each coinciding with one of the ten pips of WN that occurred during each SCS presentation. H, The percentage of the UN-R group that exhibited jumping during WN on CD2. Data are distributed across 1 s bins, each coinciding with one of the ten pips of WN that occurred during each SCS presentation. I, Total percentage of cohort that jumped during WN over the whole CD2 session. J, Total percentage of cohort that jumped to shock over the whole CD2 session.
Figure 4.
Figure 4.
Associative SCS-shock pairings elicit darting responses to WN during CD2. A, The percentage of the PA group that exhibited darting responses to WN. Data are distributed across 1 s bins, each coinciding with one of the ten pips of WN that occurred during each SCS presentation. B, The cumulative distribution of darts from 20 randomly selected subjects of the PA group across the duration of the SCS. Empty boxes represent each 0.5 s pip of tone, filled boxes represent each 0.5 s pip of WN, and striped boxes represent the 1 s shock stimulus. The vertical dotted lines depict the onset and termination of the WN period. Total darts per stimulus are listed above the histogram. C, The percentage of the UN group that exhibited darting responses during WN. Data are distributed across 1 s bins, each coinciding with one of the ten pips of WN that occurred during each SCS presentation. D, The cumulative distribution of darts from the UN group across the duration of SCS. Empty boxes represent each 0.5 s pip of tone, filled boxes represent each 0.5 s pip of WN, and striped boxes represent the 1 s shock stimulus. The vertical dotted lines depict the onset and termination of the WN period. ISI represents the period between SCS and shock. Total darts per stimulus are listed above the histogram. E, The distribution of darts across the duration of SCS from 20 randomly selected subjects of the PA group. Each dot represents a single dart event, and each tick on the x-axis represents the onset of each pip of tone or WN. The vertical dotted lines depict the onset of the WN period. F, The distribution of darts across the duration of SCS from the UN group. Each dot represents a single dart event, and each tick on the x-axis represents the onset of each pip of tone or WN. The vertical dotted lines depict the onset of the WN period. G, The total percentage of each group that jumped during WN over the whole session. H, Average distance traveled during the preSCS period. I, Average distance traveled during the tone period. J, Average distance traveled during the WN period. K, The total percentage of each group that jumped to shock over the whole session. Data from Figures 4H–4J are presented as box-and-whisker plots from min to max. *p<0.05; **p<0.01; ****p<0.0001.
Figure 5.
Figure 5.
Tone-evoked freezing in the PA group is reduced by extinction learning. A, Percent freezing during the tone period for the PA, UN, and SO groups. B, Percent freezing during the tone period for the PA-R and UN-R. C, The difference in average freezing during the tone period between the first and last 4-trial bins of Ext1. D, The difference in average freezing during the tone period between the first and last 4-trial bins of Ext2. E, The difference in average freezing between pre-SCS and tone periods during Ext1. F, The difference in average freezing between pre-SCS and tone periods during Ext2. Data from Figures 5A and 5B are presented as Mean ± SEM. Data from Figures 5C–5F are presented as box-and-whisker plots from min to max. *p<0.05, **p<0.01, ***p<0.001, ****p<0.0001.
Figure 6.
Figure 6.
Stimulus-induced flight is associative and is partially replaced by freezing during extinction. A, Trial-by-trial activity during the WN period for the PA, UN, and SO groups during Ext1 and Ext2. B, Trial-by-trial activity during the WN period for the PA-R and UN-R groups during Ext1 and Ext2. C, Difference in average speed during the WN period from the first and last 4-trial bins of Ext1. D, Difference in average speed during the WN period from the first and last 4-trial bins of Ext2. E, Trial-by-trial freezing during the WN period for all groups during Ext1 and Ext2. F, Difference in freezing during the WN period from the first and last 4-trial bins of Ext1. G, Difference in freezing during the WN period from early and late 4-trial bins of Ext2. Data from Figures 6A, 6B, and 6E are presented as Mean ± SEM. Data from Figures 6C, 6D, 6F, and 6G are presented as box-and-whisker plots from min to max. #p=0.054, *p<0.05, **p<0.01, ***p<0.001.
Figure 7.
Figure 7.
Stimulus-evoked escape jumping and darting during extinction. A, The cumulative distribution of jumps from the first 4 trials of Ext1 for 20 randomly selected subjects from the PA group (top), the UN group (middle), and the SO group (bottom). Empty boxes represent each 0.5 s pip of tone, filled boxes represent each 0.5 s pip of WN, and the vertical dotted lines represent the onset and termination of the WN period. Total jumps per stimulus are listed above the histogram. B, The cumulative distribution of darts from the first 4 trials of Ext1 for 20 randomly selected subjects from the PA group (top), the UN group (middle), and the SO group (bottom). Empty boxes represent each 0.5 s pip of tone, filled boxes represent each 0.5 s pip of WN, and the vertical dotted lines represent the onset and termination of the WN period. Total darts per stimulus are listed above the histogram. C, The percentage of each group that exhibited jumping responses during the WN period of SCS per trial on Ext1. D, The percentage of each group that exhibited darting responses to the WN period of SCS per trial on Ext1. E, Total percentage of each cohort that jumped to WN over the whole Ext1 session. F, Total percentage of each cohort that darted to WN over the whole Ext1 session.
Figure 8.
Figure 8.
Tail rattling is a non-associative behavioral response during extinction. A, The percentage of each group that exhibited tail rattling to the tone. B, The percentage of each group that exhibited tail rattling to the WN. C, Cumulative tail rattling during tone across early and late periods of Ext1 and Ext2. D, Cumulative tail rattling during WN across early and late periods of Ext1 and Ext2. E, Total percentage of each cohort that tail rattled to tone during Ext1. F, Total percentage of each cohort that tail rattled to WN during Ext1.
Video 1.
Video 1.
Representative comparison of PA and UN groups’ response to SCS during conditioning. The video features audio of the SCS, which consists of 10 pips of tone followed by 10 pips of WN.
Video 2.
Video 2.
Representative comparison of PA-R and UN-R groups’ response to reverse SCS during conditioning. The video features audio of the reverse SCS, which consists of 10 pips of WN followed by 10 pips of tone.
Video 3.
Video 3.
Representative comparison of PA, UN, and SO groups’ responses to the SCS during an early and late extinction trial of the first extinction session. The video features audio of the SCS, which consists of 10 pips of tone followed by 10 pips of WN.
Video 4.
Video 4.
Representative comparison of PA-R and UN-R groups’ responses to the reverse SCS during an early and late extinction trial of the first extinction session. The video features audio of the reverse SCS, which consists of 10 pips of WN followed by 10 pips of tone.

Similar articles

References

    1. Akmese C, Sevinc C, Halim S, Unal G (2023) Differential role of GABAergic and cholinergic ventral pallidal neurons in behavioral despair, conditioned fear memory and active coping. Progress in Neuropsychopharmacology & Biological Psychiatry 125:110760. - PubMed
    1. Anderson DJ, Adolphs R (2014) A framework for studying emotions across species. Cell 157:187–200. - PMC - PubMed
    1. Biddle M, Knox D (2023) The role of estrogen receptor manipulation during traumatic stress on changes in emotional memory induced by traumatic stress. Psychopharmacology 240:1049–1061. - PubMed
    1. Blanchard RJ, Blanchard DC (1969) Passive and active reactions to fear-eliciting stimuli. Journal of Comparative and Physiological Psychology 68:129–135. - PubMed
    1. Bolles R (1970) Species-specific defense reactions and avoidance learning. Psychological Review 77:32–48.

Publication types

LinkOut - more resources