[Preprint]. 2024 Sep 22:2024.09.18.613658.
doi: 10.1101/2024.09.18.613658.

Quantitative analysis of non-histone lysine methylation sites and lysine demethylases in breast cancer cell lines

Affiliations

Quantitative analysis of non-histone lysine methylation sites and lysine demethylases in breast cancer cell lines

Christine A Berryhill et al. bioRxiv. .

Update in

Abstract

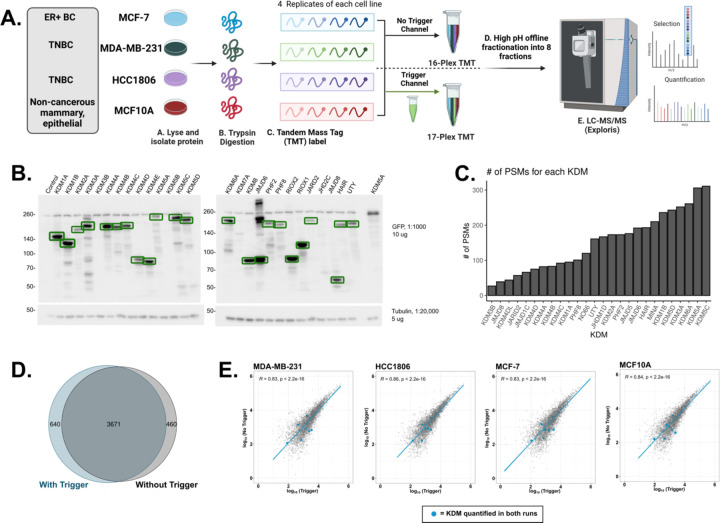
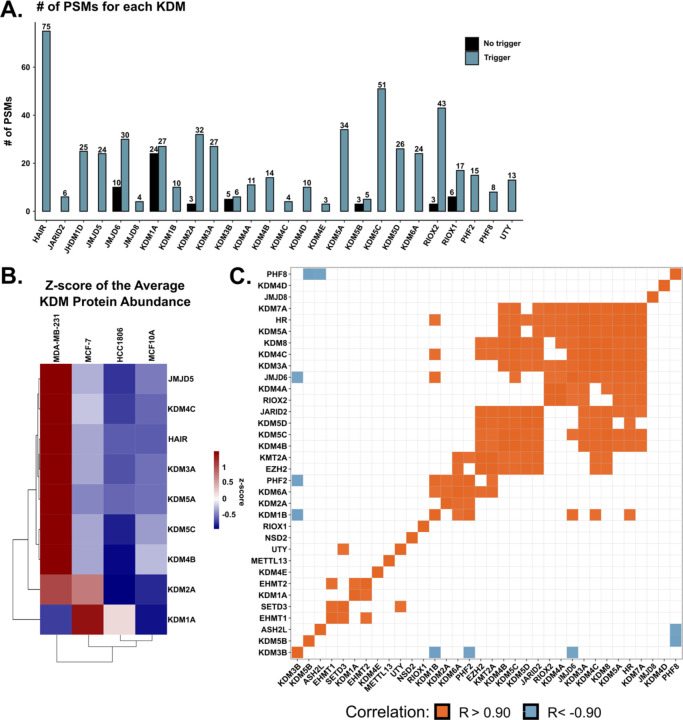
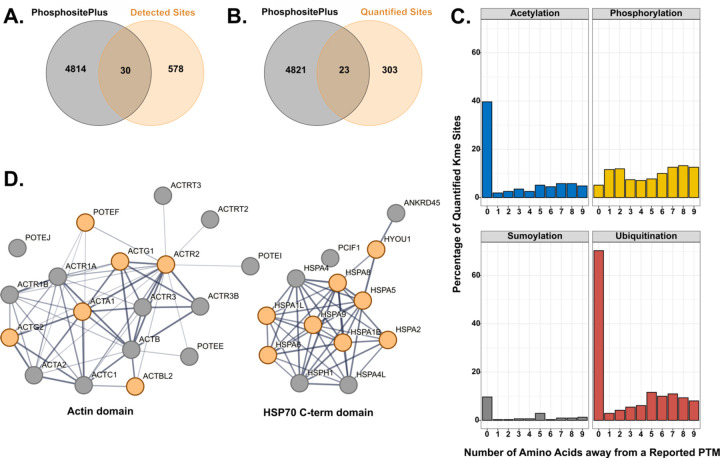
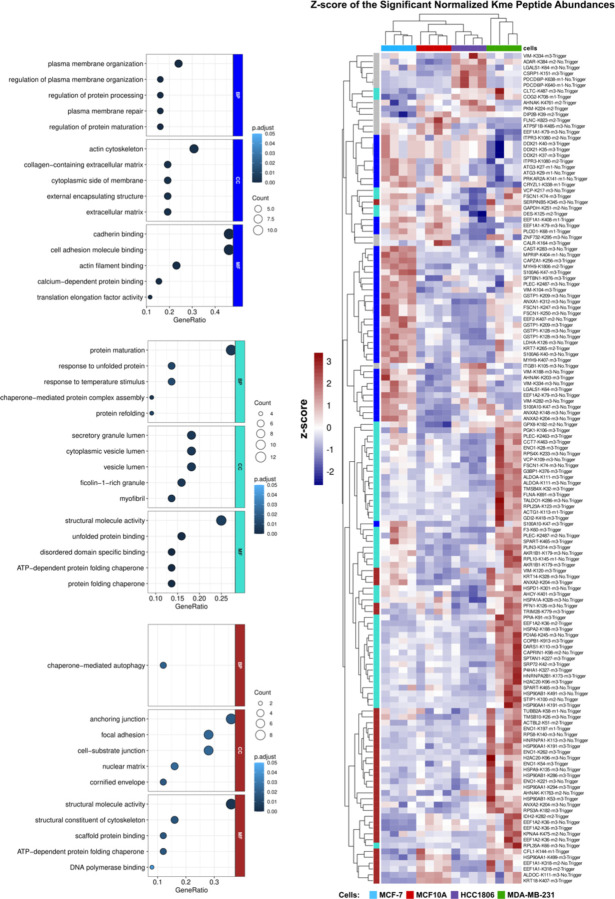
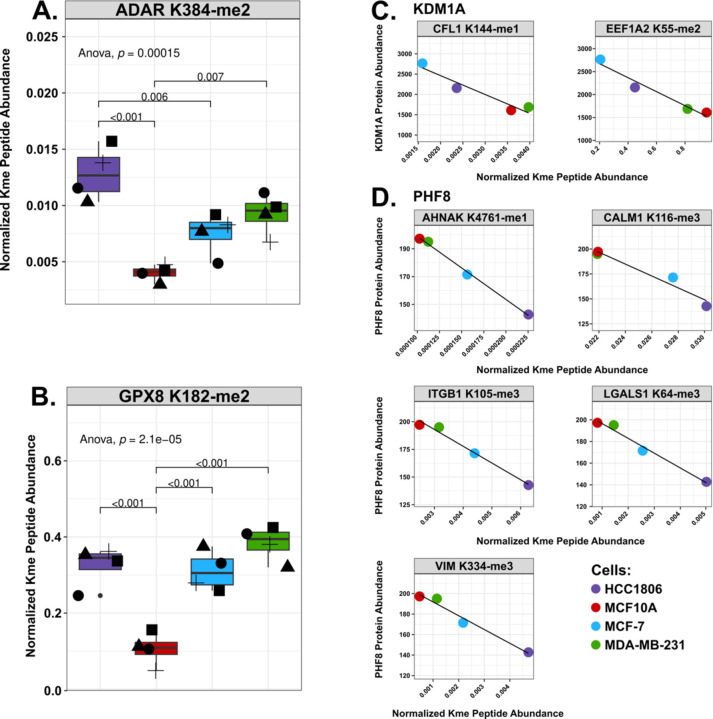
Growing evidence shows that lysine methylation is a widespread protein post-translational modification that regulates protein function on histone and non-histone proteins. Numerous studies have demonstrated that dysregulation of lysine methylation mediators contributes to cancer growth and chemotherapeutic resistance. While changes in histone methylation are well documented with extensive analytical techniques available, there is a lack of high-throughput methods to reproducibly quantify changes in the abundances of the mediators of lysine methylation and non-histone lysine methylation (Kme) simultaneously across multiple samples. Recent studies by our group and others have demonstrated that antibody enrichment is not required to detect lysine methylation, prompting us to investigate the use of Tandem Mass Tag (TMT) labeling for global Kme quantification sans antibody enrichment in four different breast cancer cell lines (MCF-7, MDA-MB-231, HCC1806, and MCF10A). To improve the quantification of KDMs, we incorporated a lysine demethylase (KDM) isobaric trigger channel, which enabled 96% of all KDMs to be quantified while simultaneously quantifying 326 Kme sites. Overall, 142 differentially abundant Kme sites and eight differentially abundant KDMs were identified between the four cell lines, revealing cell line-specific patterning.

Keywords: TMT; lysine demethylases; lysine methylation.


Figures

Figure 1:
Figure 1:. Comparison of the breast cancer proteomes with and without a lysine demethylase trigger channel.
A. Breast cancer cell lines (MCF-7, MDA-MB-231, HCC1806, or MCF10A; n = 4) were collected, lysed, and trypsin/Lys-C digested. Samples were then multiplexed using tandem mass tag (TMT) labels (16-plex). The trigger channel also received its own TMT label, which was then added in a 1:50 ratio to part of the 16-plex, resulting in one 16-plex and one 17-plex. Multiplexes were subjected to high pH offline fractionation and run on the LC-MS/MS. Proteome Discoverer (2.5) was used for database searching. B. Western Blot of the exogenous expression of all GFP-tagged KDMs. Green boxes indicate bands at the predicted molecular weight. C. Bar graph depicting the number of PSMs detected for each KDM detected in the IP-MS experiment. D. Venn Diagram of the quantified protein groups identified with and without the trigger channel. E. Pearson correlation of the log10 average protein abundances observed with (x-axis) and without (y-axis) the trigger channel. Plots are shown by cell line and KDMs quantified in both experiments are shown as blue points.
Figure 2:
Figure 2:. Quantification of lysine demethylases in breast cancer cell lines.
A. Bar graph depicting the number of PSMs observed with (blue) and without (black) the KDM trigger channel for the indicated KDM. B. Heatmap of the z-score of the differentially abundant average protein abundance. Rows are the indicated KDM, while columns are the indicated cell line. Columns and rows are clustered via hierarchical clustering (Euclidean distance). C. Matrix of the quantified KDMs and KMTs in the trigger channel experiment depicting significant positive (orange) and negative (blue) Pearson correlations of the average protein abundance.
Figure 3:
Figure 3:. Characterization of the quantified lysine methylation sites.
Venn diagram of previously observed Kme sites from PhosphoSitePlus© and those detected (A) or quantified (B) within this study. C. Percent of quantified Kme sites that either share the same site (position = 0) with or are within nine amino acids (position = 1–9) from observed acetylation, ubiquitination, sumoylation, or phosphorylation sites as annotated in PhosphoSitePlus© D. STRING network diagrams of domains enriched for lysine methylation. Orange circles represent proteins with a quantified Kme site within this study.
Figure 4:
Figure 4:. Lysine methylation has distinct profiles across breast cancer cell lines.
Heatmap of the differentially expressed Kme sites (n =142). Colors represent the z-score of the normalized Kme peptide abundance. Rows (Kme sites) and columns (cell line) are clustered by euclidian distance. Module colors indicate the module to which the Kme site belongs. Enriched GO terms found in the indicated modules are depicted on the left (blue, turquoise, brown) (p<0.05).
Figure 5:
Figure 5:. Comparison of normalized Kme site abundances and correlation with KDM levels.
A. Boxplots of the normalized Kme site abundances (y-axis) of ADAR K384-me2 and GPX8 K128-me2 in HCC1806 (purple), MCF10A (red), MCF-7 (red), and MDA-MB-231 (green). Shapes represent different biological replicates. B. Correlation between the protein abundance for indicated KDMs (KDM1A or PHF8) and normalized Kme peptide abundance as indicated (gray box).

References

    1. Berryhill C. A.; Hanquier J. N.; Doud E. H.; Cordeiro-Spinetti E.; Dickson B. M.; Rothbart S. B.; Mosley A. L.; Cornett E. M. Global Lysine Methylome Profiling Using Systematically Characterized Affinity Reagents. Sci Rep 2023, 13 (1), 377. 10.1038/s41598-022-27175-x. - DOI - PMC - PubMed
    1. Cornett E. M.; Ferry L.; Defossez P.-A.; Rothbart S. B. Lysine Methylation Regulators Moonlighting Outside the Epigenome. Molecular Cell 2019, 75 (6), 1092–1101. 10.1016/j.molcel.2019.08.026. - DOI - PMC - PubMed
    1. Liu S.; Hausmann S.; Carlson S. M.; Fuentes M. E.; Francis J. W.; Pillai R.; Lofgren S. M.; Hulea L.; Tandoc K.; Lu J.; Li A.; Nguyen N. D.; Caporicci M.; Kim M. P.; Maitra A.; Wang H.; Wistuba I. I.; Porco J. A.; Bassik M. C.; Elias J. E.; Song J.; Topisirovic I.; Van Rechem C.; Mazur P. K.; Gozani O. METTL13 Methylation of eEF1A Increases Translational Output to Promote Tumorigenesis. Cell 2019, 176 (3), 491–504.e21. 10.1016/j.cell.2018.11.038. - DOI - PMC - PubMed
    1. Park S. H.; Fong K.; Kim J.; Wang F.; Lu X.; Lee Y.; Brea L. T.; Wadosky K.; Guo C.; Abdulkadir S. A.; Crispino J. D.; Fang D.; Ntziachristos P.; Liu X.; Li X.; Wan Y.; Goodrich D. W.; Zhao J. C.; Yu J. Posttranslational Regulation of FOXA1 by Polycomb and BUB3/USP7 Deubiquitin Complex in Prostate Cancer. Sci. Adv. 2021, 7 (15), eabe2261. 10.1126/sciadv.abe2261. - DOI - PMC - PubMed
    1. Kim Y.; Nam H. J.; Lee J.; Park D. Y.; Kim C.; Yu Y. S.; Kim D.; Park S. W.; Bhin J.; Hwang D.; Lee H.; Koh G. Y.; Baek S. H. Methylation-Dependent Regulation of HIF-1α Stability Restricts Retinal and Tumour Angiogenesis. Nat Commun 2016, 7 (1), 10347. 10.1038/ncomms10347. - DOI - PMC - PubMed

Publication types

LinkOut - more resources