[Preprint]. 2024 Sep 22:2024.04.03.587937.
doi: 10.1101/2024.04.03.587937.

Endogenous hydrogen peroxide positively regulates secretion of a gut-derived peptide in neuroendocrine potentiation of the oxidative stress response in C. elegans

Affiliations

Endogenous hydrogen peroxide positively regulates secretion of a gut-derived peptide in neuroendocrine potentiation of the oxidative stress response in C. elegans

Qi Jia et al. bioRxiv. .

Update in

Abstract

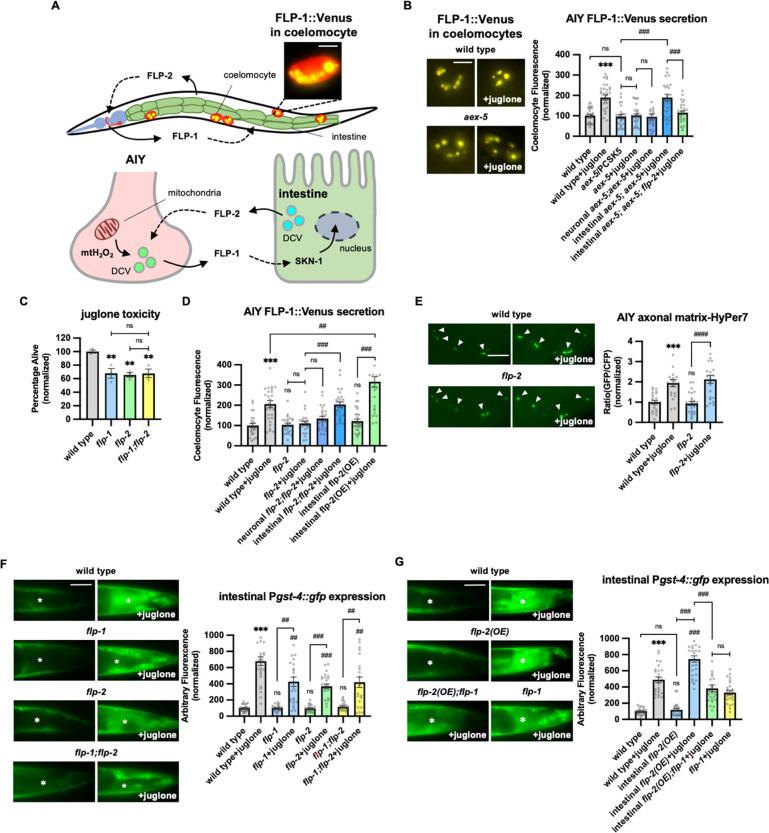
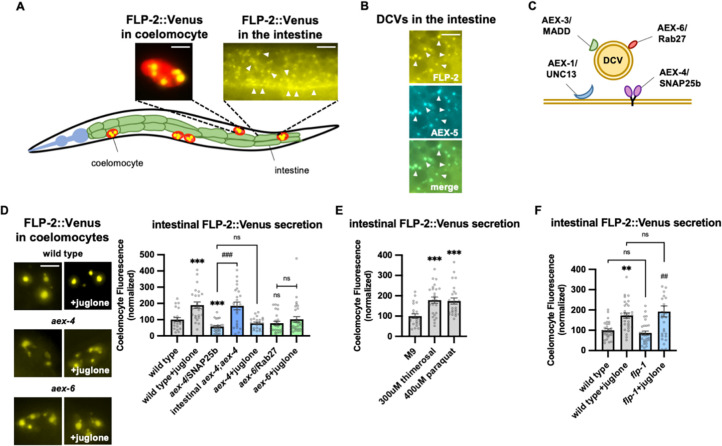
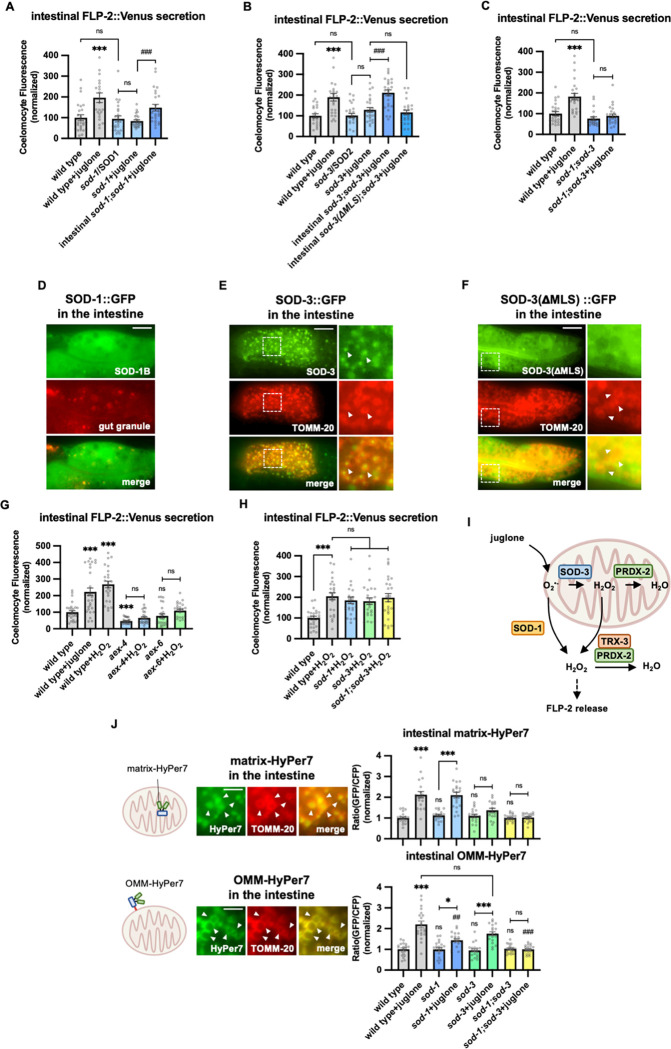
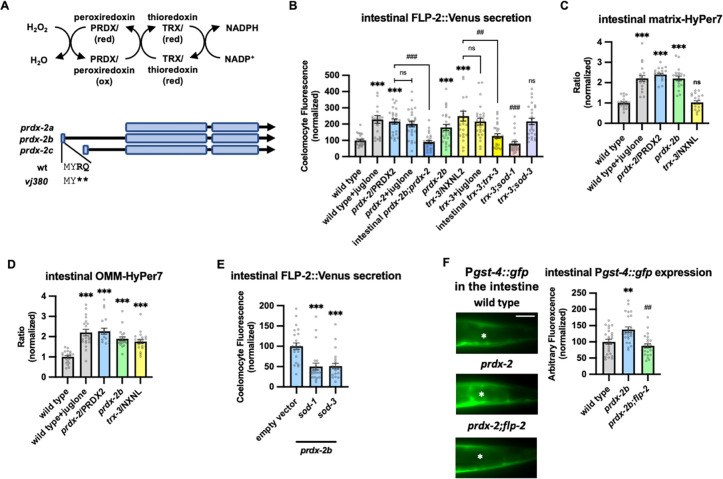
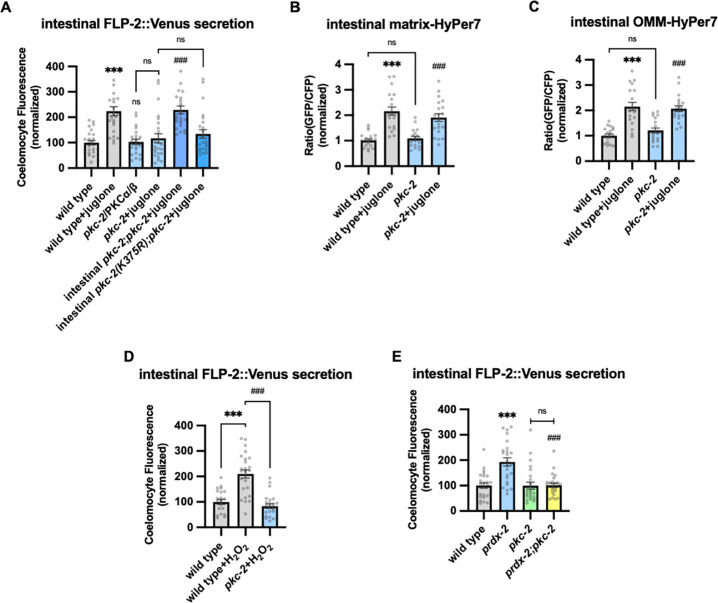
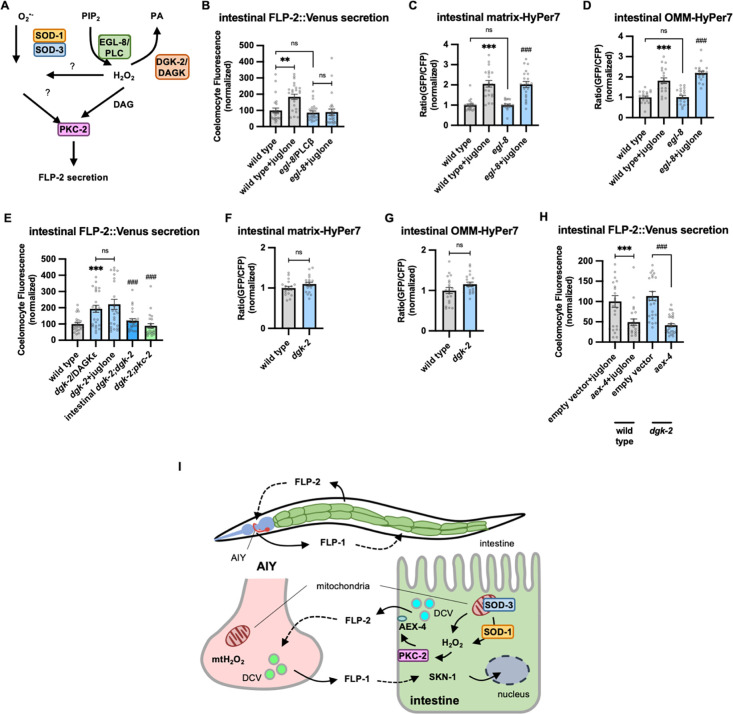
The gut-brain axis mediates bidirectional signaling between the intestine and the nervous system and is critical for organism-wide homeostasis. Here we report the identification of a peptidergic endocrine circuit in which bidirectional signaling between neurons and the intestine potentiates the activation of the antioxidant response in C. elegans in the intestine. We identify a FMRF-amide-like peptide, FLP-2, whose release from the intestine is necessary and sufficient to activate the intestinal oxidative stress response by promoting the release of the antioxidant FLP-1 neuropeptide from neurons. FLP-2 secretion from the intestine is positively regulated by endogenous hydrogen peroxide (H2O2) produced in the mitochondrial matrix by sod-3/superoxide dismutase, and is negatively regulated by prdx-2/peroxiredoxin, which depletes H2O2 in both the mitochondria and cytosol. H2O2 promotes FLP-2 secretion through the DAG and calciumdependent protein kinase C family member pkc-2 and by the SNAP25 family member aex-4 in the intestine. Together, our data demonstrate a role for intestinal H2O2 in promoting inter-tissue antioxidant signaling through regulated neuropeptide-like protein exocytosis in a gut-brain axis to activate the oxidative stress response.

Keywords: AEX-4; C. elegans; PKC-2; PRDX-2; SNAP25; SOD-1; SOD-3; TRX-3; hydrogen peroxide; mitochondria; neuropeptide; oxidative stress; peroxiredoxin; protein kinase C; superoxide dismutase; thioredoxin.


Figures

Figure 1.
Figure 1.. Peptidergic gut-to-neuron FLP-2 signaling potentiates the oxidative stress response.
A (Top) Schematic showing the positions of AIY, intestine and coelomocytes of transgenic animals coexpressing FLP-1::Venus in the intestine and mCherry in coelomocytes. Representative image of the posterior coelomocyte that has taken up Venus into the endocytic compartment. Scale bar: 5μM. (Bottom) Schematic showing FLP-1 and FLP-2 peptides as inter-tissue signals in gut-intestine regulation of the antioxidant response. B Representative images and quantification of average coelomocyte fluorescence of the indicated mutants expressing FLP-1::Venus fusion proteins in AIY following M9 or 300μM juglone treatment for 10min. Neuronal aex-5 denotes expression of aex-5 cDNA under the rab-3 promoter; intestinal aex-5 denotes expression of aex-5 cDNA under the ges-1 promoter. Unlined *** denotes statistical significance compared to “wild type”. n = 30, 30, 24, 30, 26, 30, 30 independent animals. Scale bar: 5μM. C Average percentage of surviving young adult animals of the indicated genotypes after 16h recovery following 4h juglone treatment. Unlined ** denotes statistical significance compared to “wild type”. n = 213, 156, 189, 195 independent biological samples over three independent experiments. D Quantification of average coelomocyte fluorescence of the indicated mutants expressing FLP-1::Venus fusion proteins in AIY following M9 or 300μM juglone treatment for 10min. Neuronal flp-2 denotes expression of flp-2 gDNA under the rab-3 promoter; intestinal flp-2 denotes expression of flp-2 gDNA under the ges-1 promoter; intestinal flp-2(OE) denotes expression of flp-2 gDNA under the ges-1 promoter in wild type animals. Unlined *** and ns denote statistical significance compared to “wild type”. n = 20, 20, 25, 20, 20, 20, 25, 22 independent animals. E Representative images and quantification of fluorescence of mitochondrial matrix-targeted HyPer7 in the axon of AIY following M9 or 300μM juglone treatment for 10min. Arrowheads denote puncta marked by mito::HyPer7 fusion proteins (Excitation: 500 and 400nm; emission: 520nm). Ratio of images taken with 500nM (GFP) and 400nM (CFP) for excitation was used to measure H2O2 levels. Unlined *** and ns denote statistical significance compared to “wild type”. n = 24, 22, 25, 24 independent animals. Scale bar: 10μM. F Representative images and quantification of average fluorescence in the posterior intestine of transgenic animals expressing Pgst-4::gfp after 1h M9 or juglone exposure and 3h recovery. Asterisks mark the intestinal region used for quantification. Pgst-4::gfp expression in the body wall muscles, which appears as fluorescence on the edge animals in some images, was not quantified. Unlined *** and ns denote statistical significance compared to “wild type”; unlined ## and ### denote statistical significance compared to “wild type+juglone”. n = 25, 26, 25, 25, 25, 25, 25, 25 independent animals. Scale bar: 10μM. G Representative images and quantification of average fluorescence in the posterior region of transgenic animals expressing Pgst-4::gfp after 1h M9 or juglone exposure and 3h recovery. Asterisks mark the intestinal region for quantification. Pgst-4::gfp expression in the body wall muscles, which appears as fluorescence on the edge animals in some images, was not quantified. Unlined *** denotes statistical significance compared to “wild type”; unlined ### denotes statistical significance compared to “wild type+juglone”. n = 23, 25, 25, 26, 24, 25 independent animals. Scale bar: 10μM. B-G Data are mean values ± s.e.m normalized to wild type controls. ns. not significant, ** and ## P < 0.01, *** and ### P < 0.001 by Brown-Forsythe and Welch ANOVA with Dunnett’s T3 multiple comparisons test.
Figure 2.
Figure 2.. FLP-2 secretion from the intestine is stress regulated.
A Schematic showing the positions of intestine and coelomocytes of transgenic animals co-expressing FLP2::Venus in the intestine and mCherry in coelomocytes. Representative images of the posterior coelomocyte that have taken up Venus into the endocytic compartment (Scale bar: 5μM) and the posterior intestinal region showing the distribution of FLP-2::Venus in puncta in the intestine are shown (Scale bar: 15μM). B Representative images of fluorescence distribution in the posterior intestinal region of transgenic animals co-expressing FLP-2::Venus and AEX-5::mTur2 fusion proteins. Arrowheads denote puncta marked by both fusion proteins. Scale bar: 5μM. C Schematic showing the locations of AEX-1/UNC13, AEX-3/MADD, AEX-4/SNAP25 and AEX-6/Rab27 relative to a DCV. D Representative images and quantification of average coelomocyte fluorescence of the indicated mutants expressing FLP-2::Venus fusion proteins in the intestine following M9 or 300μM juglone for 10min. Unlined *** and ns denote statistical significance compared to “wild type”. n = 29, 25, 24, 30, 23, 30, 25, 25, 25 independent animals. Scale bar: 5μM. E Quantification of average coelomocyte fluorescence of transgenic animals expressing FLP-2::Venus fusion proteins in the intestine following treatment with M9 buffer or the indicated stressors for 10min. Unlined *** denotes statistical significane compared to “M9”. n = 23, 25, 25 independent animals. F Quantification of average coelomocyte fluorescence of the indicated mutants expressing FLP-2::Venus fusion proteins in the intestine following M9 or 300μM juglone treatment for 10min. Unlined ** denotes statistical significance compared to “wild type”; unlined ## denotes statistical significance compared to “flp1”; a denotes statistical significance compared to “wild type+juglone”. n = 30, 30, 30, 30 independent animals. D-F Data are mean values ± s.e.m normalized to wild type controls. ns. not significant, ** and ## P < 0.01, *** and ### P < 0.001 by Brown-Forsythe and Welch ANOVA with Dunnett’s T3 multiple comparisons test.
Figure 3.
Figure 3.. SOD-1/SOD-3 mediates endogenous H2O2 regulates FLP-2 release from the intestine.
A Quantification of average coelomocyte fluorescence of the indicated mutants expressing FLP-2::Venus fusion proteins in the intestine following M9 or 300μM juglone treatment for 10min. Intestinal sod-1 denotes expression of sod-1b cDNA under the ges-1 promoter. Unlined *** denotes statistical significance compared to “wild type”. n = 25, 22, 24, 24, 25 independent animals. B Quantification of average coelomocyte fluorescence of the indicated mutants expressing FLP-2::Venus fusion proteins in the intestine following M9 or 300μM juglone treatment for 10min. Intestinal sod-3 and sod3(ΔMLS) denote intestinal expression of sod-3 cDNA and sod-3(ΔMLS) variants, which lacks the mitochondrial localization sequence, under the ges-1 promoter. Unlined *** denotes statistical significance compared to “wild type”. n = 25, 25, 25, 25, 25, 25 independent animals. C Quantification of average coelomocyte fluorescence of the indicated mutants expressing FLP-2::Venus fusion proteins in the intestine following M9 or 300μM juglone treatment for 10min. Unlined *** denotes statistical significance compared to “wild type”. n = 25, 25, 22, 25 independent animals. D Representative images of fluorescence distribution in the posterior intestinal region of transgenic animals expressing SOD-1b::GFP fusion proteins in contrast against auto-fluorescence of gut granules. Scale bar: 10μM. E Representative images of fluorescence distribution in the posterior intestinal region of transgenic animals co-expressing SOD-3::GFP and TOMM-20::mCherry (to target mitochondria) fusion proteins. Scale bar: 15μM. F Representative images of fluorescence distribution in the posterior intestinal region of transgenic animals co-expressing SOD-3(ΔMLS)::GFP and TOMM-20::mCherry fusion proteins. Scale bar: 15μM. G Quantification of average coelomocyte fluorescence of the indicated mutants expressing FLP-2::Venus fusion proteins in the intestine following M9, 300μM juglone or 1mM H2O2 treatment for 10min. Unlined *** and ns denote statistical significance compared to “wild type”. n = 29, 30, 25, 25, 25, 24, 25 independent animals. H Quantification of average coelomocyte fluorescence of the indicated mutants expressing FLP-2::Venus fusion proteins in the intestine following M9 or 1mM H2O2 treatment for 10min. n = independent animals. I Schematic showing that SOD-1 and SOD-3 mediate juglone-induced H2O2 production in promoting FLP2 release, and the PRDX-2/TRX-3 system detoxifies excessive H2O2. J Schematic, representative images and quantification of fluorescence in the posterior region of the indicated transgenic animals co-expressing mitochondrial matrix targeted HyPer7 (matrix-HyPer7) or mitochondrial outer membrane targeted HyPer7 (OMM-HyPer7) with TOMM-20::mCherry following M9 or 300μM juglone treatment. Ratio of images taken with 500nM (GFP) and 400nM (CFP) for excitation and 520nm for emission was used to measure H2O2 levels. Unlined *** and ns denote statistical significance compared to “wild type”. Unlined ## and ### denote statistical significance compared to “wild type+juglone”. (top) n = 20, 20, 18, 20, 19, 19, 20, 20 independent animals. (bottom) n = 20, 20, 19, 20, 20, 20, 20, 20 independent animals. Scale bar: 5μM. A-C, G-H and J Data are mean values ± s.e.m normalized to wild type controls. ns. not significant, * P < 0.05, ## P < 0.01, *** and ### P < 0.001 by Brown-Forsythe and Welch ANOVA with Dunnett’s T3 multiple comparisons test.
Figure 4.
Figure 4.. PRDX-2/PRDX and TRX-3/TRX regulate endogenous H2O2 and FLP-2 secretion.
A (Top) Schematic showing the PRDX/TRX system in H2O2 detoxification. (Bottom) Schematic showing the three isoforms of prdx-2 transcripts and vj380 allele of prdx-2b knockout. B Quantification of average coelomocyte fluorescence of the indicated mutants expressing FLP-2::Venus fusion proteins in the intestine following M9 or 300μM juglone treatment for 10min. Intestinal prdx-2b denotes expression of prdx-2b cDNA under the ges-1 promoter. Intestinal trx-3 denotes expression of trx-3 cDNA under the ges-1 promoter. Unlined *** denotes statistical significance compared to “wild type”; unlined ## and ### denote statistical significance compared to “trx-3”. n= 25, 23, 25, 25, 25, 25, 25, 25, 25, 25, 25 independent animals. C and D Quantification of fluorescence in the posterior region of the indicated transgenic animals coexpressing matrix-HyPer7 (C) or OMM-HyPer7 (D) with TOMM-20::mCherry following M9 or 300μM juglone treatment. Ratio of images taken with 500nM (GFP) and 400nM (CFP) for excitation and 520nm for emission was used to measure H2O2 levels. Unlined *** and ns denote statistical significance compared to “wild type. (C) n = 20, 20, 20, 20, 20 independent animals. (D) n = 20, 20, 20, 20, 20 independent animals. E Quantification of average coelomocyte FLP-2::Venus fluorescence of transgenic animals fed with RNAi bacteria targeting the indicated genes following M9 treatment for 10min. Unlined *** denotes statistical significance compared to “empty vector”. n = 25, 23, 24 independent animals. F Representative images and quantification of average fluorescence in the posterior region of transgenic animals expressing Pgst-4::gfp after 1h M9 or juglone exposure and 3h recovery. Asterisks mark the intestinal region for quantification. Pgst-4::gfp expression in the body wall muscles, which appears as fluorescence on the edge animals in some images, was not quantified. Unlined ** denotes statistical significance compared to “wild type”, unlined ## denotes statistical analysis compared to “prdx-2b”. n = 25, 25, 25 independent animals. Scale bar: 10μM. B-F Data are mean values ± s.e.m normalized to wild type controls. n.s. not significant, ** and ## P < 0.01, *** and ### P < 0.001 by Brown-Forsythe and Welch ANOVA with Dunnett’s T3 multiple comparisons test.
Figure 5.
Figure 5.. PKC-2/PKCα/β activation by H2O2 promotes FLP-2 secretion from the intestine.
A Quantification of average coelomocyte fluorescence of the indicated mutants expressing FLP-2::Venus fusion proteins in the intestine following M9 or 300μM juglone treatment for 10min. Intestinal pkc-2 denotes expression of pkc-2b cDNA under the ges-1 promoter. Intestinal pkc-2b(K375R) denotes expression of pkc2b(K375R) variants under the ges-1 promoter. Unlined *** and ns denote statistical significance compared to “wild type”; ### denote statistical significance compared to “pkc-2+juglone”. n = 24, 24, 25, 25, 25, 25 independent animals. B and C Quantification of fluorescence in the posterior region of the indicated transgenic animals coexpressing matrix-HyPer7 (B) or OMM-HyPer7 (C) with TOMM-20::mCherry following M9 or 300μM juglone treatment. Ratio of images taken with 500nM (GFP) and 400nM (CFP) for excitation and 520nm for emission was used to measure H2O2 levels. Unlined *** denotes statistical significance compared to “wild type”; unlined ### denotes statistical analysis compared to “pkc-2”. (B) n = 20, 20, 19, 20 independent animals, (C) n = 20, 20, 20, 20 independent animals. D Quantification of average coelomocyte fluorescence of the indicated mutants expressing FLP-2::Venus fusion proteins in the intestine following M9 or 1mM H2O2 treatment for 10min. n = 23, 25, 25 independent animals. E Quantification of average coelomocyte fluorescence of the indicated mutants expressing FLP-2::Venus fusion proteins in the intestine following M9 treatment for 10min. Unlined *** denotes statistical significance compared to “wild type”; unlined ### denotes statistical significance compared to “prdx-2”. n = 25, 25, 25, 25 independent animals. A-E Data are mean values ± s.e.m normalized to wild type controls. ns. not significant, *** and ### P < 0.001 by Brown-Forsythe and Welch ANOVA with Dunnett’s T3 multiple comparisons test.
Figure 6.
Figure 6.. DAG promotes PKC-2 mediated FLP-2 secretion from the intestine.
A Schematic showing PLC and DGK mediates DAG metabolism and DAG functions in H2O2-mediated FLP2 signaling. B Quantification of average coelomocyte fluorescence of the indicated mutants expressing FLP-2::Venus fusion proteins in the intestine following M9 or juglone treatment for 10min. n = 25, 25, 25, 25 independent animals. C and D Quantification of fluorescence in the posterior region of the indicated transgenic animals coexpressing matrix-HyPer7 (C) or OMM-HyPer7 (D) with TOMM-20::mCherry following M9 or 300μM juglone treatment. Ratio of images taken with 500nM (GFP) and 400nM (CFP) for excitation and 520nm for emission was used to measure H2O2 levels. Unlined *** denotes statistical significance compared to “wild type”; unlined ### denotes statistical significance compared to “egl-8”. (C) n = 22, 20, 20, 21 independent animals, (D) n = 20, 20, 20, 20 independent animals. E Quantification of average coelomocyte fluorescence of the indicated mutants expressing FLP-2::Venus fusion proteins in the intestine following M9 or 300μM juglone treatment for 10min. Intestinal dgk-2 denotes expression of dgk-2a cDNA under the ges-1 promoter. Unlined *** denotes statistical significance compared to “wild type”; unlined ### denotes statistical significance compared to “dgk-2/DGKε”. n = 25, 25, 25, 25, 24 independent animals. F and G Quantification of fluorescence in the posterior region of the indicated transgenic animals coexpressing matrix-HyPer7 (F) or OMM-HyPer7 (G) with TOMM-20::mCherry following M9 treatment. Ratio of images taken with 500nM (GFP) and 400nM (CFP) for excitation and 520nm for emission was used to measure H2O2 levels. (F) n = 20, 20 independent animals, (G) n = 20, 20 independent animals. H Quantification of average coelomocyte fluorescence of the indicated transgenic animals fed with RNAi bacteria targeting the indicated genes in the intestine following M9 treatment for 10min. n = 25, 24, 25, 30 independent animals. I (Top) Schematic showing the position of intestine and AIY neurons in FLP-1-FLP-2 mediated axis. (Bottom) Schematic showing endogenous H2O2 promotes PKC-2/AEX-4 mediated FLP-2 release from the intestine in FLP-1-FLP-2 regulated inter-tissue axis. B-H Data are mean values ± s.e.m normalized to wild type controls. B-E and H ns. not significant, ** P < 0.01, *** and ### P < 0.001 by Brown-Forsythe and Welch ANOVA with Dunnett’s T3 multiple comparisons test. F and G ns. not significant by unpaired t test with Welch’s correction.

Similar articles

References

    1. Giniatullin A R and Giniatullin R A. 2003. “Dual Action of Hydrogen Peroxide on Synaptic Transmission at the Frog Neuromuscular Junction.” The Journal of Physiology 552(1):283–93. doi: 10.1113/jphysiol.2003.050690. - DOI - PMC - PubMed
    1. Ahier Arnaud, Dai Chuan-Yang, Tweedie Andrea, Bezawork-Geleta Ayenachew, Kirmes Ina, and Zuryn Steven. 2018. “Affinity Purification of Cell-Specific Mitochondria from Whole Animals Resolves Patterns of Genetic Mosaicism.” Nature Cell Biology 20(3):352-. doi: 10.1038/s41556-017-0023-x. - DOI - PubMed
    1. Ahmad Taseer, and Suzuki Yuichiro J.. 2019. “Juglone in Oxidative Stress and Cell Signaling.” Antioxidants (Basel, Switzerland) 8(4):91. doi: 10.3390/antiox8040091. - DOI - PMC - PubMed
    1. Ailion Michael, Hannemann Mandy, Dalton Susan, Pappas Andrea, Watanabe Shigeki, Hegermann Jan, Liu Qiang, Han Hsiao-Fen, Gu Mingyu, Goulding Morgan Q., Sasidharan Nikhil, Schuske Kim, Hullett Patrick, Eimer Stefan, and Jorgensen Erik M.. 2014. “Two Rab2 Interactors Regulate Dense-Core Vesicle Maturation.” Neuron 82(1):167–80. doi: 10.1016/j.neuron.2014.02.017. - DOI - PMC - PubMed
    1. Arribere Joshua A., Bell Ryan T., Fu Becky XH, Artiles Karen L., Hartman Phil S., and Fire Andrew Z.. 2014. “Efficient Marker-Free Recovery of Custom Genetic Modifications with CRISPR/Cas9 in Caenorhabditis Elegans.” - PMC - PubMed

Publication types

LinkOut - more resources