[Preprint]. 2024 Sep 19:2024.09.13.612883.
doi: 10.1101/2024.09.13.612883.

Small DNA elements that act as both insulators and silencers in plants

Affiliations

Small DNA elements that act as both insulators and silencers in plants

Tobias Jores et al. bioRxiv. .

Update in

  • Small DNA elements can act as both insulators and silencers in plants.
    Jores T, Mueth NA, Tonnies J, Char SN, Liu B, Grillo-Alvarado V, Abbitt S, Anand A, Deschamps S, Diehn S, Gordon-Kamm B, Jiao S, Munkvold K, Snowgren H, Sardesai N, Fields S, Yang B, Cuperus JT, Queitsch C. Jores T, et al. Plant Cell. 2025 Jun 4;37(6):koaf084. doi: 10.1093/plcell/koaf084. Plant Cell. 2025. PMID: 40485594 Free PMC article.

Abstract

Insulators are cis-regulatory elements that separate transcriptional units, whereas silencers are elements that repress transcription regardless of their position. In plants, these elements remain largely uncharacterized. Here, we use the massively parallel reporter assay Plant STARR-seq with short fragments of eight large insulators to identify more than 100 fragments that block enhancer activity. The short fragments can be combined to generate more powerful insulators that abolish the capacity of the strong viral 35S enhancer to activate the 35S minimal promoter. Unexpectedly, when tested upstream of weak enhancers, these fragments act as silencers and repress transcription. Thus, these elements are capable of both insulating or repressing transcription dependent upon regulatory context. We validate our findings in stable transgenic Arabidopsis, maize, and rice plants. The short elements identified here should be useful building blocks for plant biotechnology efforts.


Conflict of interest statement

Competing interests T.J., J.T.C., and C.Q. have filed a patent application related to this work through the University of Washington. The remaining authors declare no competing interests.

Figures

Extended Data Fig. 1 |
Extended Data Fig. 1 |. Plant STARR-seq detects activity of enhancer-blocking insulators.
a, Full-length insulators were cloned in the forward (fwd) or reverse (rev) orientation between a 35S enhancer and a 35S minimal promoter driving the expression of a barcoded GFP reporter gene. b, All insulator constructs were pooled and subjected to Plant STARR-seq in tobacco leaves (tobacco) and maize protoplasts (maize). Reporter mRNA enrichment was normalized to a control construct without an enhancer or insulator (noEnh; log2 set to 0). Box plots represent the median (center line), upper and lower quartiles, and 1.5× interquartile range (whiskers) for all corresponding barcodes from two independent replicates. Numbers at the bottom of the plot indicate the number of samples in each group. The enrichment of a control construct without an insulator (noIns) is indicated as a dotted line.
Extended Data Fig. 2 |
Extended Data Fig. 2 |. Plant STARR-seq yields highly reproducible results.
ag, Correlation between biological replicates of Plant STARR-seq for the full-length insulator library used in Extended Data Fig. 1 (a), the insulator fragment library used in Fig. 1 (b), the insulator fragment combination library used in Fig. 3 (c), the downstream enhancer library (d) and the insulator/silencer library (e) used in Fig. 4, and the enhancer-insulator combination library used in Fig. 5 (f). Experiments were performed in tobacco leaves (tobacco) or maize protoplasts (maize) as indicated. Pearson’s R2, Spearman’s ρ, and number (n) of constructs are indicated. The color in the hexbin plots in c represents the count of points in each hexagon.
Extended Data Fig. 3 |
Extended Data Fig. 3 |. Activity of insulator fragments in different maize tissues.
a,b, Transgenic maize lines were created using constructs as in Fig. 2h. The activity of insulator fragments was measured in the indicated tissues (a) and compared to the corresponding results from Plant STARR-seq in maize protoplasts (b). Box plots in a are as defined in Fig. 2.
Extended Data Fig. 4 |
Extended Data Fig. 4 |. Activity of insulator fragment combinations in different maize tissues.
a,b, Transgenic maize lines were created using insulator fragment combinations in constructs as in Fig. 2h. The activity of insulator fragments was measured in the indicated tissues (a) and compared to the corresponding results from Plant STARR-seq in maize protoplasts (b). Box plots in a are as defined in Fig. 2.
Extended Data Fig. 5 |
Extended Data Fig. 5 |. Enhancers downstream of insulator fragments slightly reduce their activity.
Correlation between the activity of insulator fragments cloned between a 35S enhancer and a 35S minimal promoter with or without an additional AB80 or Cab-1 enhancer inserted between the insulator fragment and 35S minimal promoter. The dashed line represents a y = x line fitted through the point corresponding to a control construct without an insulator (black dot). Pearson’s R2, Spearman’s ρ, and number (n) of constructs are indicated.
Fig. 1 |
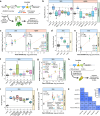
Fig. 1 |. Short fragments exhibit enhancer-blocking insulator activity.
a, Known insulators were split into partially overlapping 170-bp fragments. The insulator fragments were cloned in the forward or reverse orientation between a 35S, AB80, or Cab-1 enhancer and a 35S minimal promoter driving the expression of a barcoded GFP reporter gene. Constructs without an enhancer (none) but with insulator fragments were also created. b, All insulator fragment constructs were pooled and subjected to Plant STARR-seq in tobacco leaves (tobacco) and maize protoplasts (maize). Reporter mRNA enrichment was normalized to a control construct without an enhancer or insulator (noEnh; log2 set to 0). The enrichment of a control construct without an insulator is indicated as a black dot. Violin plots represent the kernel density distribution and the box plots inside represent the median (center line), upper and lower quartiles, and 1.5× interquartile range (whiskers) for all corresponding constructs. Numbers at the bottom of each violin indicate the number of samples in each group. c, Correlation between the enrichment of insulator fragments in constructs with the 35S enhancer in tobacco leaves and maize protoplasts. d, Enrichment of constructs with insulator fragments cloned between the 35S enhancer and minimal promoter. The position along the full-length insulator and the orientation (arrow pointing right, fwd; arrow pointing left, rev) of the fragments is indicated by arrows. e, Correlation between insulator fragment enrichment and GC content for constructs with the 35S enhancer. f, Correlation between insulator fragment enrichment in tobacco leaves in constructs with the indicated enhancers. The dashed line represents a y = x line fitted through the point corresponding to a control construct without an insulator (black dot). Pearson’s R2, Spearman’s ρ, and number (n) of constructs are indicated in c, e, and f.
Fig. 2 |
Fig. 2 |. Insulators are active in stable transgenic lines in Arabidopsis, rice, and maize.
a, Transgenic Arabidopsis and rice lines were generated with T-DNAs harboring a constitutively expressed luciferase (Luc) gene and a nanoluciferase (NanoLuc) gene under control of a 35S minimal promoter coupled to the 35S or AB80 enhancer (as indicated above the plots) with insulator candidates inserted between the enhancer and promoter. Nanoluciferase activity was measured in at least 4 plants from these lines and normalized to the activity of luciferase. The NanoLuc/Luc ratio was normalized to a control construct without an enhancer or insulator (noEnh; log2 set to 0). b,c, The activity of full-length insulators was measured in Arabidopsis lines (b) and compared to the corresponding results from Plant STARR-seq in tobacco leaves (c). d,e, The activity of synthetic full-length insulators was measured in rice lines (d) and compared to the corresponding results from Plant STARR-seq in maize protoplasts (e). f,g, The activity of insulator fragments was measured in Arabidopsis lines (f) and compared to the corresponding results from Plant STARR-seq in tobacco leaves (g). h, For transgenic maize lines, a reporter gene driven by a moderate-strength constitutive promoter (ZmPro) and an upstream 35S enhancer was created and insulator fragments were inserted between the enhancer and promoter. The reporter gene cassette was inserted in the maize genome by site-directed integration and the expression of the reporter gene was measured in various tissues/developmental stages by ELISA. i,j, The activity of insulator fragments was measured in R1 leaves of transgenic maize lines (i) and compared to the corresponding results from Plant STARR-seq in maize protoplasts (j). k, Correlation (Pearson’s R2) between the expression of all tested constructs across different tissues and developmental stages. The correlation with Plant STARR-seq results from maize protoplasts is also shown. Box plots in b, d, (f), and (i) represent the median (center line), upper and lower quartiles (box limits), 1.5× interquartile range (whiskers), and outliers (points) for all corresponding samples from two to three independent replicates. Numbers at the bottom of each box plot indicate the number of samples in each group. The enrichment of a control construct without an insulator (noIns) is indicated as a dotted line. In c, e, g, and j, the dashed line represents a linear regression line and error bars represent the 95% confidence interval. Pearson’s R2, Spearman’s ρ, and number (n) of constructs are indicated.
Fig. 3 |
Fig. 3 |. Insulator fragments can be stacked to create very strong enhancer-blocking insulators.
a, One, two, or three 170-bp fragments of known insulators were cloned between a 35S enhancer and a 35S minimal promoter driving the expression of a barcoded GFP reporter gene. b, All insulator constructs were pooled and subjected to Plant STARR-seq in tobacco leaves (tobacco) and maize protoplasts (maize). Reporter mRNA enrichment was normalized to a control construct without an enhancer or insulator (log2 set to 0). Violin plots are as defined in Fig. 1b. The enrichment of a control construct without an insulator is indicated as dotted line. c, A linear model was trained to predict the enrichment of stacked insulator constructs based on the activity of individual insulator fragments and their position within the construct. The correlation between the model’s prediction (prediction) and experimentally determined enrichment values (measurement) is shown as a hexbin plot (color represents the count of points in each hexagon; c). Pearson’s R2, Spearman’s ρ, and number (n) of fragments are indicated. d, Coefficients assigned by the linear model to insulator fragments in the indicated positions of the stacked constructs. e,f, The activity of insulator fragment combinations in constructs as in Fig. 2h was measured in R1 leaves of transgenic maize lines (e) and compared to the corresponding results from Plant STARR-seq in maize protoplasts (f). g, Correlation (Pearson’s R2) between the expression of all tested constructs across different tissues and developmental stages. The correlation with Plant STARR-seq results from maize protoplasts is also shown.
Fig. 4 |
Fig. 4 |. Insulators exhibit silencer activity in some contexts.
a, Insulator fragments were cloned upstream of a AB80 or Cab-1 enhancer and a 35S minimal promoter driving the expression of a barcoded GFP reporter gene. Half of the constructs also harbored a 35S enhancer upstream of the insulator fragments (with 35S) while the other half lacked an upstream enhancer (without 35S). b, All constructs were pooled and subjected to Plant STARR-seq in tobacco leaves. Reporter mRNA enrichment was normalized to a control construct without an enhancer or insulator (noEnh; log2 set to 0). The enrichment of a control construct without an insulator is indicated as a black dot. c, Correlation between insulator fragment activity in constructs with or without the upstream 35S enhancer. The dashed line represents a y = x line fitted through the point corresponding to a control construct without an insulator (black dot). d, Insulator fragments were cloned in between (insulator construct) or upstream of (silencer construct) a 35S enhancer and a 35S minimal promoter driving the expression of a barcoded GFP reporter gene. e, All constructs were pooled and subjected to Plant STARR-seq in tobacco leaves (tobacco) or maize protoplasts (maize). Reporter mRNA enrichment was normalized to a control construct without an enhancer or insulator (noEnh; log2 set to 0).The enrichment of a control construct without an insulator is indicated as a black dot. f, Comparison of the enrichment of insulator fragments in insulator or silencer constructs. A linear regression line is shown as a solid line and its slope and goodness-of-fit (R2) is indicated. Violin plots in b and e are as defined in Fig. 1b.
Fig. 5 |
Fig. 5 |. Silencer activity depends on enhancer strength.
a, Selected insulators and insulator fragments were cloned in between (insulator construct) or upstream of (silencer construct) an enhancer and a 35S minimal promoter driving the expression of a barcoded GFP reporter gene. Eight different enhancers were used to build these constructs. All constructs were pooled and subjected to Plant STARR-seq in tobacco leaves (tobacco) or maize protoplasts (maize). b, Strength of the eight enhancers in constructs without an insulator. Reporter mRNA enrichment was normalized to a control construct without an enhancer (none; log2 set to 0). Box plots represent the median (center line), upper and lower quartiles, and 1.5× interquartile range (whiskers) for all corresponding barcodes from two independent replicates. Numbers at the bottom of the plot indicate the number of samples in each group.c, Comparison of the enrichment of insulators and insulator fragments in insulator or silencer constructs. A linear regression line is shown as a solid line and its slope and goodness-of-fit (R2) is indicated. d, Correlation between the slope of the regression lines from c and the strength of the corresponding enhancer (see b). Pearson’s R2, Spearman’s ρ, and number (n) of constructs are indicated. A linear regression line is shown as a dashed line.
Fig. 6 |
Fig. 6 |. Enhancer-dependent silencer activity in stable transgenic plants.
a, Transgenic Arabidopsis lines were generated with T-DNAs harboring a constitutively expressed luciferase (Luc) gene and a nanoluciferase (NanoLuc) gene under control of a 35S minimal promoter coupled to the 35S or AB80 enhancer (as indicated above the plots) with insulator candidates inserted upstream of the enhancer. Nanoluciferase activity was measured in at least 4 plants from these lines and normalized to the activity of luciferase. The NanoLuc/Luc ratio was normalized to a control construct without an enhancer or insulator (noEnh; log2 set to 0). b,c, The activity of full-length insulators was measured in Arabidopsis lines (b) and compared to the corresponding results from Plant STARR-seq in tobacco leaves (c). Box plots in b are as defined in Fig. 2. In c, the dashed line represents a linear regression line and error bars represent the 95% confidence interval. Pearson’s R2, Spearman’s ρ, and number (n) of constructs are indicated. d, Comparison of the mean NanoLuc/Luc ratio of full-length insulators in insulator (Fig. 2b) or silencer constructs (b). A linear regression line is shown as a solid line and its slope and goodness-of-fit (R2) is indicated.

Similar articles

References

    1. Weising K., Kahl G. Towards an Understanding of Plant Gene Regulation: The Action of Nuclear Factors. Z. Für Naturforschung C 46, 1–11 (1991). - PubMed
    1. Ricci W.A. et al. Widespread long-range cis-regulatory elements in the maize genome. Nat. Plants 5, 1237–1249 (2019). - PMC - PubMed
    1. Jores T. et al. Identification of Plant Enhancers and Their Constituent Elements by STARR-seq in Tobacco Leaves. Plant Cell 32, 2120–2131 (2020). - PMC - PubMed
    1. Jores T. et al. Synthetic promoter designs enabled by a comprehensive analysis of plant core promoters. Nat. Plants 7, 842–855 (2021). - PMC - PubMed
    1. Cuperus J.T. Single-cell genomics in plants: current state, future directions, and hurdles to overcome. Plant Physiol. 188, 749–755 (2022). - PMC - PubMed

Publication types

LinkOut - more resources