

This is a preprint.
Integrative Modeling of Protein-Polypeptide Complexes by Bayesian Model Selection using AlphaFold and NMR Chemical Shift Perturbation Data
- PMID: 39345459
- PMCID: PMC11430059
- DOI: 10.1101/2024.09.19.613999
Integrative Modeling of Protein-Polypeptide Complexes by Bayesian Model Selection using AlphaFold and NMR Chemical Shift Perturbation Data
Abstract
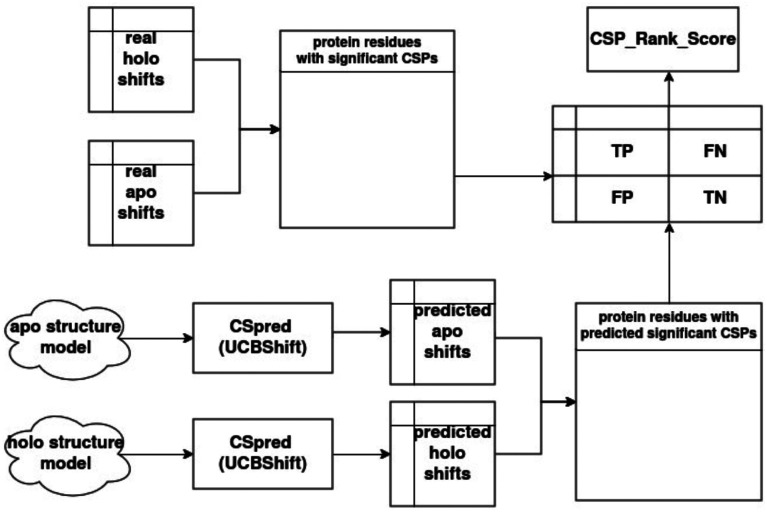
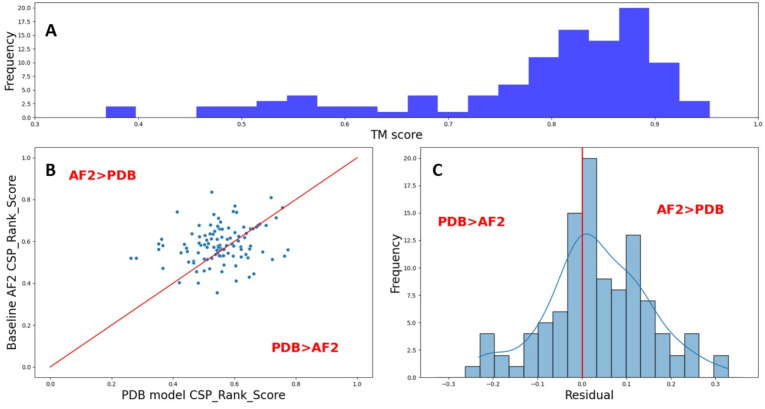
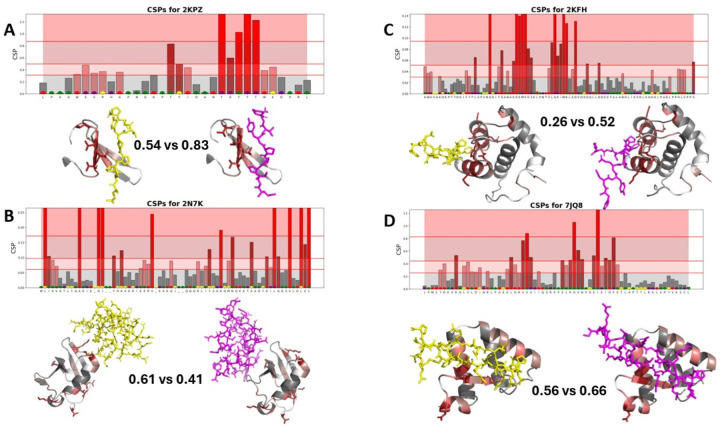
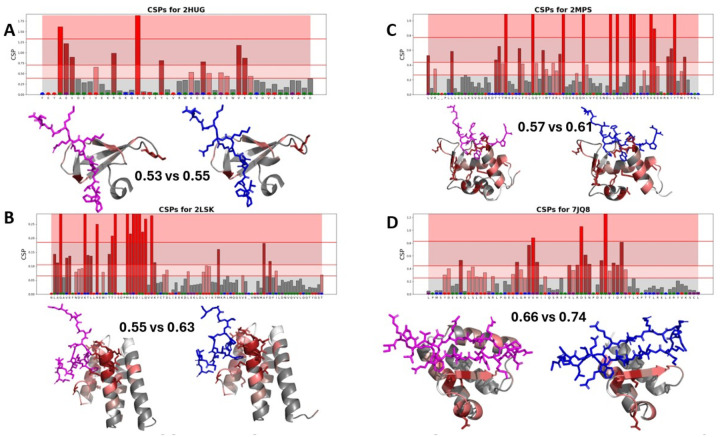
Protein-polypeptide interactions, including those involving intrinsically-disordered peptides and intrinsically-disordered regions of protein binding partners, are crucial for many biological functions. However, experimental structure determination of protein-peptide complexes can be challenging. Computational methods, while promising, generally require experimental data for validation and refinement. Here we present CSP_Rank, an integrated modeling approach to determine the structures of protein-peptide complexes. This method combines AlphaFold2 (AF2) enhanced sampling methods with a Bayesian conformational selection process based on experimental Nuclear Magnetic Resonance (NMR) Chemical Shift Perturbation (CSP) data and AF2 confidence metrics. Using a curated dataset of 108 protein-peptide complexes from the Biological Magnetic Resonance Data Bank (BMRB), we observe that while AF2 typically yields models with excellent consistency with experimental CSP data, applying enhanced sampling followed by data-guided conformational selection routinely results in ensembles of structures with improved agreement with NMR observables. For two systems, we cross-validate the CSP-selected models using independently acquired nuclear Overhauser effect (NOE) NMR data and demonstrate how CSP and NMR can be combined using our Bayesian framework for model selection. CSP_Rank is a novel method for integrative modeling of protein-peptide complexes and has broad implications for studies of protein-peptide interactions and aiding in understanding their biological functions.
Conflict of interest statement
Declaration of Interests. GTM is a founder of Nexomics Biosciences, Inc. This does not represent a conflict of interest in this study.
Figures
Similar articles
-
Comparison of Two Modern Survival Prediction Tools, SORG-MLA and METSSS, in Patients With Symptomatic Long-bone Metastases Who Underwent Local Treatment With Surgery Followed by Radiotherapy and With Radiotherapy Alone.Clin Orthop Relat Res. 2024 Dec 1;482(12):2193-2208. doi: 10.1097/CORR.0000000000003185. Epub 2024 Jul 23. Clin Orthop Relat Res. 2024. PMID: 39051924
-
Factors that influence parents' and informal caregivers' views and practices regarding routine childhood vaccination: a qualitative evidence synthesis.Cochrane Database Syst Rev. 2021 Oct 27;10(10):CD013265. doi: 10.1002/14651858.CD013265.pub2. Cochrane Database Syst Rev. 2021. PMID: 34706066 Free PMC article.
-
Signs and symptoms to determine if a patient presenting in primary care or hospital outpatient settings has COVID-19.Cochrane Database Syst Rev. 2022 May 20;5(5):CD013665. doi: 10.1002/14651858.CD013665.pub3. Cochrane Database Syst Rev. 2022. PMID: 35593186 Free PMC article.
-
Magnetic resonance perfusion for differentiating low-grade from high-grade gliomas at first presentation.Cochrane Database Syst Rev. 2018 Jan 22;1(1):CD011551. doi: 10.1002/14651858.CD011551.pub2. Cochrane Database Syst Rev. 2018. PMID: 29357120 Free PMC article.
-
Parents' and informal caregivers' views and experiences of communication about routine childhood vaccination: a synthesis of qualitative evidence.Cochrane Database Syst Rev. 2017 Feb 7;2(2):CD011787. doi: 10.1002/14651858.CD011787.pub2. Cochrane Database Syst Rev. 2017. PMID: 28169420 Free PMC article.
References
-
- Aiyer S., Swapna G.V., Ma L.C., Liu G., Hao J., Chalmers G., Jacobs B.C., Montelione G.T. and Roth M.J., 2021. A common binding motif in the ET domain of BRD3 forms polymorphic structural interfaces with host and viral proteins. Structure, 29(8), pp.886–898. 10.1016/j.str.2021.01.010 - DOI - PMC - PubMed
-
- Baek M., DiMaio F., Anishchenko I., Dauparas J., Ovchinnikov S., Lee G.R., Wang J., Cong Q., Kinch L.N., Schaeffer R.D. and Millán C., 2021. Accurate prediction of protein structures and interactions using a three-track neural network. Science, 373(6557), pp.871–876. 10.1126/science.abj8754 - DOI - PMC - PubMed
Publication types
Grants and funding
LinkOut - more resources
Full Text Sources