[Preprint]. 2024 Sep 16:2024.09.12.612587.
doi: 10.1101/2024.09.12.612587.

Spatial microenvironments tune immune response dynamics in the Drosophila larval fat body

Affiliations

Spatial microenvironments tune immune response dynamics in the Drosophila larval fat body

Brandon H Schlomann et al. bioRxiv. .

Abstract

Immune responses in tissues display intricate patterns of gene expression that vary across space and time. While such patterns have been increasingly linked to disease outcomes, the mechanisms that generate them and the logic behind them remain poorly understood. As a tractable model of spatial immune responses, we investigated heterogeneous expression of antimicrobial peptides in the larval fly fat body, an organ functionally analogous to the liver. To capture the dynamics of immune response across the full tissue at single-cell resolution, we established live light sheet fluorescence microscopy of whole larvae. We discovered that expression of antimicrobial peptides occurs in a reproducible spatial pattern, with enhanced expression in the anterior and posterior lobes of the fat body. This pattern correlates with microbial localization via blood flow but is not caused by it: loss of heartbeat suppresses microbial transport but leaves the expression pattern unchanged. This result suggests that regions of the tissue most likely to encounter microbes via blood flow are primed to produce antimicrobials. Spatial transcriptomics revealed that these immune microenvironments are defined by genes spanning multiple biological processes, including lipid-binding proteins that regulate host cell death by the immune system. In sum, the larval fly fat body exhibits spatial compartmentalization of immune activity that resembles the strategic positioning of immune cells in mammals, such as in the liver, gut, and lymph nodes. This finding suggests that tissues may share a conserved spatial organization that optimizes immune responses for antimicrobial efficacy while preventing excessive self-damage.


Figures
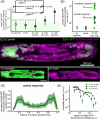
Figure 1:
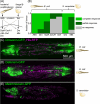
Figure 1:. The antimicrobial peptide reporter DptA-GFP is expressed heterogeneously throughout the fat body but exhibits a reproducible spatial pattern along the anterior-posterior axis during early third instar.
(A) The inducibility of DptA increases with larval age. Total fluorescence intensity of DptA-GFP per larva at 24 hours after infection with E. coli is plotted as a function of age after molt to L3. Inset shows the experimental timeline. Circles denote median values, bars denote quartiles. Age is denoted by hours after molt to L3 at a given temperature in degrees Celsius. Larvae aged 18 hours post L3 molt at 18°C at the time of infection produce intermediate DptA expression levels, and are the focal age of the paper. No injection and mock groups showed no detectable DptA-GFP signal and thus represent the measured range of background fluorescence. (B) From image-based quantification of single-cell DptA-GFP levels, we plot the median single-cell expression level for each larva and find that larvae cluster into two groups, denoted “partial responses” and “complete responses”. (C) Maximum intensity projections of larvae showing DptA-GFP (green) and fat body membranes (magenta, r4-Gal4 x UAS-mCD8-mCherry). A representative partial response (i) exhibits high expression in the anterior- and posterior-dorsal fat body, with minimal, scattered expression in the middle fat body. Complete responses (ii) exhibit a uniform expression pattern, while mock injected larvae (iii) show no detectable expression. Timing is 24 hours after injection. DptA-GFP channel is log-transformed and all images are adjusted to the same contrast levels. Scale bar in (ii) is 500 μm. (D) Quantification of the “U-shaped” DptA-GFP expression pattern for partial responses only. Each larva’s expression pattern is normalized to its maximum value and then averaged (green line). Shaded error bars denote standard deviation across N=12 larvae. (E) Probability densities of single-cell DptA-GFP expression levels for mock (gray), partial responses (dark green), and complete responses (bright green), showing that partial responses comprise a continuous, broad distribution of expression levels.
Figure 2:
Figure 2:. Spatial patterns of expression upon immune challenge occur in a variety of antimicrobial peptides.
(A) Highly simplified schematic of the main immune signaling pathways in Drosophila. Bacterial peptidoglycan is sensed through the immune deficient (IMD) pathway, which leads to activation of Diptericins (including DptA), Cecropins (including CecA1), Attacins (including AttA), Defensin (Def), and Drosocin (Dro). Fungal β-glucan is sensed through the Toll pathway and leads to activation of Drosomycin (Drs) and Metchnikowin (Mtk). There is cross-talk between the pathways (dashed gray arrows). (B) Fraction of larvae exhibiting partial (subset of fat body cells GFP+), complete (all fat body cells GFP+), or no response of GFP-reporters of various antimicrobial peptides following challenge with E. coli or S. cerevisiae. Responses were scored based on images taken on a low-magnification widefield microscope 24 hours post infection, except for DptA, which were taken from the light sheet fluorescence microscopy data from Fig. 1. All larvae were staged to 18h post-L3 molt at 18°C (Methods). Sample sizes (number of larvae) for each gene, left to right: N=7,14,20,11,12,8,11. (C)-(E) Maximum intensity projections of light sheet fluorescence microscopy image stacks of larvae carrying GFP reporters for Drosocin (C), Defensin (D), and Metchnikowin (E), with the microbial stimulus used noted to the right of each image. Fat body nuclei are marked using r4-Gal4 X UAS-HisRFP. Image contrast was adjusted for each panel separately for visual clarity.
Figure 3:
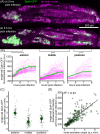
Figure 3:. Single-cell dynamics of DptA expression exhibit smooth activation with spatially-varying rates.
(A) Maximum intensity projection snapshots of DptA-GFP expression during time-lapse imaging. Time denotes hours post infection. The images come from Supplemental Movie 2. See also Supplemental Movie 3. (B) Single-cell traces of mean DptA-GFP expression per cell over time from cells in 3 regions of the dorsal fat body. One representative trace from each region is highlighted in green, the rest are drawn in magenta. The data are pooled from movies of N=2 larvae (Supplemental Movies 2 and 3). (C) Single-cell DptA-GFP activation rates in anterior, middle, and posterior regions of the fat body. Large circles and error bars denote quartiles. Small circles represent individual cells. (D) Instantaneous fluorescence intensity 6 hours post infection strongly correlates with the initial rate of production. Each marker is a cell.
Figure 4:
Figure 4:. Heartbeat-induced fluid flows pattern bacteria and dye but are not required for patterning of DptA.
Each row shows quantification (left, mean and standard deviation) and a representative image (right) of various quantities. (A)-(D) E. coli 3 hours post injection with and without a heartbeat (N=4 larvae per group). In the quantification, to avoid counting fluorescence internalized by host cells, planktonic bacteria freely suspended in the hemolymph were computationally identified and only these cells were counted (Methods). The heartbeat was eliminated by myosin knockdown in the heart using NP1029-Gal4 x UAS-Mhc-RNAi. (E)-(H) Rhodamine dye injected in the posterior and imaged 5 minutes after injection, with and without a heartbeat (N=5 larvae per group). (I)-(L) DptA-GFP 6 hours post injection in animals with and without a heartbeat (N=5 larvae per group). All scale bars are 500 μm. In (J) and (L), the approximate outline of the larva is marked as an orange line. Images in (B), (D) (J), and (L) are maximum intensity projections of 3D light sheet images stacks. Images in (F) and (H) are single-plane widefield images.
Figure 5:
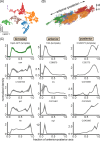
Figure 5:. Spatial transcriptomics reveals spatially patterned genes in the larval fat body, including the host-protective factor Turandot-A.
(A) UMAP of fat body cells from the early L3 dataset from [30] colored by Leiden clusters. (B) 3D rendering of fat body cells colored by Leiden clusters. Transcriptome clusters correspond to distinct anatomical regions within the fat body. The anterior-posterior and dorsal-ventral (”d-v”) axes are noted. (C) Top genes exhibiting spatial patterning in a bimodal (left), anterior-biased (middle), or posterior-biased fashion. Expression patterns (linear in transcript counts) are normalized so they integrate to one. The top row of genes were used as templates to extract other genes with similar expression patterns via the Wasserstein-1 distance (Methods). For bimodal genes, the mean DptA-GFP fluorescence intensity pattern was used as a template.

Similar articles

References

    1. Kastenmüller W., Torabi-Parizi P., Subramanian N., Lämmermann T. & Germain R. N. A Spatially-Organized Multicellular Innate Immune Response in Lymph Nodes Limits Systemic Pathogen Spread. Cell 150. Publisher: Elsevier, 1235–1248. issn: 0092–8674. 10.1016/j.cell.2012.07.021 (2024) (Sept. 2012). - DOI - PMC - PubMed
    1. Williams C. G. et al. Plasmodium infection induces phenotypic, clonal, and spatial diversity among differentiating CD4+ T cells. Cell Reports 43. Publisher: Elsevier. issn: 2211–1247. 10.1016/j.celrep.2024.114317 (2024) (June 2024). - DOI - PubMed
    1. Williams C. G. et al. Spatial transcriptomics maps molecular and cellular requirements for CD4+ T cell-dependent immunity to malaria. bioRxiv. Publisher: Cold Spring Harbor Laboratory _eprint: https://www.biorxiv.org/content/early/2023/02/23/2023.02.23.529309.full.pdf https://www.biorxiv.org/content/early/2023/02/23/2023.02.23.529309 (2023).
    1. Centofanti E. et al. The spread of interferon-γ in melanomas is highly spatially confined, driving nongenetic variability in tumor cells. Proceedings of the National Academy of Sciences 120. Publisher: Proceedings of the National Academy of Sciences, e2304190120. 10.1073/pnas.2304190120 (2024) (Aug. 2023). - DOI - PMC - PubMed
    1. Desai N. et al. Temporal and spatial heterogeneity of host response to SARS-CoV-2 pulmonary infection. Nature Communications 11, 6319. issn: 2041–1723. 10.1038/s41467-020-20139-7 (Dec. 2020). - DOI - PMC - PubMed

Publication types