[Preprint]. 2024 Sep 19:2024.09.18.613767.
doi: 10.1101/2024.09.18.613767.

Ventrolateral prefrontal cortex in macaques guides decisions in different learning contexts

Affiliations

Ventrolateral prefrontal cortex in macaques guides decisions in different learning contexts

Atsushi Fujimoto et al. bioRxiv. .

Abstract

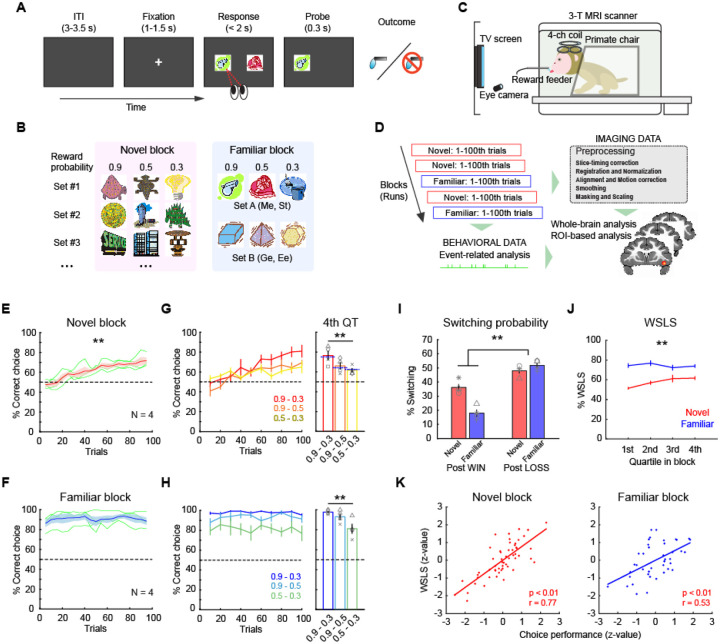
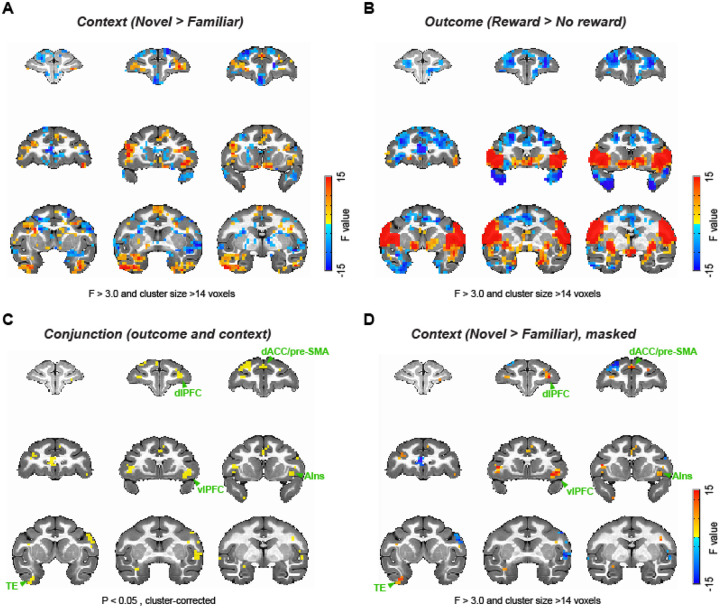
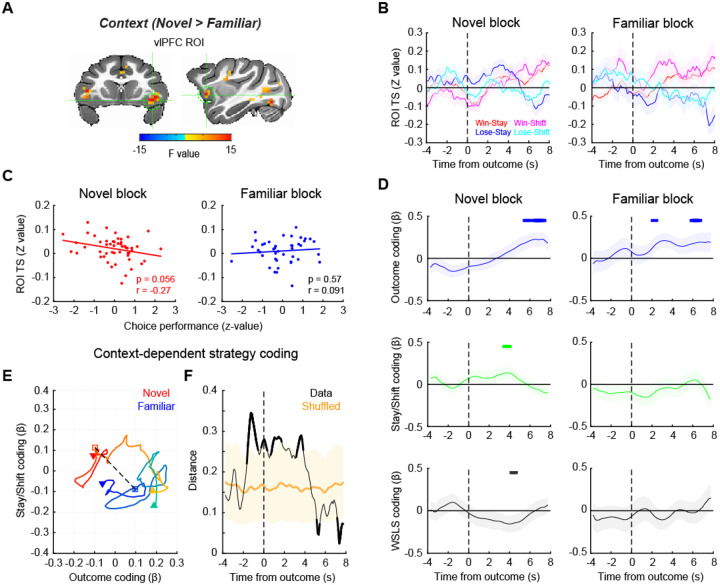
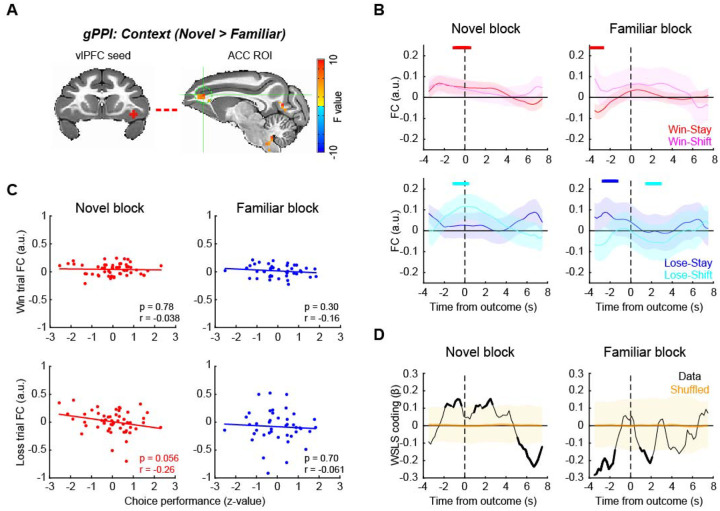
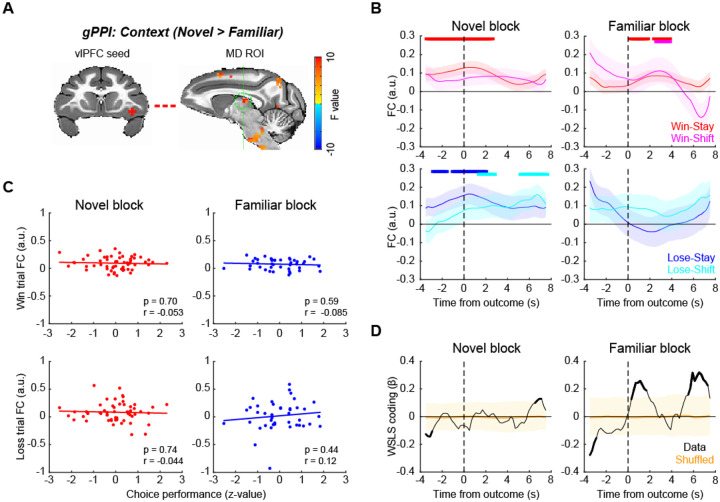
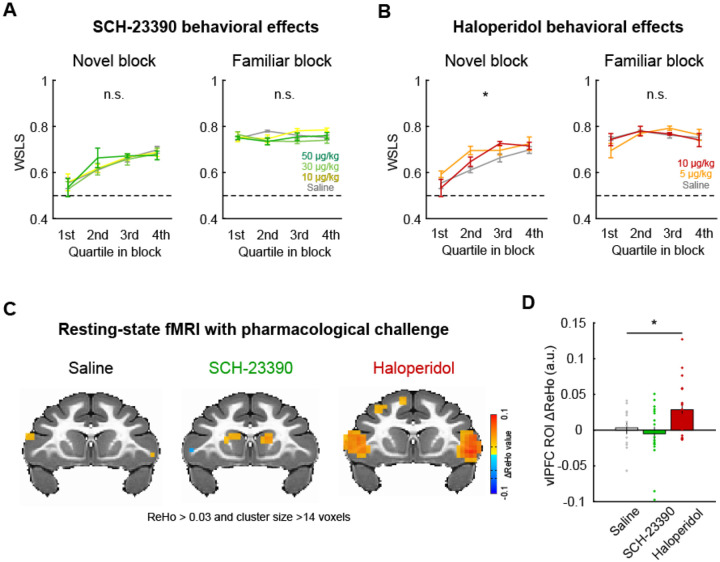
Flexibly adjusting our behavioral strategies based on the environmental context is critical to maximize rewards. Ventrolateral prefrontal cortex (vlPFC) has been implicated in both learning and decision-making for probabilistic rewards, although how context influences these processes remains unclear. We collected functional neuroimaging data while rhesus macaques performed a probabilistic learning task in two contexts: one with novel and another with familiar visual stimuli. We found that activity in vlPFC encoded rewards irrespective of the context but encoded behavioral strategies that depend on reward outcome (win-stay/lose-shift) preferentially in novel contexts. Functional connectivity between vlPFC and anterior cingulate cortex varied with behavioral strategy in novel learning blocks. By contrast, connectivity between vlPFC and mediodorsal thalamus was highest when subjects repeated a prior choice. Furthermore, pharmacological D2-receptor blockade altered behavioral strategies during learning and resting-state vlPFC activity. Taken together, our results suggest that multiple vlPFC-linked circuits contribute to adaptive decision-making in different contexts.


Conflict of interest statement

Conflict of interest: The authors declare no competing financial interest.

Figures

Figure 1.
Figure 1.. Probabilistic learning task and behaviors.
(A) Trial sequence in a probabilistic learning task. On each trial, animals make a choice between two visual stimuli by eye movement to earn juice reward. (B) Stimulus sets in novel and familiar blocks. Each stimulus is associated with a reward probability of 0.9, 0.5, or 0.3. Different set of stimuli (Set A or B) are used by subject in familiar blocks. (C) Awake-fMRI setup. Subjects are placed in the sphynx position in the 3T MRI scanner in front of a display screen with an eye-tracking system, allowing them to perform tasks during functional scans. (D) Analysis pipeline. Neural and behavioral data are collected simultaneously and separately preprocessed offline for subsequent event-related analyses. (E, F) Choice performance in novel blocks (E) and familiar blocks (F). Average and SEM of choice performance (proportion of high-value option choice) of all monkeys (N = 4) are plotted. Asterisk indicates significant interaction of trial bin by block type (**p < 0.01, 2-way repeated-measures ANOVA). Dotted line indicates chance level. Green lines are individual performance. (G, H) Performance for each stimulus pair in novel blocks (G) and familiar blocks (H). Plots indicate performance in binned trials (left) where colors represent stimulus pair. Bar graph (right) indicates average performance for each stimulus pair in 4th quartile. Asterisks indicate significant main effect of stimulus pair (**p < 0.01, 2-way repeated-measures ANOVA). Blue dotted line on the bar graph indicates the relative probability of a higher value option in each pair. Symbols represent individual animals. (I) Proportion of switching choices. Bars indicate average and SEM of switching probability for post-win trials and post-loss trials in novel and familiar blocks, respectively. Symbols represent each animal. Asterisk indicates significant interaction of block type by reward outcome (**p < 0.01, 2-way repeated-measures ANOVA). (J) Proportion of win-stay/lose-shift choices for novel (red) and familiar (blue) blocks in each quartile block (average and SEM). Asterisks indicate significant interaction of trial bin by block type (**p < 0.01, 2-way repeated-measures ANOVA). (K) Correlation between the proportion of WSLS and choice performance in novel (left) and familiar (right) blocks. Each dot represents individual blocks and lines indicate linear fitting of the data.
Figure 2.
Figure 2.. Whole-brain representations of learning context and outcome.
(A) Whole-brain representations of learning context. Coronal slices (2.5 mm apart) are shown from anterior (top left) to posterior (bottom right) planes. Thresholded F-stat maps (p < 0.05, cluster-corrected) are superimposed on a standard anatomical template. Positive and negative F-stats (warmer and cooler colors) indicate more activity in novel blocks and in familiar blocks, respectively. (B) Whole-brain representations of reward outcome. Larger F-stats indicate more activity in rewarded than no reward trials. Data are displayed in the same manner as (A). (C) Conjunction analysis result. Clusters highlighted (yellow) significantly encoded both learning context (novel vs. familiar) and reward outcome (rewarded vs. no reward) at cluster-level correction (p < 0.05). (D) F-stats map of context coding (novel vs. familiar; A) masked for the clusters identified in the conjunction analysis (C). dlPFC: dorsolateral prefrontal cortex, dACC: dorsal anterior cingulate cortex, pre-SMA: pre-supplementary motor area, vlPFC: ventrolateral prefrontal cortex, AIns: anterior insula, TE: inferior temporal cortex.
Figure 3.
Figure 3.. vlPFC signal encodes behavioral strategy during learning.
(A) vlPFC ROI for time-series analysis. The map of F-stats of context coding (novel vs. familiar) are shown on coronal (left) and sagittal (right) planes of a standard anatomical template. A spherical ROI is defined based on the peak coordinates of context coding in the right vlPFC cluster. (B) ROI time-series around the outcome timing during novel (left) and familiar (right) blocks. Average and SEM of ROI time-series are plotted for win-stay, win-shift, lose-stay, lose-shift trials, respectively. (C) Correlation between vlPFC activity and choice performance in novel (left) and familiar (right) blocks. Each dot indicates a block and the line indicates a linear fitting of the scatter plot. (D) Regression analysis result. Beta coefficients for outcome coding (top), stay/shift decision coding (middle), and the interaction of outcome by stay/shift decision (i.e., WSLS behavioral strategy) coding (bottom) were computed using a sliding window analysis. The time-course of the beta coefficients were plotted around the timing of outcome (vertical dotted line) for each of novel (left) and familiar (right) blocks. Thick lines on the top of each panel indicate significant encoding compared to zero (p < 0.05 at 3 consecutive bins, rank-sum test). (E, F) Multidimensional analysis result. (E) Beta coefficients for outcome and stay/shift decision coding are plotted at each time point of novel (warmer colors) and familiar (cooler colors) blocks, with the passage of time represented as a gradient of colors. The dotted line and squares indicate the timing of outcome, and downward arrow and upward arrow indicate the start and end of the analysis window (from −4 to 8 seconds after the outcome), respectively. (F) The Euclidian distance between novel and familiar blocks was computed at each time point and plotted against the time. The shaded area indicates the 95% confidence interval of the shuffled data. The data that exceeded the 95% CI are represented by thick lines.
Figure 4.
Figure 4.. vlPFC-ACC functional connection encodes behavioral strategy during learning.
(A) vlPFC seed and ACC ROI for functional connectivity analysis. ACC ROI (sagittal plane on the right) was defined based on generalized PPI analysis using right vlPFC seed. (B) FC time course around the outcome timing. vlPFC-ACC FC during novel (left) and familiar (right) blocks were computed using sliding window analysis and visualized for win-stay and win-shift trials (top) and lose-stay and lose-shift trials (bottom) separately. The plots are made around the outcome timing (vertical dotted lines). The thick lines on the top of each panel indicate significant FC compared to zero for color matched trials (p < 0.05 with rank-sum test at 3 consecutive bins). (C) Correlation between vlPFC-ACC FC and choice performance. The correlations were computed for win (rewarded) trials (top) and loss (unrewarded) trials (bottom), and for novel (left) and familiar (right) blocks separately. Each dot represents each block, and the lines are linear fitted to the data. (D) Time course of WSLS coding around the outcome. WSLS coding was computed as the interaction of outcome by stay/shift decision coding in a sliding window multiple-regression analysis. Shaded areas (yellow) indicate 95% confidence interval of the data, and the thick black lines indicate the significance of the data.
Figure 5.
Figure 5.. vlPFC-MD functional connection encodes decision to stay during learning.
(A) vlPFC seed and MD thalamus ROI for functional connectivity analysis. (B) FC time course around the outcome timing. vlPFC-MD FC during novel (left) and familiar (right) blocks were computed for win-stay, win-shift, lose-stay, and lose-shift trials separately. The thick lines on the top of each panel indicate significant FC compared to zero for color matched trials (p < 0.05 with rank-sum test at 3 consecutive bins). (C) Correlation between vlPFC-MD FC and choice performance, for win trials (top) and loss trials (bottom) separately. Dots and lines indicate blocks and linear fitted line, respectively. (D) Time course of WSLS coding around the outcome. Shaded areas (yellow) indicate 95% confidence interval of the data, and the thick black line indicate the significance of the data.
Figure 6.
Figure 6.. D2 receptor blocker enhanced vlPFC activity and promoted adaptive behavior.
(A) The effect of D1 receptor antagonism on WSLS behavior. The proportion of WSLS trials in quartile blocks (average and SEM) are plotted for each dose of SCH-23390 (0, 10, 30, 50 ug/kg) for novel (left) and familiar (right) blocks, respectively. (B) The effect of D2 receptor antagonism (haloperidol: 0, 5, 10 ug/kg) on WSLS behavior. Plotted in same manner as (A). Asterisk indicates main effect of drug dose (*p < 0.05, 2-way ANOVA). (C) Regional homogeneity (ReHo) analysis of resting-state fMRI with pharmacological dopamine receptor manipulation. The clusters with significant ReHo values (p < 0.05, cluster-corrected) are superimposed on a coronal image from a standard anatomical template. (D) The effect of dopamine receptor antagonists on ReHo value. Bar graph indicates average and SEM of ReHo value of the voxels in the vlPFC ROI for each drug condition with individual data points superimposed (*p < 0.05, 1-way ANOVA).

Similar articles

References

    1. Stephens D.W. & Krebs J.R. Foraging theory (Princeton university press, 1986).
    1. Hodgins D.C., Stea J.N. & Grant J.E. Gambling disorders. Lancet (London, England) 378, 1874–1884 (2011). - PubMed
    1. APA. Diagnostic and Statistical Manual of Mental Disorders (DSM-5®) (American Psychiatric Association Publishing, Arlington, VA, 2013).
    1. Goudriaan A.E., Oosterlaan J., de Beurs E. & van den Brink W. Neurocognitive functions in pathological gambling: a comparison with alcohol dependence, Tourette syndrome and normal controls. Addiction (Abingdon, England) 101, 534–547 (2006). - PubMed
    1. Huq S.F., Garety P.A. & Hemsley D.R. Probabilistic judgements in deluded and non-deluded subjects. The Quarterly journal of experimental psychology. A, Human experimental psychology 40, 801–812 (1988). - PubMed

Publication types

LinkOut - more resources