[Preprint]. 2024 Sep 17:2024.09.17.613545.
doi: 10.1101/2024.09.17.613545.

Unique Transcriptomic Cell Types of the Granular Retrosplenial Cortex are Preserved Across Mice and Rats Despite Dramatic Changes in Key Marker Genes

Affiliations

Unique Transcriptomic Cell Types of the Granular Retrosplenial Cortex are Preserved Across Mice and Rats Despite Dramatic Changes in Key Marker Genes

Isla A W Brooks et al. bioRxiv. .

Abstract

The granular retrosplenial cortex (RSG) supports key functions ranging from memory consolidation to spatial navigation. The mouse RSG contains several cell types that are remarkably distinct from those found in other cortical regions. This includes the physiologically and transcriptomically unique low rheobase neuron that is the dominant cell-type in RSG layers 2/3 (L2/3 LR), as well as the similarly exclusive pyramidal cells that comprise much of RSG layer 5a (L5a RSG). While the functions of the RSG are extensively studied in both mice and rats, it remains unknown if the transcriptomically unique cell types of the mouse RSG are evolutionarily conserved in rats. Here, we show that mouse and rat RSG not only contain the same cell types, but key subtypes including the L2/3 LR and L5a RSG neurons are amplified in their representations in rats compared to mice. This preservation of cell types in male and female rats happens despite dramatic changes in key cell-type-specific marker genes, with the Scnn1a expression that selectively tags mouse L5a RSG neurons completely absent in rats. Important for Cre-driver line development, we identify alternative, cross-species genes that can be used to selectively target the cell types of the RSG in both mice and rats. Our results show that the unique cell types of the RSG are evolutionarily conserved across millions of years of evolution between mice and rats, but also emphasize stark species-specific differences in marker genes that need to be considered when making cell-type-specific transgenic lines of mice versus rats.


Figures

Figure 1.
Figure 1.. MERFISH distributions of excitatory cell types within RSG.
(A) Selected coronal slices from the Allen Brain Cell Atlas MERFISH dataset showing the distributions of all 10 identified excitatory (glutamatergic) cell types in mice. (B) Zoomed in views of retrosplenial cortex, showing the same slices and cell types as (A). (C to E) The same as (B), but with only L2/3 (C), L5 (D), or L6 I clusters shown for clarity. Note that expression of 4 of the 10 excitatory subtypes is nearly entirely restricted to only the RSG (L2/3 LR, L5a RSG, NP RSG, CT RSG).
Figure 2.
Figure 2.. Clustering and alignment of mouse and rat RSG excitatory neurons.
(A) Schematic showing the independent dissection and processing of mouse and rat snRNA-seq samples. (B) UMAP projection of mouse cells, colored by excitatory (glutamatergic) cluster identity. Inhibitory clusters are greyed out. (C) Mutual nearest neighbor correspondence matrix of mouse and rat excitatory clusters. For a given mouse cluster M and rat cluster R, the value shown is the proportion of R’s mutual nearest neighbors in the mouse dataset which are from M. (D) UMAP projection of rat cells, colored by cluster identity. Inhibitory clusters are greyed out.
Figure 3.
Figure 3.. Overview of RSG inhibitory clusters.
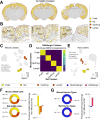
(A) Selected coronal slices from the Allen Brain Cell Atlas MERFISH dataset showing the distributions of 4 major inhibitory (GABAergic) subtypes in mice. (B) Zoomed in views of retrosplenial cortex, showing the same slices and cell types as (A). (C) UMAP projection of mouse cells, colored by cluster identity. Glutamatergic clusters are greyed out. (D) Mutual nearest neighbor correspondence matrix of mouse and rat inhibitory clusters. (E) UMAP projection of rat cells, colored by cluster identity. Glutamatergic clusters are greyed out. (F)Proportions of classes of inhibitory neurons in both mice and rats (pie charts), and fractional change in cell type proportions in rats as compared to mice (bar charts). Significance of proportion changes of each cell type within each layer were assessed using a Chi-square test, and effect sizes were computed as nondirectional Cohen’s h. p values and effect sizes are as follows: Pvalb, p = 0.0045, h = 0.16; Sst, p = 0.049, h = 0.11; Vip/Sncg, p = 0.16, h = 0.08; Lamp5, p = 0.93; h = 0.0079. (G) Proportions of total inhibitory and excitatory populations in both mice and rats (pie charts), and fractional changes in total inhibitory and excitatory population proportions in rats as compared to mice. Significance was assessed the same way as in (F): p = 0.0015, h = 0.061.
Figure 4.
Figure 4.. Marker genes for specific RSG cell types are not consistently conserved across species.
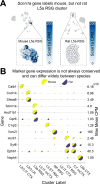
(A) UMAP projections of mouse (left) and rat (right) cells, with the L5a RSG cluster highlighted. L5a RSG cells are color-coded according to expression of Scnn1a, a known marker gene for this cluster in mice. Note the complete absence of this mouse marker gene in rat L5a RSG cells. (B)Half-circle plots of selected marker gene expression in excitatory clusters. Semicircle sizes are normalized by the maximum value in each row (corresponding to the maximum value for a given gene). The far-right column of the panel denotes the value represented by the largest semicircle in each row.
Figure 5.
Figure 5.. Expression of neurotransmitter receptors remains largely conserved across mouse and rat RSG excitatory clusters, with key differences.
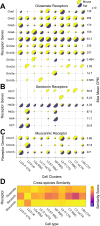
(A to C) Half-circle plots of selected neurotransmitter receptor categories in excitatory clusters. Within each row, the radius of each semicircle is proportional to mean CPM of that row’s gene. The far-right column of each plot contains the value represented by the largest semicircle in each row. (D) Cross-species similarity scores (see methods) for each cluster across all neurotransmitter receptor categories.
Figure 6.
Figure 6.. Expression of sodium and potassium ion channels across mouse and rat RSG clusters.
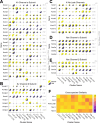
(A to E) Half-circle plots of selected ion channel categories in excitatory clusters. Within each row, the radius of each semicircle is proportional to mean CPM of that row’s gene. The far right column of each plot contains the value represented by the largest semicircle in each row. (F) Cross-species similarity scores (see methods) for each cluster across all ion channel categories.

Similar articles

References

    1. Abbott G. W. (2012). KCNE2 and the K+ channel. Channels, 6(1), 1–10. 10.4161/chan.19126 - DOI - PMC - PubMed
    1. Adkins R. M., Gelke E. L., Rowe D., & Honeycutt R. L. (2001). Molecular Phylogeny and Divergence Time Estimates for Major Rodent Groups: Evidence from Multiple Genes. Molecular Biology and Evolution, 18(5), 777–791. 10.1093/oxfordjournals.molbev.a003860 - DOI - PubMed
    1. Aggleton J. P., Yanakieva S., Sengpiel F., & Nelson A. J. (2021). The separate and combined properties of the granular (area 29) and dysgranular (area 30) retrosplenial cortex. Neurobiology of Learning and Memory, 185, 107516. 10.1016/j.nlm.2021.107516 - DOI - PubMed
    1. Ahmed O. J., & Cash S. S. (2013). Finding synchrony in the desynchronized EEG: the history and interpretation of gamma rhythms. Frontiers in Integrative Neuroscience, 7. 10.3389/fnint.2013.00058 - DOI - PMC - PubMed
    1. Ahmed O. J., & Mehta M. R. (2009). The hippocampal rate code: anatomy, physiology and theory. Trends in Neurosciences, 32(6), 329–338. 10.1016/j.tins.2009.01.009 - DOI - PMC - PubMed

Publication types

LinkOut - more resources