[Preprint]. 2024 Sep 18:2024.09.17.613543.
doi: 10.1101/2024.09.17.613543.

Cholesterol binding to VCAM-1 promotes vascular inflammation

Affiliations

Cholesterol binding to VCAM-1 promotes vascular inflammation

John P Kennelly et al. bioRxiv. .

Abstract

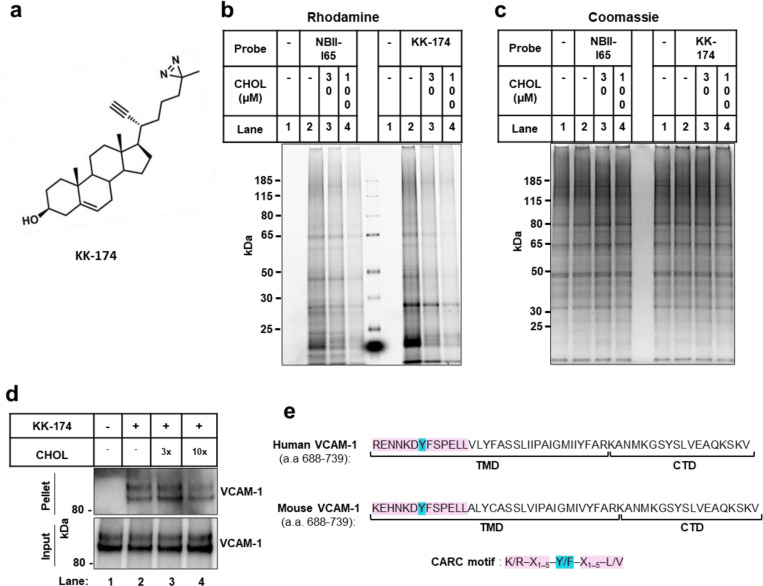
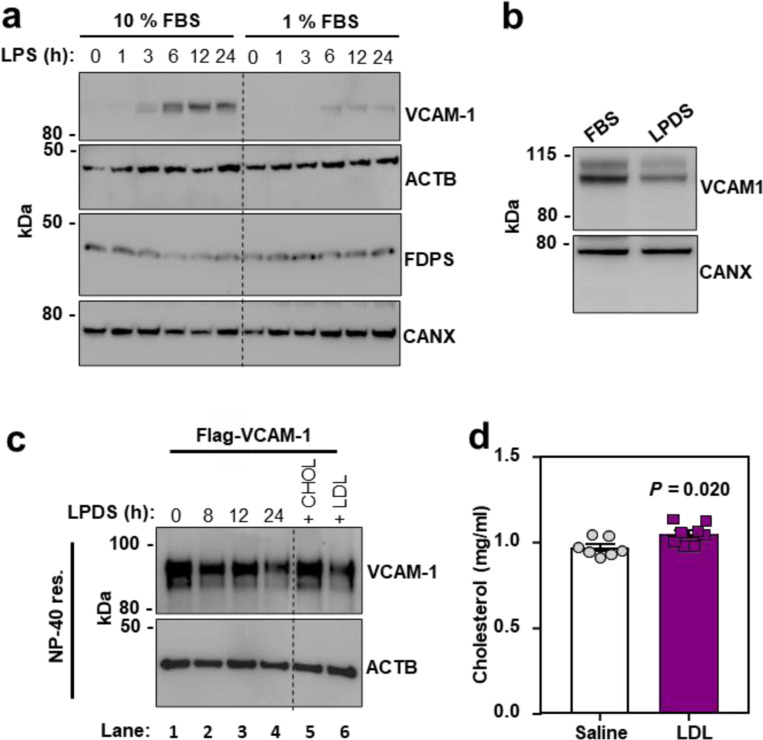
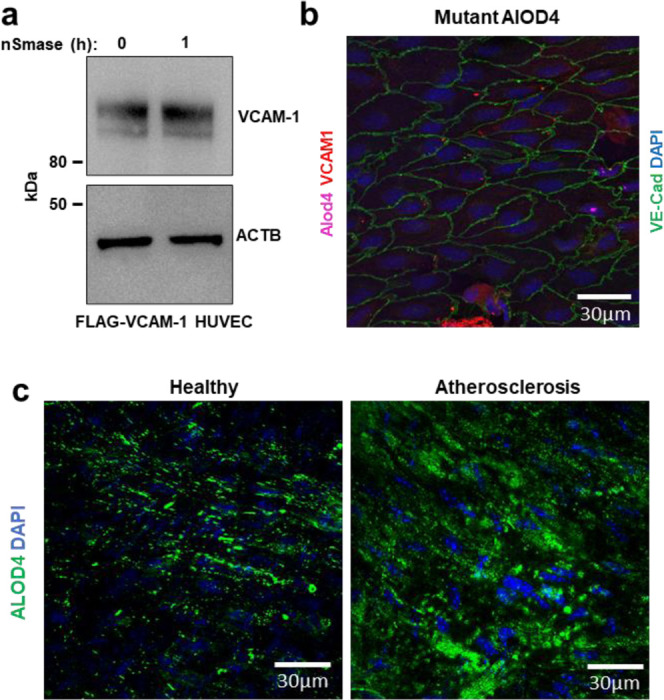
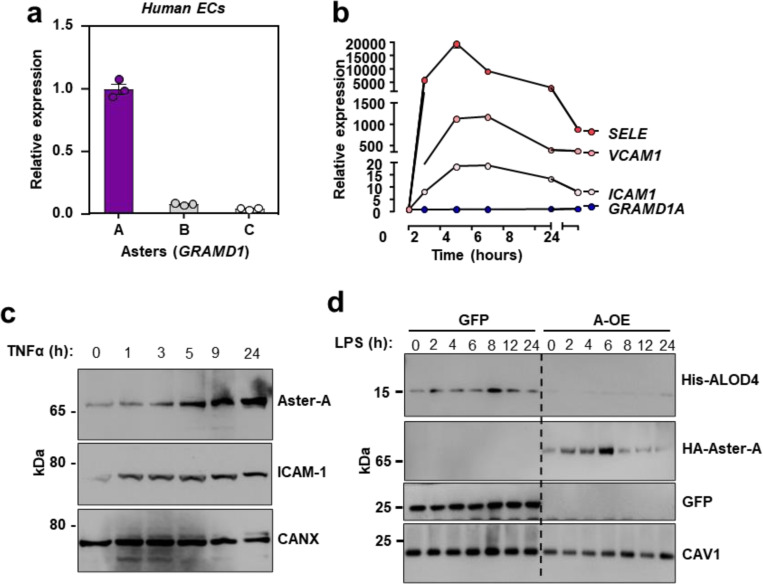
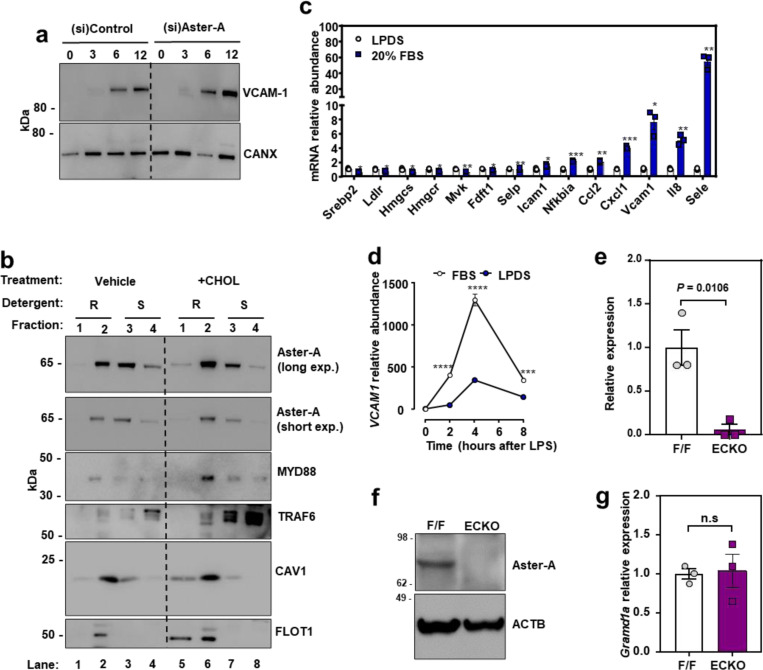
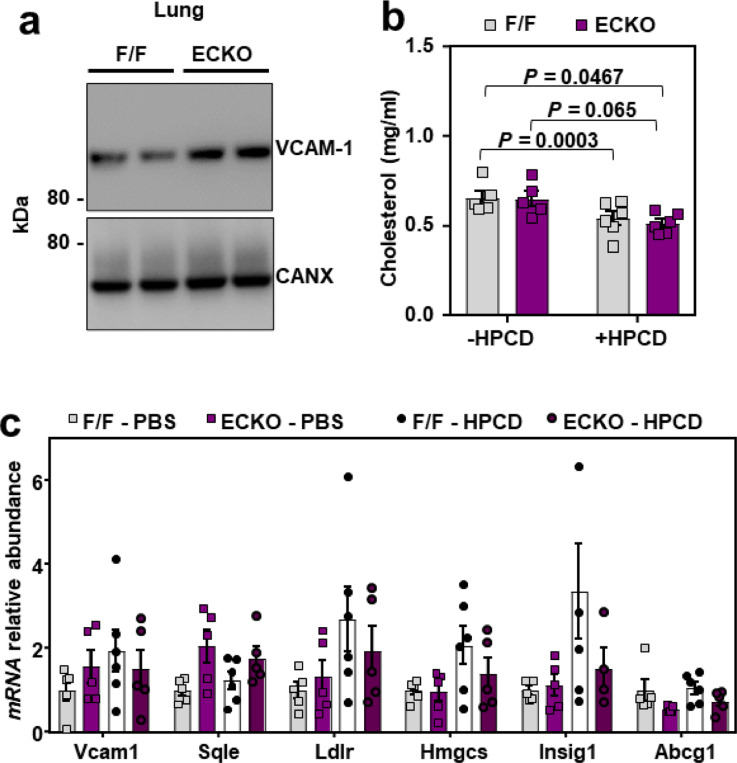
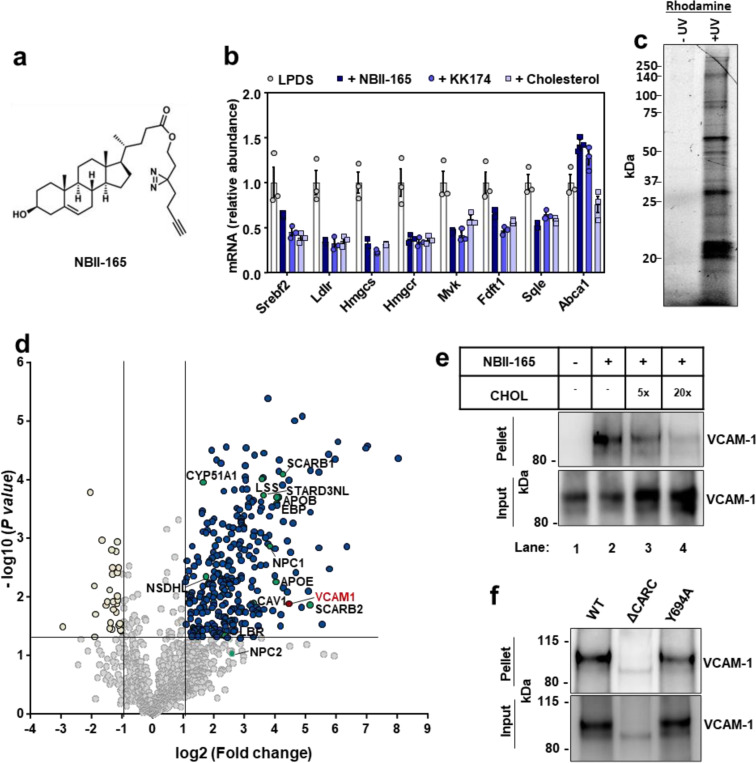
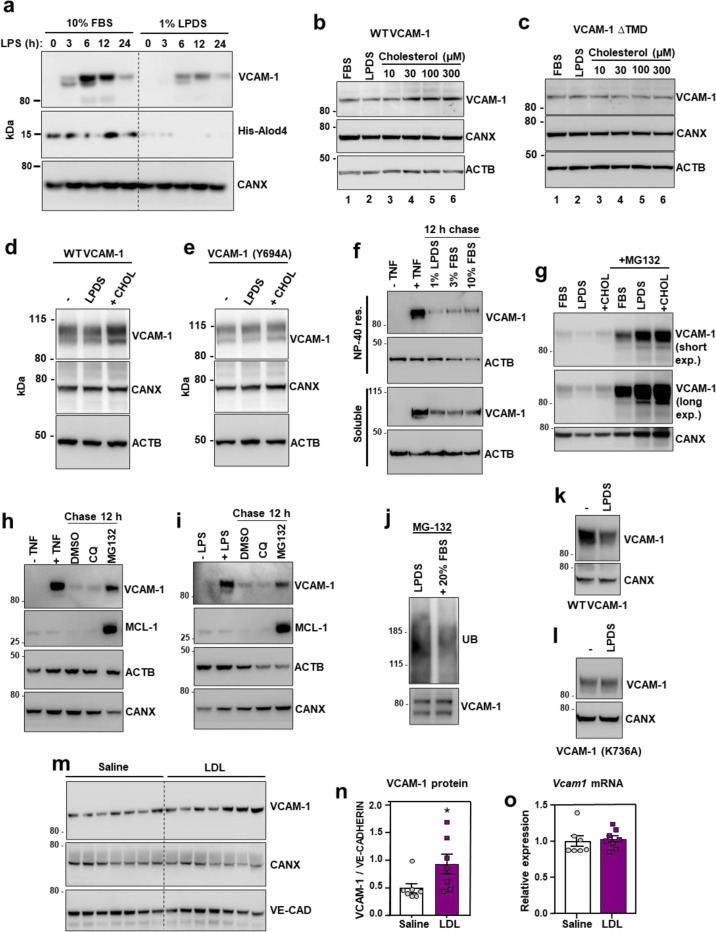
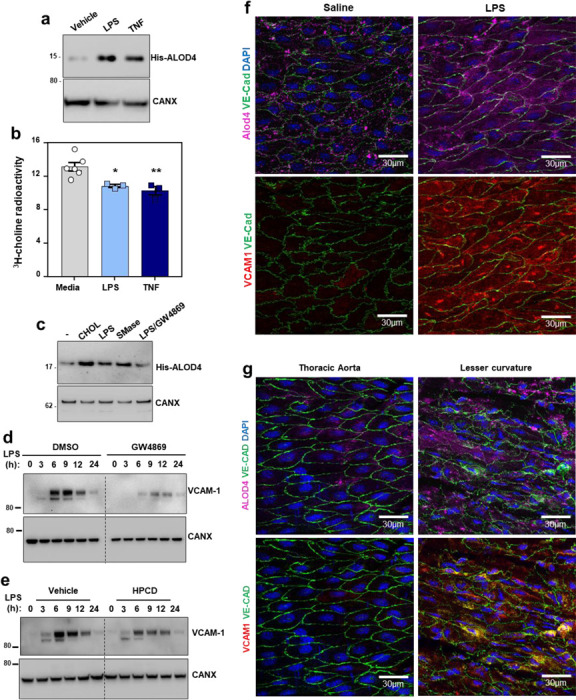
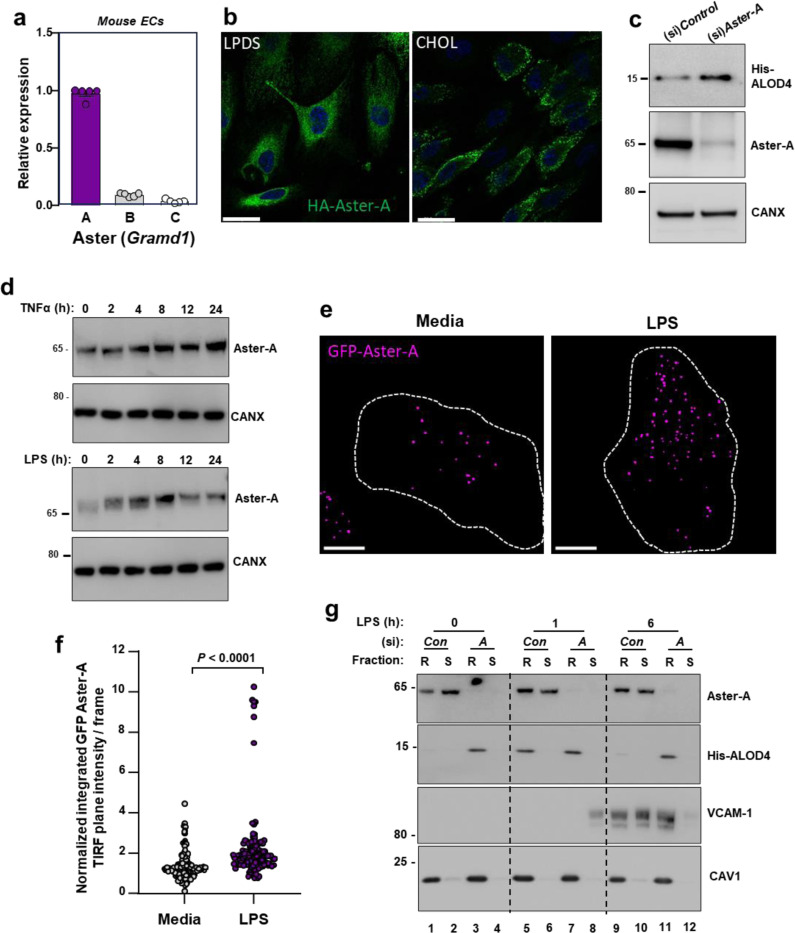
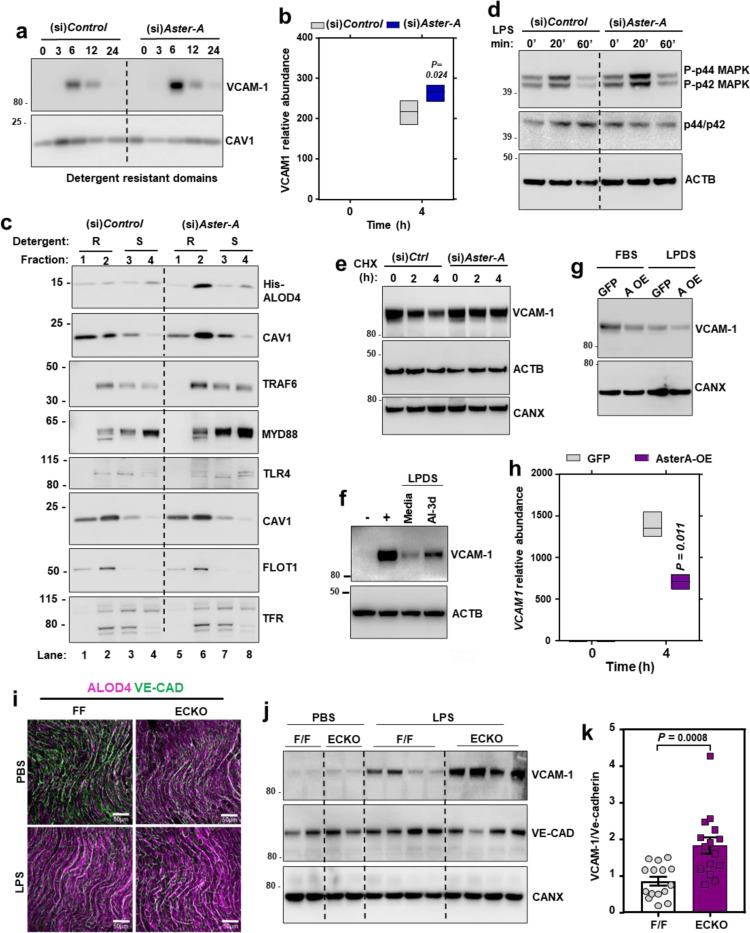
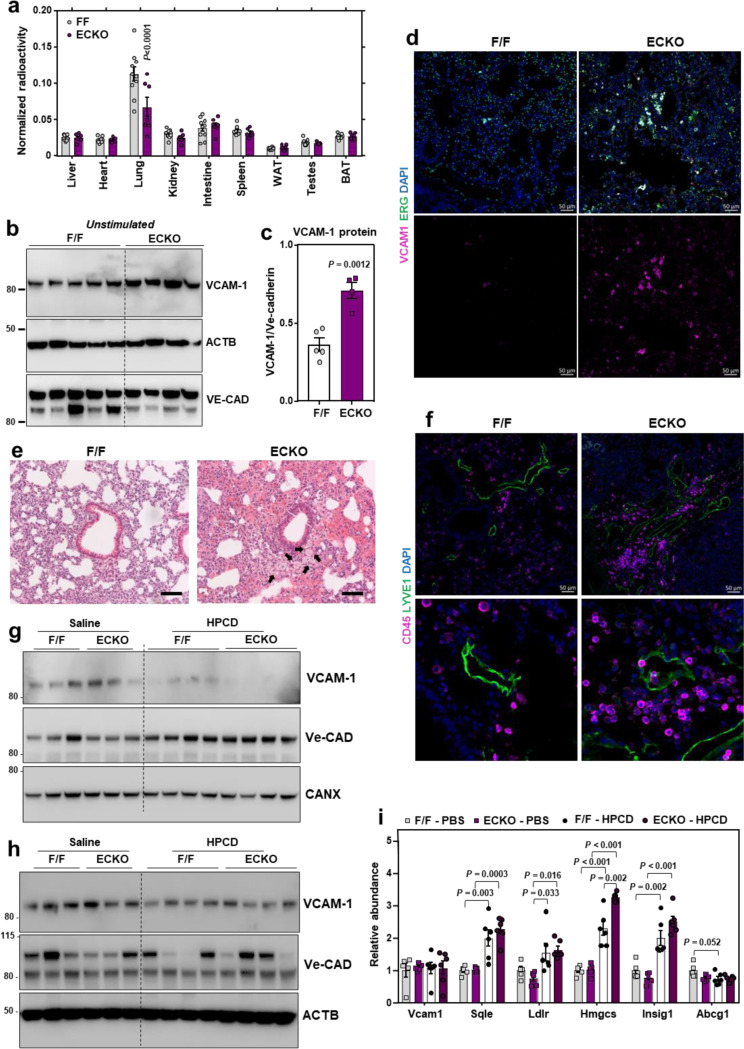
Hypercholesterolemia has long been implicated in endothelial cell (EC) dysfunction, but the mechanisms by which excess cholesterol causes vascular pathology are incompletely understood. Here we used a cholesterol-mimetic probe to map cholesterol-protein interactions in primary human ECs and discovered that cholesterol binds to and stabilizes the adhesion molecule VCAM-1. We show that accessible plasma membrane (PM) cholesterol in ECs is acutely responsive to inflammatory stimuli and that the nonvesicular cholesterol transporter Aster-A regulates VCAM-1 stability in activated ECs by controlling the size of this pool. Deletion of Aster-A in ECs increases VCAM-1 protein, promotes immune cell recruitment to vessels, and impairs pulmonary immune homeostasis. Conversely, depleting cholesterol from the endothelium in vivo dampens VCAM-1 induction in response to inflammatory stimuli. These findings identify cholesterol binding to VCAM-1 as a key step during EC activation and provide a biochemical explanation for the ability of excess membrane cholesterol to promote immune cell recruitment to the endothelium.


Figures

Extended Data Fig. 1.
Extended Data Fig. 1.. Cholesterol directly binds to VCAM-1.
(a) Structure of the KK-174 probe. (b and c) The first lane in each condition represents cells with no cholesterol probe added before UV exposure. The remaining lanes represent cells loaded with 10 μM cholesterol-mimetic probe alone or with increasing concentrations of MβCD-cholesterol (30 μM or 100 μM) for 1 h before UV crosslinking. After UV exposure, cells were lysed, a rhodamine-azide tag was conjugated via click chemistry onto probe-bound samples, and cellular proteins were separated by SDS-PAGE. (b) Probe bound samples were visualized via the florescent rhodamine signal. (c) Coomassie staining of total cellular proteins from (b). (d) Competition assay showing that cholesterol competes with KK-174 for binding to VCAM-1 in HUVECs stably overexpressing human VCAM-1. Input shows VCAM-1 detected in whole cell lysates prior to immunoprecipitation and pellet shows VCAM-1 detected after streptavidin immunoprecipitation of probe bound proteins. (e) Amino acids 688–739 (corresponding to the TMD and CTD) in human and mouse VCAM-1 with the CARC motif in the TMD highlighted in pink and the central tyrosine (Y) residue that was mutated in Fig. 1F highlighted in blue.
Extended Data Fig. 2.
Extended Data Fig. 2.. Cholesterol binding stabilizes VCAM-1.
(a) Western blot for VCAM-1 in HUVECs cultured in media containing either 10% FBS with simvastatin or 1% FBS with simvastatin for 24 h before stimulation with LPS (100 ng/ml) for 0–24 h. (b) VCAM-1 western blots in cells stably overexpressing human VCAM-1 and cultured in media containing either 10% FBS or 1% LPDS with simvastatin for 16 h. (c) VCAM-1 western blots in the NP-40 resistant fraction of HUVECs stably overexpressing FLAG-VCAM-1 and cultured in media containing 1% LPDS with simvastatin for the indicated times. In the last two lanes, 100 μM MβCD-cholesterol or LDL (50 ug/ml) was added for the last 2 or 4 h of the 24 h LPDS chase, respectively. (d) Total plasma cholesterol in male WT mice 6 h after receiving i.v. infusions of either saline or LDL (n = 7 saline and 8 LDL). Data are represented as mean ± SEM with individual mice noted as dots.
Extended Data Fig. 3.
Extended Data Fig. 3.. PM cholesterol accessibility increases during EC activation and hypercholesterolemia.
(a) HUVECs stably expressing FLAG-VCAM-1 and cultured in media containing 1% LPDS with simvastatin overnight were treated with or without neutral sphingomyelinase for 2 h before immunoblotting for VCAM-1. (b) En face imaging of aortas from female mice that had been perfused with cholesterol-binding mutant versions ALOD4–647. Samples were co-stained with VCAM-1 (red), Ve-cadherin (green), and DAPI (blue). Scale bar, 30 μm. (c) ALOD4–488 binding to en face aortas of either male WT mice fed a chow diet or LDLR knockout mice that had been fed a Western diet for 20 weeks to induce atherosclerosis. Samples were co-stained with DAPI (blue). Scale bar, 30 μm.
Extended Data Fig. 4.
Extended Data Fig. 4.. Aster-A undergoes post-translational stabilization in ECs after activation.
(a) GRAMD1A (Aster-A), GRAMD1B (Aster-B) and GRAMD1C (Aster-C) expression relative to 36B4 in primary HAECs. (b) qPCR for SELE, VCAM1, ICAM1 and GRAMD1A (Aster-A) in immortalized HAECs treated with TNFα for 0–24 h. (c) Endogenous Aster-A and ICAM-1 protein levels in HAECs treated with TNFα (10 ng/ml) for 0–24 h. (d) Western blots for His-ALOD4 and HA-Aster-A in HAECs stably overexpressing HA-Aster-A or GFP after LPS exposure for 0–24 h. Data are represented as mean ± SEM.
Extended Data Fig. 5.
Extended Data Fig. 5.. Nonvesicular cholesterol transport regulates inflammatory signaling in ECs.
(a) Western blots for VCAM-1 in HAECs treated with (si)Control or (si)Aster-A and cultured in media containing 5% FBS with simvastatin overnight before exposure to LPS for the indicated times. (b) Western blots in HUVECs incubated with or without 100 μM MBCD-cholesterol for 1 h before fractionation of cells into Triton-X100 resistant or Triton-X100 soluble domains. (c) qPCR analysis in cells cultured in LPDS with simvastatin overnight before being loaded with or without the same media containing 20% FBS for 4 h. Target genes were normalized relative to 36B4. (d) qPCR for VCAM1 relative to 36B4 in HAECs cultured in either 10% FBS or 1% LPDS with simvastatin overnight before being stimulated with LPS (100 ng/ml) for 0–8 h. (e) Gramd1a mRNA in isolated hepatic ECs from F/F or ECKO mice. (f) Western blot for Aster-A in isolated hepatic ECs from F/F and ECKO mice. (g) Gramd1a mRNA in liver tissue from F/F or ECKO mice. n = 3 F/F and 3 ECKO. Data are represented as mean ± SEM.
Extended Data Fig. 6.
Extended Data Fig. 6.. HPCD infusions lower VCAM-1 in response to LPS in vivo.
(a) Western blots for VCAM-1 in the lungs of male F/F and ECKO mice 3 weeks after Cre induction. (b) Total plasma cholesterol in male F/F and ECKO mice injected with LPS (60 μg/mouse) for 20 mins before receiving i.v infusions of saline or HPCD (60 mg/mouse). Blood and tissues were collected 3 h after LPS injections. n = 5 F/F + saline, 5 ECKO + saline, 6 F/F + HPCD and 6 ECKO + saline. (c) qPCR in the hearts of male F/F and ECKO mice injected with LPS (60 μg/mouse) for 20 mins before receiving i.v infusions of saline or HPCD (60 mg/mouse). Tissues were collected 3 h after LPS injections. n = 5 F/F + saline, 5 ECKO + saline, 6 F/F + HPCD and 6 ECKO + saline. Data are represented as mean ± SEM with individual mice noted as dots.
Fig. 1.
Fig. 1.. Cholesterol-mimetic probes identify VCAM-1 as a cholesterol binding protein in primary human ECs.
(a) Structure of NBII-165 probe. (b) HUVECs were depleted of cholesterol overnight in LPDS containing simvastatin. Cells were then loaded with 35 μM NBII-165, KK-174 or cholesterol complexed to methyl-beta cyclodextrin for 4 h before collection and assessment of SREBP-2 targets by qPCR. (c) Rhodamine-azide signal in HUVEC lysates. HUVECs were incubated with 10 μM NBII-165 probe for 1 h, with and without 365 nm UV irradiation before attachment of a rhodamine-azide fluorophore by click chemistry and separation of proteins by sodium dodecyl sulfate (SDS)-polyacrylamide gel electrophoresis (PAGE). The in-gel rhodamine signal was visualized with a fluorescent imager. (d) Volcano plot showing proteins that were detected by mass spec after immunoprecipitation of NBII-165-bound proteins. Dark blue dots indicate significantly enriched proteins. Yellow dots indicate proteins that were significantly lower in the UV exposed samples. Green dots indicate known sterol binding proteins. Burgundy dot indicates VCAM-1. (e) Competition assay showing that cholesterol competes with NBII-165 for binding to VCAM-1 in HUVECs stably overexpressing human VCAM-1. Input shows VCAM-1 detected in whole cell lysates prior to immunoprecipitation and pellet shows VCAM-1 detected after streptavidin immunoprecipitation of probe bound proteins. (f) Immunoprecipitation of WT VCAM-1 or mutant versions of VCAM-1 either lacking the CARC motif or with a tyrosine for alanine mutation at amino acid 694 after incubating HUVECs with KK-174 followed by UV crosslinking. Data are represented as mean ± SEM.
Fig. 2.
Fig. 2.. Cholesterol binding stabilizes VCAM-1.
(a) Western blots for VCAM-1 and His-ALOD4 in HUVECs cultured in media containing either 10% FBS or 1% LPDS with simvastatin for 16 h before stimulation with LPS (100 ng/ml) for 0–24 h. (b and c) VCAM-1 western blots in cells stably overexpressing either human VCAM-1 or VCAM-1(∆TMD) and cultured in media containing 10% FBS, 1% LPDS with simvastatin and mevalonate overnight, or LPDS with simvastatin and mevalonate overnight before addition of increasing concentrations of MβCD-cholesterol for 2 h. (d and e) VCAM-1 western blots in HUVECs stably expressing either FLAG-VCAM-1 or FLAG-VCAM-1(Y694A) cultured in media containing 10% FBS (−), 1% LPDS with simvastatin for 8 h, or 1% LPDS with simvastatin plus 100 μM MβCD-cholesterol for 2 h. (f) Western blots for VCAM-1 in HUVECs cultured in media containing 10% FBS and stimulated with TNFα for 12 h before being placed in media containing simvastatin and either 1% LPDS, 3% FBS or 10% FBS for a further 12 h. The top rows show the NP-40 resistant portion of cells while the bottom rows show the NP-40 soluble portion of cells. (g) VCAM-1 western blots showing the effects of proteasome inhibition with MG-132 in HUVECs stably overexpressing FLAG-VCAM-1 and cultured in 10% FBS, 1% LPDS with simvastatin overnight or LPDS with simvastatin plus 100 μM MβCD-cholesterol for 1 h. (h and i) HUVECs were treated with either LPS or TNFα for 36 h before being incubated with chloroquine (10 μM) or MG132 (10 μM) for a further 12 hours. VCAM-1 and MCL-1 (positive control for MG-132) were assessed by western blot. (j) HUVECs expressing FLAG-VCAM-1 were cultured in 1% LPDS with simvastatin overnight before being switched to media containing MG132 (10 μM) in 1% LPDS with simvastatin or 1% LPDS with simvastatin plus 20% FBS for 4 h. FLAG was immunoprecipitated before VCAM-1 and ubiquitin were assessed by western blot. (k and l) HUVECs expressing FLAG-VCAM-1 or FLAG-VCAM-1(K736A) were switched from media containing 10% FBS to media containing 1% LPDS with simvastatin for 12 h to assess their rate of degradation in cholesterol deplete conditions by western blotting. (m) Western blot for VCAM-1 in the lungs of male WT mice that received i.v. infusions of either saline or LDL for 6 h (n = 7 per group). (n) Quantification of VCAM-1 relative to Ve-cadherin measured by western blot in the lungs of WT mice after i.v. infusions of LDL or saline for 6 h. (o) mRNA levels of Vcam1 relative to 36b4 in the lungs of male WT mice that received i.v. infusions of either saline or LDL for 6 h (n=7 saline and 8 LDL). Data are represented as mean ± SEM with individual mice represented by dots.
Fig. 3.
Fig. 3.. PM cholesterol accessibility increases during EC activation and influences the magnitude of VCAM-1 induction.
(a) Western blot to assess His-ALOD4 binding to the surface of HUVECs exposed to either LPS (100 ng/ml) or TNFα (10 ng/ml) for 1 h. (b) [3H]-choline-labeled SM in HAECs after incubation with LPS (100 ng/ml) or TNFα (7.5 ng/ml) for 40 mins. (c) Western blot to assess His-ALOD4 binding to the surface of HAECs treated with MβCD-cholesterol (100 μM), LPS (100 ng/ml), bacterial nSMase (1 U/ml), or LPS co-incubated with the neutral sphingomyelinase inhibitor GW4869 (5 μM) for 1 h. (d) Western blot for VCAM-1 in HUVECs pre-treated with or without GW4869 (10 μM) for 30 mins before exposure to LPS for the indicated times. (e) VCAM-1 in HUVECs treated with LPS for 30 mins before being incubated with or without HPCD for 15 mins. After washing away the HPCD, cells were incubated with media containing 10% FBS for the indicated times. (f) ALOD4–647 binding to the thoracic aorta of female mice after i.p injections of either saline or LPS (60 μg per mouse) for 3 h. Samples were co-stained with VCAM-1 (red), Ve-cadherin (green) and DAPI (blue). Scale bar, 30 μm (g) ALOD4–647 binding to thoracic aorta or the aortic arch (lesser curvature) of female mice. Samples were co-stained with VCAM-1 (red), Ve-cadherin (green) and DAPI (blue). Scale bar, 30 μm. Data are represented as mean ± SEM.
Fig. 4.
Fig. 4.. Aster-A regulates accessible cholesterol in ECs after activation.
(a) Gramd1a (Aster-A), Gramd1b (Aster-B) and Gramd1c (Aster-C) expression relative to 36b4 in primary mouse hepatic ECs. (b) Confocal microscopy of HAECs stably expressing HA-Aster-A and cultured in LPDS or LPDS with MβCD-cholesterol (100 μM) for 1 h. Scale bar, 23 μm. (c) His-ALOD4 binding to the surface of HAECs treated with (si)Control or (si)Aster-A and cultured in 10% FBS. (d) Endogenous Aster-A protein levels in HUVECs exposed to TNFα (10 ng/ml; top) or LPS (100 ng/ml; bottom) for the indicated times. (e) TIRF microscopy of HAECs stably expressing EGFP-Aster-A and cultured in fresh complete medium (10% FBS) or fresh complete medium plus LPS (100 ng/ml) for 60 mins. Pseudo-colored dots indicate GFP-Aster-A intensity in the TIRF plane (within 100 nm of the PM). Dashed lines indicate cell boundaries. Scale 10 μm. (f) Quantification of GFP-Aster-A in the TIRF plane +/− LPS. Values represent normalized integrated intensities at 40 −70 min after changing to fresh media +/− LPS. Control n = 154 frames from 52 cells, LPS n = 140 frames from 53 cells from two independent experiments. (g) Western blots of HUVECs treated with (si)Control or (si)Aster-A and exposed to LPS for the indicated times before incubation with ALOD4. Cells were subsequently fractionated into Trition-X100 detergent soluble or detergent resistant domains. Data are represented as mean ± SEM.
Fig. 5.
Fig. 5.. Nonvesicular cholesterol transport regulates VCAM-1 stability in vivo.
(a) Western blot for VCAM-1 in detergent resistant domains of immortalized HAECs treated with (si)Control or (si)Aster-A and exposed to LPS (100 ng/ml) for the indicated times. Cells were cultured in media containing 5 % FBS and simvastatin for 16 h before LPS exposure. (b) VCAM1 mRNA levels relative to 36B4 in HUVECs exposed to LPS for the indicated times. Center line, mean; box limits, upper and lower values. (c) Western blots in HUVECs treated with (si)Control or (si)Aster-A and exposed to LPS for 15 mins before fractionation into detergent resistant (fractions 1 or 2) or detergent soluble domains (fractions 3 or 4). Cells were cultured in media containing 5% FBS with simvastatin overnight before exposure to LPS. Separate dishes were used to assess -His-ALOD4 binding (top 2 rows) and TRAF6/MYD88 localization (bottom 6 rows). (d) Western blots for p-ERK or total ERK in HUVECs treated with (si)Control or (si)Aster-A and exposed to LPS (100 ng/ml) for the indicated times. (e) Cycloheximide chase of FLAG-VCAM-1 in HUVECs treated with (si)Control or (si)Aster-A. (f) Western blots for VCAM-1 HUVECs stimulated with LPS for 12 h before being placed in media containing LPDS and simvastatin with or without AI-3d (2.5 μM) for a further 12 h. (g) VCAM-1 protein levels in HAECs stably overexpressing Aster-A or GFP and cultured in either 10% FBS or 1% LPDS with simvastatin before exposure to LPS (100 ng/ml) for 8 h. (h) VCAM1 mRNA levels relative to 36B4 in HAECs stably overexpressing HA-Aster-A or GFP and exposed to LPS for the indicated times. Center line, mean; box limits, upper and lower values. (i) ALOD4–647 binding to aortas of male F/F and ECKO mice injected with either saline or LPS (60 μg per mouse) for 3 h. Samples were co-stained with Ve-cadherin (green). Scale bar, 50 μm. (j) Western blots for VCAM-1 in the hearts of male F/F and ECKO mice 3 h after i.p. injections of saline or LPS (60 μg/mouse). (k) Quantification of VCAM-1 relative to Ve-cadherin measured by western blot in the hearts of male F/F and ECKO after i.p. injections of LPS (60 μg/mouse) for 3 h. n = 15 mice per group. Data is from 3 independent experiments. Data are represented as mean ± SEM.
Fig. 6.
Fig. 6.. HPCD infusions lower VCAM-1 in response to LPS in vivo.
(a) Tissue [3H]-cholesterol radioactivity normalized to tissue weight in male F/F and ECKO mice 72 h after i.v. administration of [3H]-cholesterol-HDL. Samples analyzed by two-way ANOVA with genotype and tissue as independent variables. P tissue < 0.0001; P genotype < 0.0061; P interaction < 0.0001. n = 10 F/F and 7 ECKO. (b) Western blots for VCAM-1 in the lungs of female F/F and ECKO mice 1 year after Cre induction. n = 5 F/F and 4 ECKO. (c) Quantification of VCAM-1 relative to Ve-cadherin measured by western blot as shown in Fig. 7B. (d) Immunofluorescence microscopy of VCAM-1 (pink), ERG (green) and DAPI (blue) in the lungs of female F/F and ECKO mice 3 weeks after Cre induction. Scale bar, 50 μm. (e) H & E staining in the lungs of female F/F and ECKO mice 3 weeks after Cre induction. Arrows indicate immune cells around vessels. Scale bar, 100 μm. (f) CD45-positive immune cells (purple) co-stained with the lymphatic vessel marker LYVE1 (green) and DAPI (blue) in the lungs of female F/F and ECKO mice 3 weeks after Cre induction. Scale bar, 50 μm. (g and h) VCAM-1 in the hearts and lungs of male F/F and ECKO mice injected with LPS for 20 mins before receiving i.v infusions of saline or HPCD. Tissues were collected 3 h after LPS injections. n = 5 F/F + saline, 5 ECKO + saline, 6 F/F + HPCD and 6 ECKO + saline. (i) qPCR in the lungs of male F/F and ECKO mice injected with LPS for 20 mins before receiving i.v infusions of saline or HPCD. Tissues were collected 3 h after LPS injections. n = 5 F/F + saline, 5 ECKO + saline, 6 F/F + HPCD and 6 ECKO + saline. Data are represented as mean ± SEM with individual mice noted as dots.

References

    1. Pober J. S. & Sessa W. C. Evolving functions of endothelial cells in inflammation. Nat Rev Immunol 7, 803–815 (2007). 10.1038/nri2171 - DOI - PubMed
    1. Ley K. & Reutershan J. Leucocyte-endothelial interactions in health and disease. Handb Exp Pharmacol, 97–133 (2006). 10.1007/3-540-36028-x_4 - DOI - PubMed
    1. Lo S. K. et al. Endothelial-leukocyte adhesion molecule 1 stimulates the adhesive activity of leukocyte integrin CR3 (CD11b/CD18, Mac-1, alpha m beta 2) on human neutrophils. J Exp Med 173, 1493–1500 (1991). 10.1084/jem.173.6.1493 - DOI - PMC - PubMed
    1. Osborn L. et al. Direct expression cloning of vascular cell adhesion molecule 1, a cytokine-induced endothelial protein that binds to lymphocytes. Cell 59, 1203–1211 (1989). 10.1016/0092-8674(89)90775-7 - DOI - PubMed
    1. Lange Y., Swaisgood M. H., Ramos B. V. & Steck T. L. Plasma membranes contain half the phospholipid and 90% of the cholesterol and sphingomyelin in cultured human fibroblasts. J Biol Chem 264, 3786–3793 (1989). - PubMed

Publication types

LinkOut - more resources