[Preprint]. 2024 Sep 17:2024.09.16.613361.
doi: 10.1101/2024.09.16.613361.

High-throughput optimized prime editing mediated endogenous protein tagging for pooled imaging of protein localization

Affiliations

High-throughput optimized prime editing mediated endogenous protein tagging for pooled imaging of protein localization

Henry M Sanchez et al. bioRxiv. .

Abstract

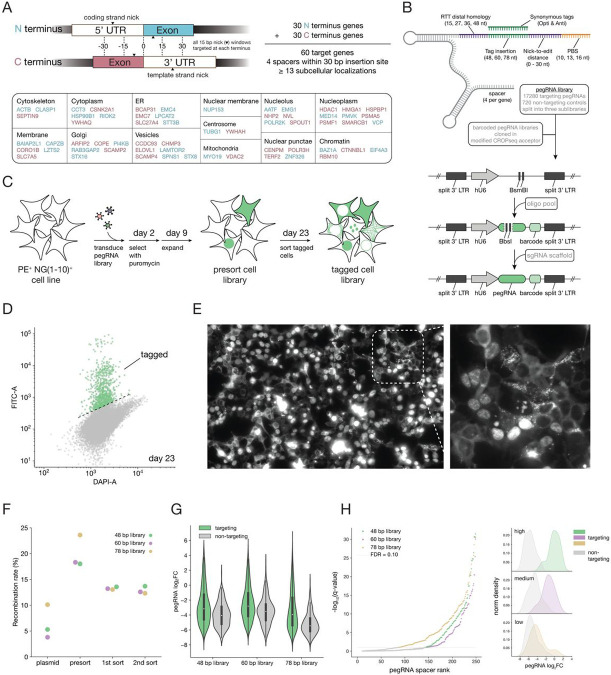
The subcellular organization of proteins carries important information on cellular state and gene function, yet currently there are no technologies that enable accurate measurement of subcellular protein localizations at scale. Here we develop an approach for pooled endogenous protein tagging using prime editing, which coupled with an optical readout and sequencing, provides a snapshot of proteome organization in a manner akin to perturbation-based CRISPR screens. We constructed a pooled library of 17,280 pegRNAs designed to exhaustively tag 60 endogenous proteins spanning diverse localization patterns and explore a large space of genomic and pegRNA design parameters. Pooled measurements of tagging efficiency uncovered both genomic and pegRNA features associated with increased efficiency, including epigenetic states and interactions with transcription. We integrate pegRNA features into a computational model with predictive value for tagging efficiency to constrain the design space of pegRNAs for large-scale peptide knock-in. Lastly, we show that combining in-situ pegRNA sequencing with high-throughput deep learning image analysis, enables exploration of subcellular protein localization patterns for many proteins in parallel following a single pooled lentiviral transduction, setting the stage for scalable studies of proteome dynamics across cell types and environmental perturbations.


Figures

Figure 1.
Figure 1.. Stable expression of prime editing components enables endogenous tagging with increased efficiency over time after pegRNA delivery at low multiplicity of infection.
(A) Vector design for piggybac prime editor and lentiviral split mNG(1-10) reporter (addgene #157993). (B) Workflow for prime editing mediated endogenous protein tagging in an engineered prime editing and split mNeonGreen reporter HEK293T line. (C) Tagging efficiency over time for two clonal lines expressing PE2 at different expression levels and delivery of an mNG(11) peptide insertion encoding pegRNA targeting the C terminus of H2BC21 at different MOIs. Error bars denote the standard deviation of n = 3 individual pegRNA transductions for each timepoint and condition. (D) Flow cytometry density plot at day 28 post lentiviral transduction of a pegRNA targeting the C-terminus of H2BC21 for mNG(11) tagging (E) 60X confocal images of mNG(11) tagged H2BC21 in post-sort HEK293Ts. Scale bar = 20 um. (G) Sanger sequencing trace for an mNG(11) tagged allele with respect to a wild-type reference allele from sorted tagged cells.
Figure 2.
Figure 2.. Construction of pooled pegRNA libraries for N and C terminus tagging of multiple genes while exploring a range of pegRNA design parameters.
(A) Selection of genes covering diverse subcellular localization patterns, noting their terminus tagging and nicking locations. (B) Combinations of pegRNA design parameters explored for each spacer sequence. Tagging libraries are cloned in two consecutive large scale cloning steps starting with a pegRNA oligo pool. (C) Illustration depicting the generation of a pooled tagged cell library. (D) FACS 2D density plot at day 23 post pegRNA library lentiviral transduction for the 60 bp tag library. (E) Fluorescence image of a pooled tagged cell library showing diverse localization patterns, suggesting a different protein is tagged in each cell. (F) Spacer barcode recombination rates at different stages of library construction. (G) Violin plots showing targeting and non-targeting control distributions of pegRNA fold changes (log2FC for each double sorted sublibrary. As expected most pegRNAs are depleted in sorted cell populations with a long tail of active pegRNAs observed primarily in the targeting group. (H) Spacer ranking by FDR corrected p-values for a one-sided KS test comparing the distribution of pegRNAs for each spacer with the distribution of non targeting pegRNAs within each sublibrary. 108, 105 and 163 out of 240 spacers are considered active at a false discovery rate of 10% for sublibrary 48 bp, 60 bp and 78 bp respectively. 41, 48 and 56 out of 60 genes have at least one spacer considered active at a false discovery rate of 10% for sublibrary 48 bp, 60 bp and 78 bp respectively. All genes had at least one active pegRNA spacer across the three sublibraries. Right panel shows example pegRNA fold change (log2FC) distributions of spacers with high, medium and low tagging efficiencies.
Figure 3.
Figure 3.. Tagging efficiency varies across genomic loci and chromatin states.
(A) Distributions of pegRNA tagging efficiencies for each gene ranked by average gene effect (mean pegRNA log2FC). Whiskers indicate 2.5th and 97.5th percentiles. (B) Comparison of the average gene effect between the 48 bp and 78 bp tag sublibraries. Pearson r correlation is noted. (C) Correlation between the average gene tagging efficiency and measurements of mRNA, protein and fluorescence expression. Highest correlation is observed when tagging efficiency is compared to fluorescence expression by FACS of the same genes tagged in an array format (from OpenCell). (D) Distribution of tagging efficiency comparing tagging at the N and C termini. Whiskers indicate 2.5th and 97.5th percentiles. (E) Correlation between tagging efficiency and different chromatin features sorted in descending order by the correlation for N terminus tagged genes. (F) Example correlations of both the N and C termini with top positive and top negative associated chromatin features.
Figure 4.
Figure 4.. Nicking and insertion through the coding strand is associated with higher tagging efficiencies.
(A) Illustration of how strand nicking location determines pegRNA insertion template design. (B) Box plots of tagging efficiency showing increased rates nicking the coding strand across N and C termini. Whiskers indicate 2.5th and 97.5th percentiles. (C) Box plots of tagging efficiency showing increased rates when nicking the coding strand. pegRNAs are binned by presort day 23 abundance across sublibraries. Whiskers indicate 2.5th and 97.5th percentiles. (D) Reduced average tagging efficiency when nicking is performed on the template strand for each individual gene. (E) Average tagging efficiency as a function of nick position relative to tag insertion site. Error bars indicate 95% confidence intervals. (F) Average tagging efficiency as a function of nick distance to tag insertion site. Error bars indicate 95% confidence intervals. (G) Heatmap showing average tagging efficiency min-max normalized for each gene and binned by nick position. (H) Strictly standardized mean difference (SSMD) of average tagging efficiencies for pegRNAs nicking the coding strand and template strand for each gene.Shows a positive correlation with RNA expression that increases with insertion size. (I) Difference between tagging efficiency at the two strands correlates more with RNA expression than protein measurements.
Figure 5.
Figure 5.. pegRNA design features have small effects on tagging efficiency that can be integrated into a predictive model.
(A) Tagging efficiency distributions when pegRNAs are binned by on target spacer score (RS3). Whiskers indicate 2.5th and 97.5th percentiles. (B) Comparison of average tagging efficiency for each spacer against on target spacer score (RS3) suggests a spacer score threshold necessary but not sufficient for efficient tagging. (C) Tested PBS lengths have similar tagging efficiencies. Error bars indicate 95% confidence intervals. (D) Heatmap comparing tagging efficiency for different value ranges of PBS GC content % and melting temperature °C. (E) Larger RTT homology sequences distal to nick site result in higher average tagging efficiencies. Error bars indicate 95% confidence intervals. (F) Heatmap comparing tagging efficiency for different value ranges of RTT GC content % and melting temperature °C. (G) Comparison of tagging efficiency for pegRNA pairs with synonymous tag insertion template sequences. Left panel illustrates the pegRNA pair design with synonymous mutations that generate different tags with the same resulting amino acid sequence. Right panel shows a scatter plot of pair values colored by FDR compared to non-targeting spacers (Figure 2H). (H) Correlation between Opti/Anti pegRNA pairs to evaluate reproducibility of pegRNA design feature effects on tagging efficiency. Left most panel shows this correlation at the level of individual pegRNA spacers, separating spacers that passed FDR for tagging from those that did not. Middle panel at the level of genes separated based on the number of spacers that passed FDR. Right panel separates genes based on at least one spacer that passed FDR. Dashed lines indicate mean. (I) Precision (y-axis) of predicting the top K most active pegRNAs (x-axis) using XGBoost model compared to random guessing, showing that the model is able to predict active pegRNAs with the tested features. Right panel shows precision for individual genes revealing variability in capture of most active pegRNAs across genes. Center dashed line indicates mean and outer dashed lines indicate one standard deviation. (J) Correlation between predicted and observed tagging efficiencies for each gene demonstrating variability in predictive ranking of pegRNAs across genes. In left panel genes are divided by sublibraries and in right panel each gene is averaged across sublibraries. Center dashed line indicates mean and outer dashed lines indicate one standard deviation. (K) SHAP analysis of feature contributions to XGBoost model predictions. Top 20 features shown are sorted based on feature importance (mean absolute SHAP value). Nicked strand is a categorical feature, red indicates coding strand nick and blue indicates template strand nick. (L) Examples of predicted and observed tagging efficiencies for two genes with high and intermediate correlations.
Figure 6.
Figure 6.. Coupling pooled tagging with in-situ sequencing enables the capture of subcellular localizations of proteins in parallel.
(A) Illustration of the data acquisition pipeline for generating cell albums of individual tagged proteins out of a pooled tagged cell library. (B) Comparison of in situ sequencing cell counts with bulk sequencing normalized read counts for pegRNA spacers in each sublibrary. Pearson r correlation is noted. (C) Comparison of in situ sequencing cell counts using two different padlock probes capturing pegRNA spacers and downstream barcodes respectively for the 60 bp tag insertion sublibrary. Pearson r correlation is noted. (D) Example of individual tagged proteins in comparison with images from OpenCell database where the same protein was tagged in an arrayed format. (E) Manually evaluated statistics on tagging success based on evaluation of cell albums. (F) Correlation of average tagged cell fluorescence intensity and cell-to-cell variability in intensity showing that variance in protein expression scales with protein expression. (G) Two dimensional UMAP embedding of the latent parameters inferred by the trained cytoself neural network followed by HDBSCAN clustering. (H) Example cell albums for clusters with the top represented genes in each cluster and the percentage of cells within the cluster for each tagged gene based on in situ sequencing. (I) Composition of localization patterns within each cluster as determined by HDBSCAN. Expected localization pattern for each protein is based on condensed OpenCell annotations.

References

    1. Cho N. H. et al. OpenCell: Endogenous tagging for the cartography of human cellular organization. Science 375, eabi6983 (2022). - PMC - PubMed
    1. Schmid-Burgk J. L., Höning K., Ebert T. S. & Hornung V. CRISPaint allows modular base-specific gene tagging using a ligase-4-dependent mechanism. Nat. Commun. 7, 12338 (2016). - PMC - PubMed
    1. Kim J. et al. High-throughput tagging of endogenous loci for rapid characterization of protein function. bioRxiv 2022.11.16.516691 (2023) doi:10.1101/2022.11.16.516691. - DOI - PMC - PubMed
    1. Serebrenik Y. V., Sansbury S. E., Kumar S. S., Henao-Mejia J. & Shalem O. Efficient and flexible tagging of endogenous genes by homology-independent intron targeting. Genome Res. 29, 1322–1328 (2019). - PMC - PubMed
    1. Reicher A., Koren A. & Kubicek S. Pooled protein tagging, cellular imaging, and in situ sequencing for monitoring drug action in real time. Genome Res. 30, 1846–1855 (2020). - PMC - PubMed

Publication types

LinkOut - more resources