[Preprint]. 2024 Dec 21:2024.09.12.612768.
doi: 10.1101/2024.09.12.612768.

Contributions of mechanical loading and hormonal changes to eccentric hypertrophy during volume overload: a Bayesian analysis using logic-based network models

Affiliations

Contributions of mechanical loading and hormonal changes to eccentric hypertrophy during volume overload: a Bayesian analysis using logic-based network models

Johane H Bracamonte et al. bioRxiv. .

Update in

Abstract

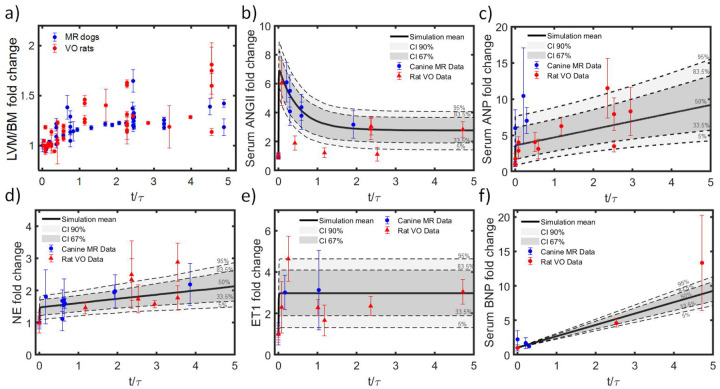
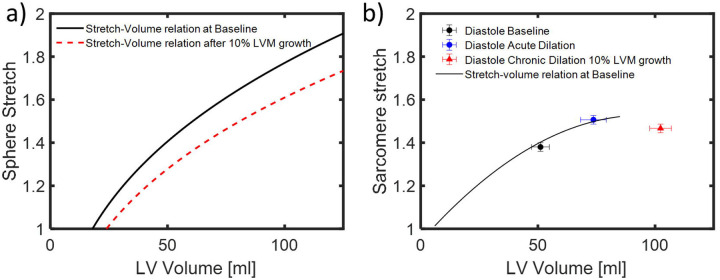
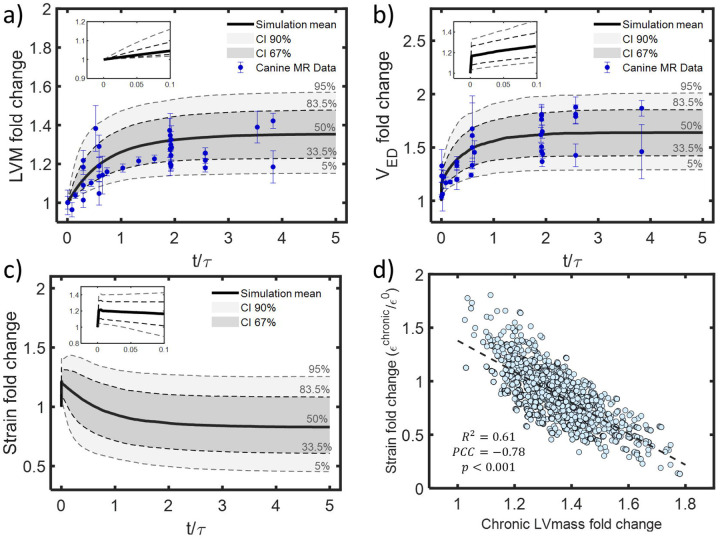
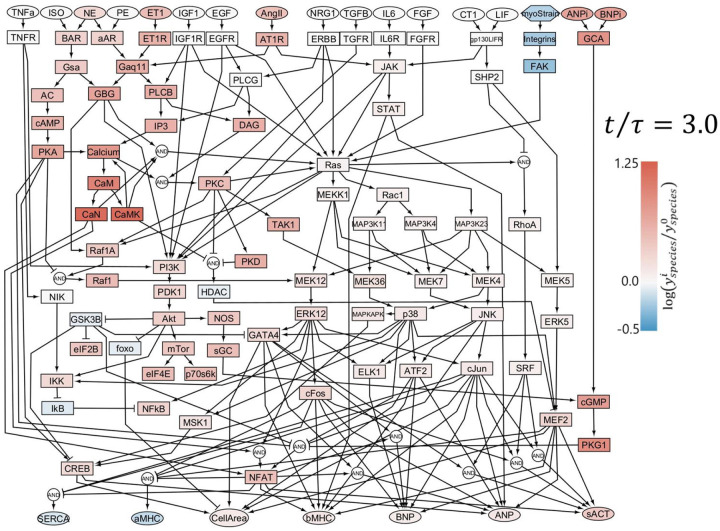
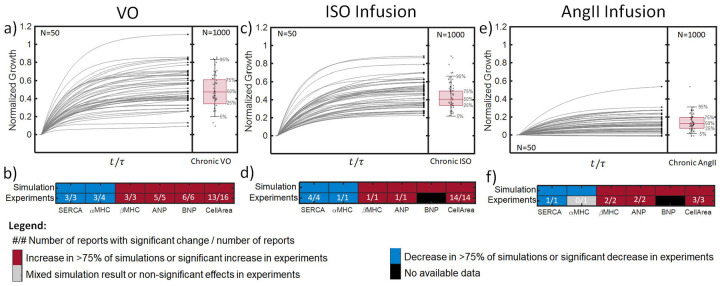
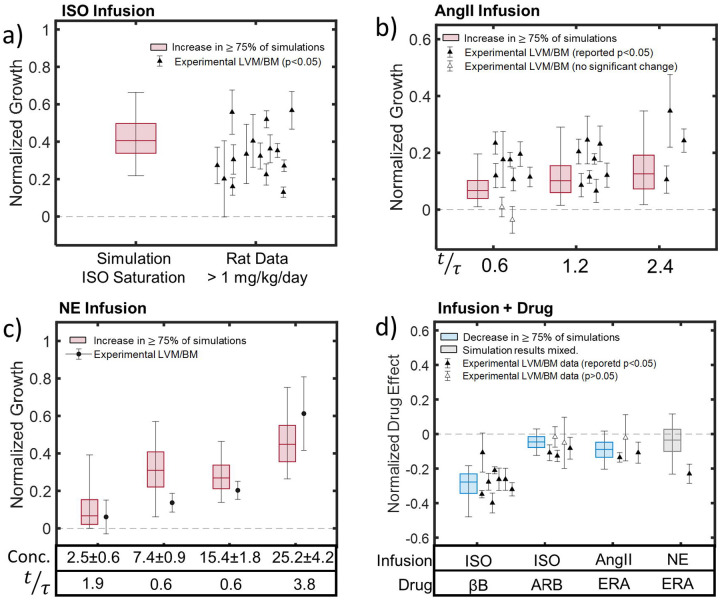
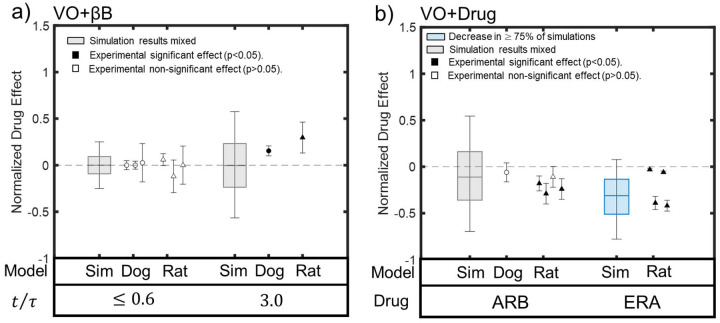
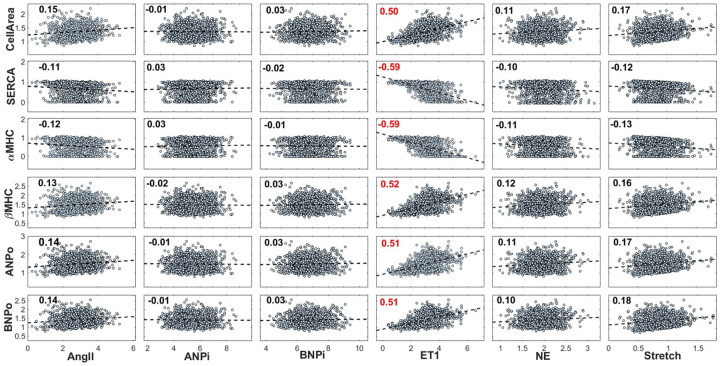
Primary mitral regurgitation (MR) is a pathology that alters mechanical loading on the left ventricle, triggers an array of compensatory neurohormonal responses, and induces a distinctive ventricular remodeling response known as eccentric hypertrophy. Drug therapies may alleviate symptoms, but only mitral valve repair or replacement can provide significant recovery of cardiac function and dimensions. Questions remain about the optimal timing of surgery, with 20% of patients developing systolic dysfunction post-operatively despite being treated according to the current guidelines. Thus, better understanding of the hypertrophic process in the setting of ventricular volume overload (VO) is needed to improve and better personalize the management of MR. To address this knowledge gap, we employ a Bayesian approach to combine data from 70 studies on experimental volume overload in dogs and rats and use it to calibrate a logic-based network model of hypertrophic signaling in myocytes. The calibrated model predicts that growth in experimental VO is mostly driven by the neurohormonal response, with an initial increase in myocardial tissue stretch being compensated by subsequent remodeling fairly early in the time course of VO. This observation contrasts with a common perception that volume-overload hypertrophy is driven primarily by increased myocyte strain. The model reproduces many aspects of 43 studies not used in its calibration, including infusion of individual hypertrophic agonists alone or in combination with various drugs commonly employed to treat heart failure, as well as administration of some of those drugs in the setting of experimental volume overload. We believe this represents a promising approach to using the known structure of an intracellular signaling network to integrate information from multiple studies into quantitative predictions of the range of expected responses to potential interventions in the complex setting of cardiac hypertrophy driven by a combination of hormonal and mechanical factors.


Conflict of interest statement

Competing interest: The authors have no competing interests to declare that are relevant to the content of this article.

Figures

Fig 1.
Fig 1.
Integration of experimental data from MR in dogs and VO in rats. Each plot shows fold changes in one reported measure, plotted as a function of time normalized by the time constant of an exponential equation fitted to the LVM/BW data. a) LVM/BM data from sixteen articles (41 datasets) on experimental MR in dogs [,,–33] and seventeen articles (45 datasets) on experimental VO in rats [–50]. b) 6 measurements of serum angiotensin II (ANGII) from three articles on experimental MR in dogs [29,30,51] and 7 measurements from six articles on experimental VO in rats [,–43,52,53]. c) 3 measurements of serum atrial natriuretic peptide (ANP) levels from three studies in dogs [,–56] and 9 measurements from five studies in rats [,,–59]. d) Norepinephrine (NE): 10 datasets from four MR studies in dogs [21,31,60,61] and 7 datasets from six studies in rats [39,44,48,52,59,62]. e) Endothelin 1 (ET1): two datasets from two studies in dogs [63,64] and two datasets from two studies in rats [36,42]. f) Brain natriuretic peptide (BNP): three datasets from three articles on experimental canine MR [,–56]; two datasets from two articles on experimental VO in rats [38,57]. Probability distribution functions (PDFs) are derived from fits to equations listed in table S1.3. PDFs are presented in shaded gray, median in solid line and quantiles in dashed lines.
Fig 2.
Fig 2.
Effects of inflation and growth on end-diastolic stretch relative to unloaded state in a spherical model and in hearts fixed at control volumes. a) Spherical model predicts that stretch increases with inflation (black solid line), while eccentric hypertrophy shifts the stretch-volume curve downwards, to lower stretch at any given volume (red dashed line). b) Experimental measurements of sarcomere stretch in dog hearts fixed at controlled volumes similarly show increased stretch between physiological loading conditions (Baseline) and acute volume overload (Acute dilation), and a shift in the stretch-volume relationship following 10% growth in LVM during long-term volume overload. Figure adapted from Ross et al. (1971) [66].
Fig 3.
Fig 3.
Changes in volume, mass, and end-diastolic strain during experimental MR in dogs. a) Fitted data on fold changes show a) a 36% increase in LVM [,,–33] and b) 67% increase in LV end-diastolic volume (VED) [,,–,,,,,,,,,–136] on average at steady-state. c) In a spherical model, these changes imply a 20% increase followed by a gradual decrease below baseline in end-diastolic strain on average, with a wide range of trajectories possible for different combinations of mass and volume change. d) Calculated chronic strain levels are lower when LVM increases more. Insets in panels (a-c) show acute changes plotted on a magnified time axis.
Fig 4.
Fig 4.
Predicted chronic activation of the cardiomyocyte signaling network during VO. Colors indicate the logarithm of the fold change in activity of each node in chronic stages of VO relative to baseline, with red indicating an increase and blue indicating a decrease.
Fig 5.
Fig 5.
Results of MC simulations of VO and agonist infusion. Top panels show normalized growth in CellArea for 100 representative simulations (gray lines), with terminal values indicated by black circles; adjacent boxplots reflect the mean, CI50, and CI90 of terminal values for a) Untreated VO, c) ISO infusion, and e) AngII infusion. N indicates the number of simulations employed for the graphical representation. Bottom panels contain heatmaps comparing the predictions of changes in signaling network outputs (SERCA, αMHC, βMHC, ANP, BNP, and CellArea) to experimental data following b) Untreated VO, d) ISO infusion, and f) AngII Infusion. Red indicates that more than 75% of simulations predicted an increase in the output, or that the majority of studies reported a significant increase. Blue indicates a decrease in >75% of simulations or the majority of experiments. Gray indicates the absence of consistent changes in simulations or significant changes in experiments. White numbers indicate the number of studies reporting a significant change and the total number of studies reporting data for each output.
Fig 6.
Fig 6.
Validation of model predictions of growth during infusion of hypertrophic agonists with and without receptor blockers. a) Boxplot shows the mean, 50% confidence interval, and 90% confidence interval for predicted normalized growth in 1000 MC simulations of ISO infusion with the calibrated network. Experimental means (plotted as individual points with error bars) from 13 of 14 published studies [–97] fell within the CI90. b) Model-predicted CI90 for growth during AngII infusion encompassed most published values at the earliest time point and all reported experimental means at later time points [–111]. c) Simulations of four NE infusion experiments in dogs with different doses, fold increases in plasma concentrations (Conc.), and termination times (t/τ) showed reasonable agreement with the limited available data [–115]. d) Simulations of agonist infusion plus receptor blockers replicated reported significant effects of β blockers (βB) on ISO-induced hypertrophy infusion [88,95,116,117], and smaller effects that were significant in some but not all studies for endothelin receptor antagonist (ERA) administration during ISO [86,96,97,117,118] or AngII [111,119,120] infusion. By contrast, the model prediction of nearly equal likelihood that ERA increases or decreases NE-induced growth appears to contradict a significant reported decrease in the only available experimental study [121]. Red coloring of boxplots indicates increases in >75% of simulations, blue indicates decreases in more than 75%, and gray indicates mixed results. Points with error bars indicate experimental mean±SD for studies reporting statistically significant effects (filled markers) or non-significant effects (open markers), from studies in dogs (circles) or rats (triangles).
Fig 7.
Fig 7.
Effects of receptor blockers on VO-induced hypertrophy in published experiments and the calibrated model. a) Simulations of β blockers (βB) at both early (tτ ≤ 0.6) and late stages (tτ = 3) of VO, simulations (boxplots) were equally likely to predict increases or decreases, with no net effect on average. MR experiments in dogs (circles) [15,16,80] and VO in rats (triangles) [14,124] also found no significant effect early but a further increase in growth at later timepoints relative to untreated VO. b) Simulated administration of angiotensin receptor blockers (ARB) also produced mixed results, consistent with mixed results in published studies [29,42,46,50]. By contrast, simulated ERA administration decreases VO-induced hypertrophy in the majority of simulations, and in all four available experiments [–128]. Blue coloring of boxplot indicates predicted decrease in >75% of simulations, gray boxplots indicate mixed simulation results, filled markers indicate experimental means associated with statistically significant effects and open markers indicate means associated with non-significant effects.
Fig 8.
Fig 8.
Sensitivity analysis of network outputs to calibrated network inputs in chronic stages of VO. Each marker represents the final state of one VO experiment from 1,000 Monte Carlo simulations. A linear regression model (dashed line) is fitted to each output-input pair, and the Pearson PCC is displayed on the upper left corner of each. Among the inputs known to vary substantially over the course of VO, ET1 displayed the largest influence on all outputs in the late stages of overload.

Similar articles

References

    1. Wu S, Chai A, Arimie S, Mehra A, Clavijo L, Matthews R V., et al. Incidence and treatment of severe primary mitral regurgitation in contemporary clinical practice. Cardiovascular Revascularization Medicine 2018;19:960–3. 10.1016/J.CARREV.2018.07.021. - DOI - PubMed
    1. Carabello BA. The Current Therapy for Mitral Regurgitation. J Am Coll Cardiol 2008;52:319–26. 10.1016/J.JACC.2008.02.084. - DOI - PubMed
    1. Lorell BH, Carabello BA. Left Ventricular Hypertrophy. Circulation 2000;102:470–9. 10.1161/01.CIR.102.4.470. - DOI - PubMed
    1. Oyama MA. Neurohormonal activation in canine degenerative mitral valve disease: implications on pathophysiology and treatment. Journal of Small Animal Practice 2009;50:3–11. 10.1111/J.1748-5827.2009.00801.X. - DOI - PubMed
    1. Komajda M, Pousset F, Isnard R, Lechat P. The role of the neurohormonal system in heart failure. Heart 1998;79:S17. 10.1136/HRT.79.2008.17S. - DOI - PMC - PubMed

Publication types

LinkOut - more resources