[Preprint]. 2024 Sep 19:2024.09.18.613595.
doi: 10.1101/2024.09.18.613595.

Craters on the melanoma surface facilitate tumor-immune interactions and demonstrate pathologic response to checkpoint blockade in humans

Affiliations

Craters on the melanoma surface facilitate tumor-immune interactions and demonstrate pathologic response to checkpoint blockade in humans

Aya Ludin et al. bioRxiv. .

Abstract

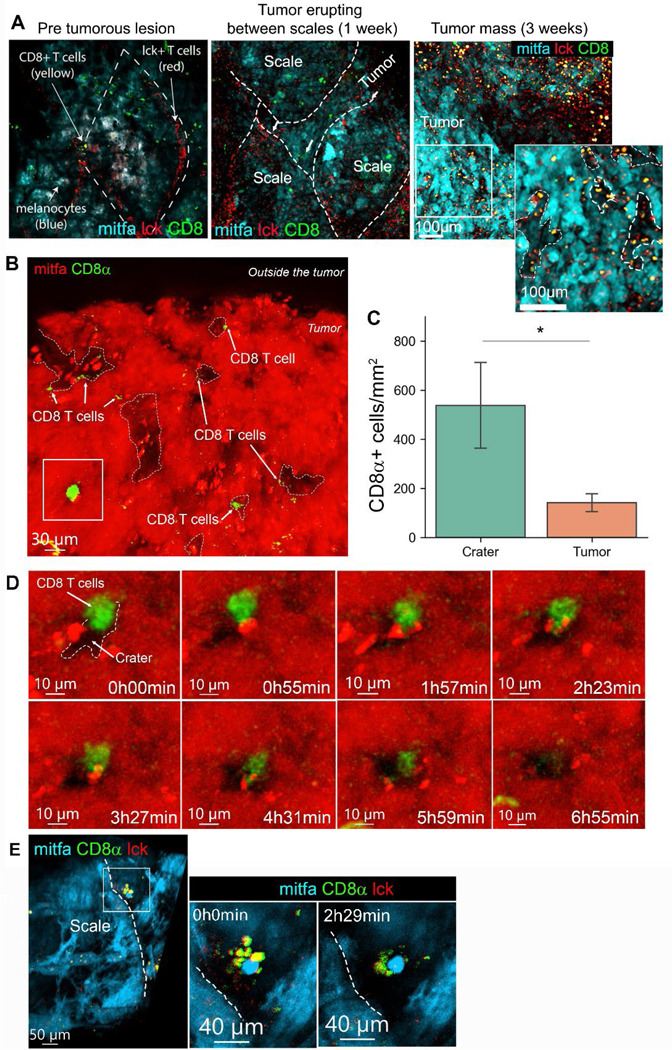
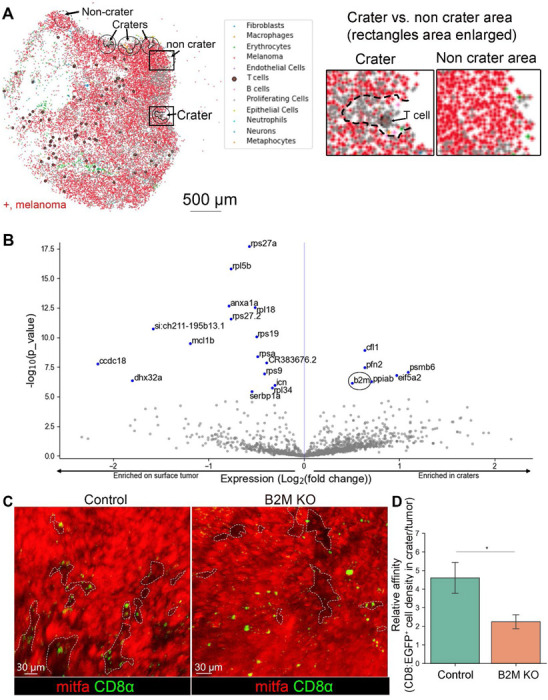
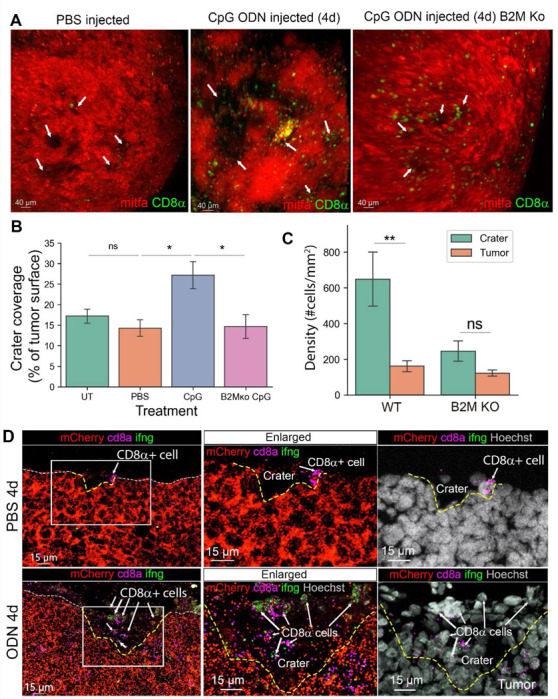
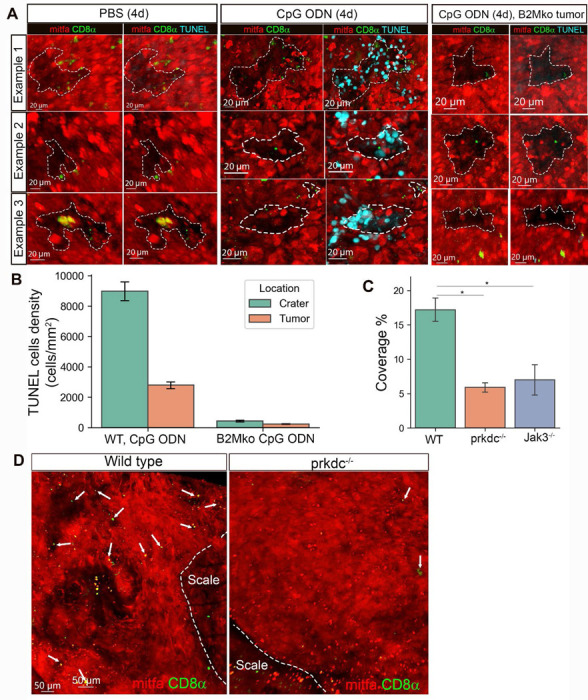
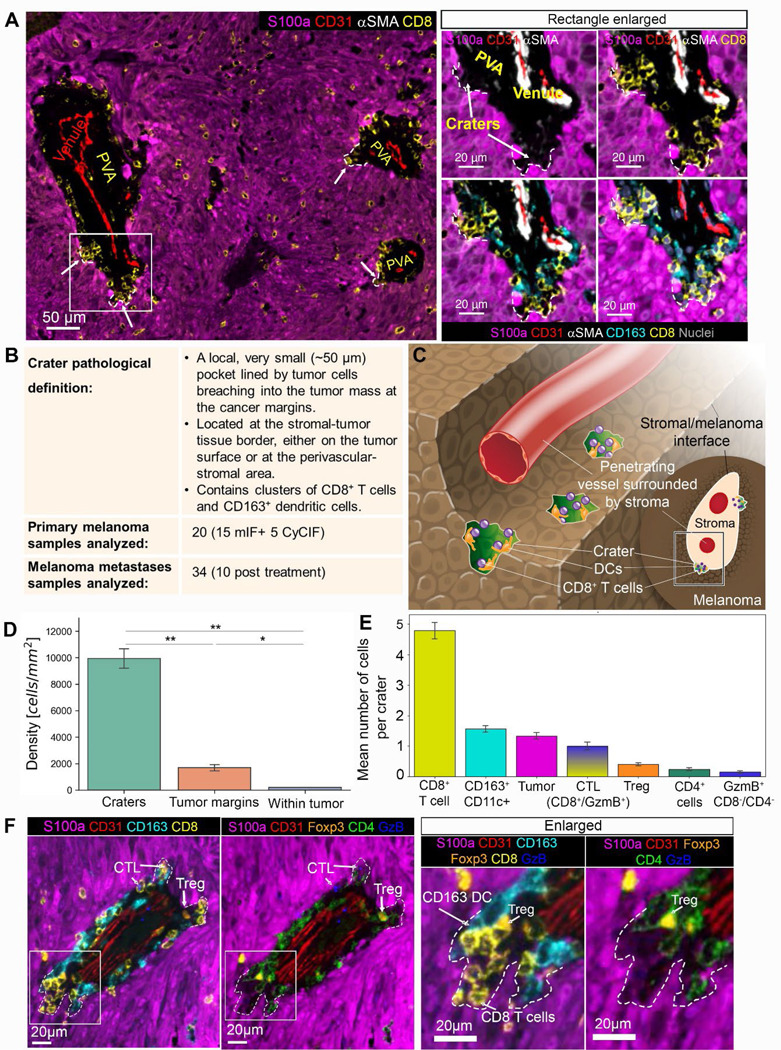
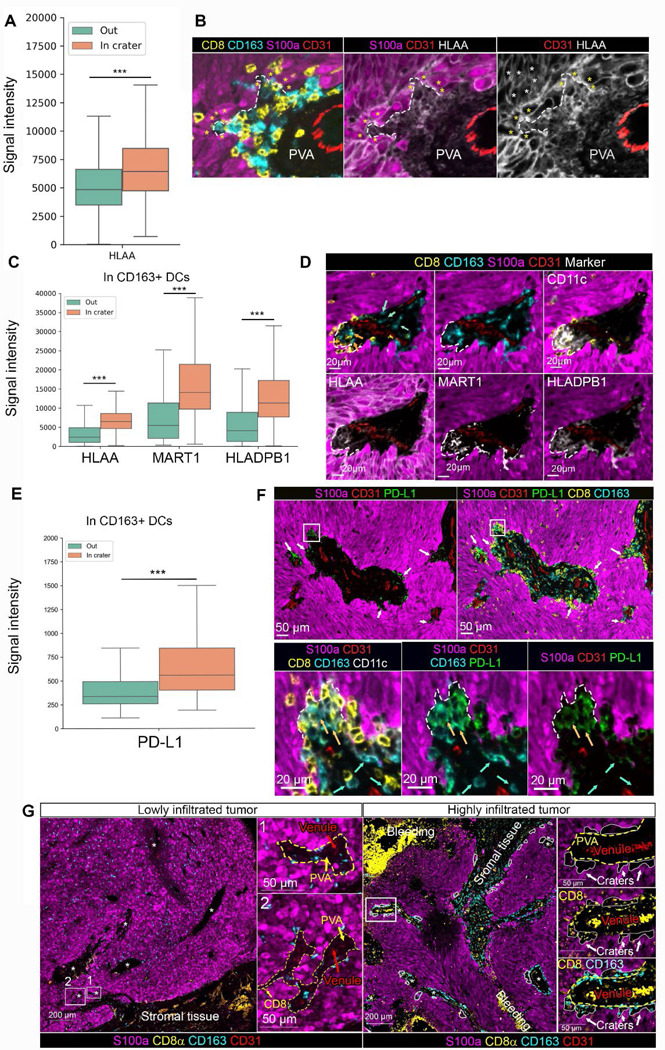
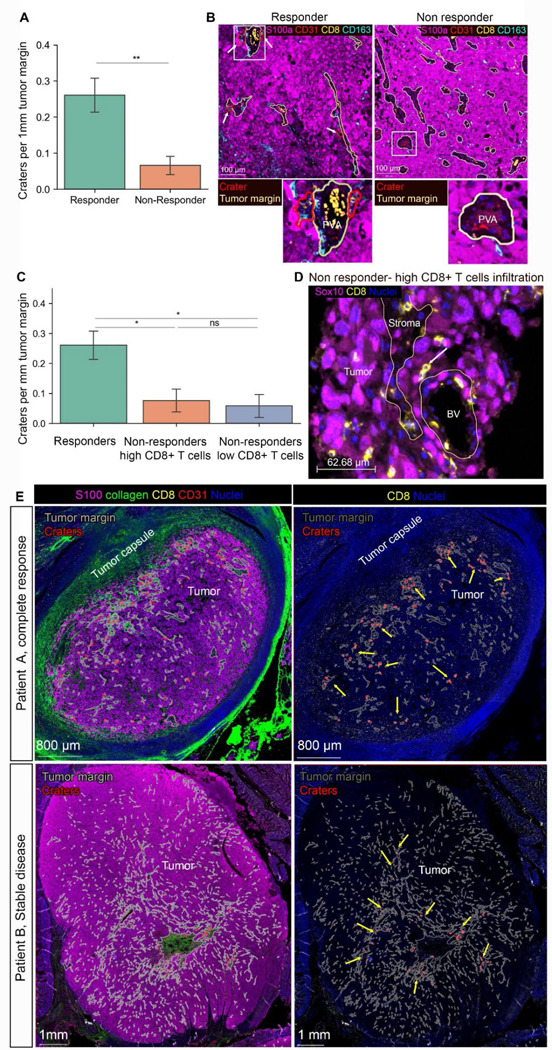
Immunotherapy leads to cancer eradication despite the tumor's immunosuppressive environment. Here, we used extended long-term in-vivo imaging and high-resolution spatial transcriptomics of endogenous melanoma in zebrafish, and multiplex imaging of human melanoma, to identify domains that facilitate immune response during immunotherapy. We identified crater-shaped pockets at the margins of zebrafish and human melanoma, rich with beta-2 microglobulin (B2M) and antigen recognition molecules. The craters harbor the highest density of CD8+ T cells in the tumor. In zebrafish, CD8+ T cells formed prolonged interactions with melanoma cells within craters, characteristic of antigen recognition. Following immunostimulatory treatment, the craters enlarged and became the major site of activated CD8+ T cell accumulation and tumor killing that was B2M dependent. In humans, craters predicted immune response to ICB therapy, showing response better than high T cell infiltration. This marks craters as potential new diagnostic tool for immunotherapy success and targets to enhance ICB response.


Conflict of interest statement

L.I.Z. is a founder and stockholder of Fate Therapeutics, CAMP4 Therapeutics, Amagma Therapeutics, Scholar Rock, and Branch Biosciences. He is a consultant for Celularity and Cellarity. JVA is on the BMS and AstraZeneca advisory board and a consultrant for MSD, Janssen. F.S.H reports grants and personal fees from Bristol-Myers Squibb, personal fees from Merck, grants and personal fees from Novartis, personal fees from Surface, personal fees from Compass Therapeutics, personal fees from Apricity, personal fees from 7 Hills Pharma, personal fees from Bicara, personal fees from Checkpoint Therapeutics, personal fees from Bioentre, personal fees from Gossamer, personal fees from Iovance, personal fees from Catalym, personal fees from Immunocore, personal fees from Kairos, personal fees from Rheos, personal fees from Zumutor, personal fees from Corner Therapeuitcs, personal fees from Puretech, personal fees from Curis, personal fees from Astra Zeneca, personal fees from Solu Therapeutics, outside the submitted work; In addition, Dr. Hodi has a patent Methods for Treating MICA-Related Disorders (#20100111973) with royalties paid, a patent Tumor antigens and uses thereof (#7250291) issued, a patent Angiopoiten-2 Biomarkers Predictive of Anti-immune checkpoint response (#20170248603) pending, a patent Compositions and Methods for Identification, Assessment, Prevention, and Treatment of Melanoma using PD-L1 Isoforms (#20160340407) pending, a patent Therapeutic peptides (#20160046716) pending, a patent Therapeutic Peptides (#20140004112) pending, a patent Therapeutic Peptides (#20170022275) pending, a patent Therapeutic Peptides (#20170008962) pending, a patent THERAPEUTIC PEPTIDES Ðherapeutic PeptidesÐatent number: 9402905 issued, a patent METHODS OF USING PEMBROLIZUMAB AND TREBANANIB pending, a patent Vaccine compositions and methods for restoring NKG2D pathway function against cancers Ðatent number: 10279021 issued, a patent Úntibodies that bind to MHC class I polypeptide-related Sequence A Ð’dÐatent number: 10106611 issued, a patent ÚNTI-GALECTIN ANTIBODY BIOMARKERS PREDICTIVE OF ANTI-IMMUNE CHECKPOINT AND ANTI-ANGIOGENESIS RESPONSES Ð’dÐublication number: 20170343552 pending, and a patent Antibodies against EDIL3 and methods of use thereof pending. JVA: Advisory board: BMS, AstraZeneca Consultant: MSD, Janssen.

Figures

Figure 1.
Figure 1.. CD8+ T cells are preferentially retained in craters, interacting with tumor cells.
(A) Longitudinal imaging of a mitfa:BFP tumor across stages of development in a (cd8a:EGFP;lck:mCherry) transgenic fish. Left: Radial growth of melanoma below the scale. T cell skin distribution remains normal. Middle: Same tumor after one week. Slightly protruding melanoma and the tessellated T cell structure is disrupted. Right: Same tumor after three weeks from initial imaging. A protruding tumor, where CD8+ T cells infiltration is evident. Enlarged- CD8+ T cells are found in areas of low mitfa expression (marked by dashed white lines). (B) 3D projection of a melanoma tumor surface in a cd8α:EGFP transgenic zebrafish (representative of over 200 tumors imaged in this study). Arrows mark CD8+ T cells, which are found in mitfa:mCherry devoid pockets, i.e. craters. (C) CD8+ cell density (cells per mm2) in crater vs. tumor area (n=5 fish. Data is mean±SE, Mann Witney U test, *p value=0.015). (D) Snapshots from time lapse imaging of the area marked by the rectangle in (B). Time is hours:minutes. A CD8+ cell interacting with a melanoma cell over a crater, then enters the crater after 6 hours. (E) Snapshots from time lapse imaging of a scale edge crater, show multiple CD8+/lck+ T cells interacting with a melanoma cell in a crater. Dashed line marks the edge of the scale. Time is hours:minutes.
Figure 2.
Figure 2.. Craters are sites of elevated B2M expression which retains CD8+ T cells in them.
(A) Left: Slide-seq gene expression map of zebrafish melanoma tumor depicting an array of cells including CD8+ T cells (large purple circle) and mitfa+ melanoma (red). Crater areas are circled in black, non-crater areas are circled in dashed black line. Right: enlarged view of the crater and non-crater areas marked by rectangles in the image on the left. (B) Volcano plot identifying differential gene expression in crater vs. non-crater associated tumor cell. B2M is circled. (C) 3D live imaging of control(intact) vs. B2M depleted mitfa:BFP tumors grown in (cd8α:EGFP/lck:mCherry) zebrafish (Mitfa color switched by Imaris to red for better visualization). Craters are marked with dashed lines. (D) The relative affinity of CD8+ T cells to craters, i.e CD8+ cell density in craters/non crater tumor surface, in control, intact B2M-and melanoma specific B2M-depleted tumors. (n=4 control, n=6 B2M CRISPR ablated. All CRISPR sequenced to verify mutation. Data is mean±SE, T test. *=p-value 0.02).
Figure 3.
Figure 3.. Activated CD8+ T cells aggregate in craters following immune stimulation by CpG ODN.
(A) 3D live imaging of mitfa:mCherry melanoma tumors in cd8α:EGFP transgenic fish after 4 daily intra-tumoral injections of vehicle (PBS and water, referred here as PBS) or CpG ODN, 24h post last injection, injected into either B2M WT or KO tumors. Arrows indicate craters. (B) Crater coverage in untreated-, PBS- CpG ODN- and tumor specific B2M ko, CpG ODN injected tumors after 4 daily injections (n=UT- 5, PBS-5, CpG ODN-5, B2M KO CpG ODN-4 fish. Data are mean±SE, Mann Whitney U test, *p value=0.031, ns=0.42). (C) CD8+ T cell density in craters vs non crater tumor surface in B2M intact (WT) and B2M tumor specific KO tumors, treated with 4 daily injections of CpG ODN (n=5 WT and n=4 B2M KO CpG ODN treated fish, Data is mean±SE, Mann Whitney U test, **p value =0.007). (D) RNA Scope for mCherry, cd8a and ifng RNA transcripts in sections from tumors treated with 4 daily injections of PBS (vehicle) or CpG ODN. Dashed white line marks the tumor surface. Yellow dashed line marks craters that are depressions in the tumor surface. Arrows indicate CD8+ cells (representatives of 3 PBS and 3 CpG ODN treated fish undergone RNA Scope analysis).
Figure 4.
Figure 4.. Craters are sites of tumor killing and are remodeled by T cells.
(A) 3D confocal images of whole mount TUNEL assay in tumors undergone 4 daily intratumorally injections with PBS or CpG ODN, showing examples of 3 craters in either PBS- or CpG ODN- or B2M KO tumor, CpG ODN treated tumors, each representative of 2 PBS and 2 CpG ODN treated fish. (B) TUNEL+ cells density in craters and non-crater tumor area (calculated using bootstrap for TUNEL+ cells. CpG ODN treated sample contained 1738 TUNEL+ cells. PBS- 176 TUNEL+cells, CpG ODN treated B2M KO tumor-460 TUNEL+ cells) (C) Crater coverage in mitfa:mCherry tumors of cd8α:EGFP (immunocompetent wild type), cd8α:EGFP;prkdc−/− or jak3−/− transgenic fish (n= 5 wt, 2 prkdc−/−, 3 jak3−/− fish. Mean± SD, T-test,*p-value (cd8a:EGFP;prkdc−/−)=0.011, *p value jak3−/−=0.01) (D) Representative 3D confocal images of mitfa:mCherry tumors in wild type cd8a:EGFP and (cd8a:EGFP;prkdc−/−) transgenic fish. Arrows indicate CD8+ T cells.
Figure 5.
Figure 5.. Craters are found in human melanoma, breaching from the tumor margins.
(A) Left: low magnification of a representative human primary nodular melanoma (CyCIF). Craters are marked by arrows and white dashed lines. Right: the area marked by the rectangle in the left image is enlarged, showing CD8+ T cells and CD163+ DCs packed together within craters (marked by arrows and white dashed lines). (B) A table summarizing the craters features and samples used in this study. (C) a graphical illustration of craters (colored green) breaching from a perivascular space into the melanoma tumor. The content of the perivascular area was omitted for clear view of the craters. (D) CD8+ T cell density in craters, tumor margins and embedded in the S100a+ tumor mass (within tumor). (n=2 tumors. Data is mean± SE, T-Test, ** p value= crater/border=0.008, crater/tumor=0.005, *p value=0.023). (E) Cellular composition of craters showing mean number of cells per crater for each cell type (n=714 craters, Mean± SE). (F) A representative crater image, showing the location of CD8+ T cells, CD163+ DCs, CD4+ cells, CD4+/FOXP3+ T regulatory cells, and CD8+/GzmB+ cytotoxic T cells at the crater area. Abbreviations: CTL=cytotoxic T cells, Treg=T regulatory cells, GzmB= granzyme B. DCs= CD11c+ dendritic cells.
Figure 6.
Figure 6.. Craters in human melanoma are sites of high antigen presentation molecules and PD-L1 expression.
(A) Boxplots plotting signal intensity distribution of HLA-A staining in S100a melanoma cells in craters compared to elsewhere in the tumor (termed, “Out”) (n=2 tumors, 714 craters, ***p value<0.001) (B) Representative image of a crater (marked by dashed white line), shown for S100a, CD8 and CD163 staining (right), HLA-A and S100a staining and HLA-A staining only to view the differentially high signal intensity in the melanoma cells lining the crater (marked by yellow asterisks) compared to the adjacent tumor cells outside the crater (white asterisks, marking a few examples). (C) Boxplots plotting signal intensity distribution of HLA-A, MART1 and HLADPB1 staining in CD163+/CD11c+ DCs in craters compared to elsewhere in the tumor (termed, “Out”) (n=2 tumors, 714 craters, ***p value<0.001) (D) Representative image of a large crater breaching out of the margins of a perivascular area, containing CD163+ DCs stained for HLA-A, MART1 and HLADPB1. (E) Boxplots plotting signal intensity distribution of PD-L1 staining in CD163+/CD11c+ DCs in craters compared to elsewhere in the tumor (“Out”) (n=2 tumors, 714 craters., ***p value<0.001). (F) Upper panel: low magnification of a tumor area showing craters as pockets with high levels of PD-L1 within them (white arrows), breaching into the tumor from the perivascular area (PVA). Lower panel: area marked by the rectangle is enlarged to show a crater (marked by dashed line) containing PD-L1 expressing CD163+/CD11c+ DCs. Blue arrows indicate CD163+/CD11c+ DCs (with low PD-L1 staining) outside the crater. Orange arrows indicate CD163+CD11c+ (PD-L1+) DCs inside the crater. (G) multiplex imaging of lowly and highly infiltrated tumors, showing lack of craters (marked by white lines) stemming from the peri-vascular areas (PVA, marked with dashed yellow line) in lowly infiltrated tumors compared to highly infiltrated tumors. Areas at the rectangles in the low magnification images to the left are enlarged at the right of each image.
Figure 7.
Figure 7.. CD8+ T cells accumulation in craters and crater density within tumors mark successful ICB therapy response.
(A) number of craters per 1mm tumor margin (which is the stromal-tumor interface) in samples of patients post ICB treatment (n= 3 responders -stable disease and complete remission, 7 non responders (progressive disease). Mean ±SE, TTest. *P value= 0.004). (B) representative images of multiplex images of a responder vs. non responder (lowly infiltrated). Peri-vascular areas are circled by yellow lines and craters are circled by red lines. Rectangle areas in the low magnification images are enlarged below each image. (C) Non responders were divided into highly infiltrated and lowly infiltrated samples (see Figure S13A for CD8+ infiltration levels, materials and methods for threshold determination). Graph showing number of craters per 1mm tumor margin in responders, non-responders with high CD8+ T cells infiltration and non-responders with low CD8+ T cells infiltration. (n= 3 responders, 3 non responders with high CD8+ T cells infiltration, 4 non responders with CD8+ T cells low infiltration. mean ±SE, TTest. P values: **= 0.0038, *=0.019). ns=0.13). (D) representative image of melanoma in a highly infiltrated sample taken from a non-responding patient. The tumor margin is marked with yellow lines. While many CD8+ T cells are evident, they infiltrate the tumor as single cells or doublets (white arrow) and very few, if any, craters are found. (E) Two samples of patients who responded to ICB in the adjuvant setting, showing regionality of crater formation within the tumor mass. Tumor margins (stromal/tumor border) are marked with grey lines. Craters are marked with red lines. Yellow arrows indicate foci of craters within the tumor mass. Patient A had a complete response and has foci of craters near the tumor border. Patient B had stable disease and had foci of craters at the middle of the tumor mass, near a large stromal area.

Similar articles

References

    1. Dobry A.S., Zogg C.K., Hodi F.S., Smith T.R., Ott P.A., and Iorgulescu J.B. (2018). Management of metastatic melanoma: improved survival in a national cohort following the approvals of checkpoint blockade immunotherapies and targeted therapies. Cancer Immunol Immunother 67, 1833–1844. 10.1007/s00262-018-2241-x. - DOI - PMC - PubMed
    1. Wolchok J.D., Chiarion-Sileni V., Gonzalez R., Grob J.J., Rutkowski P., Lao C.D., Cowey C.L., Schadendorf D., Wagstaff J., Dummer R., et al. (2022). Long-Term Outcomes With Nivolumab Plus Ipilimumab or Nivolumab Alone Versus Ipilimumab in Patients With Advanced Melanoma. J Clin Oncol 40, 127–137. 10.1200/JCO.21.02229. - DOI - PMC - PubMed
    1. Jansen C.S., Prokhnevska N., Master V.A., Sanda M.G., Carlisle J.W., Bilen M.A., Cardenas M., Wilkinson S., Lake R., Sowalsky A.G., et al. (2019). An intra-tumoral niche maintains and differentiates stem-like CD8 T cells. Nature 576, 465–470. 10.1038/s41586-019-1836-5. - DOI - PMC - PubMed
    1. Pelka K., Hofree M., Chen J.H., Sarkizova S., Pirl J.D., Jorgji V., Bejnood A., Dionne D., Ge W.H., Xu K.H., et al. (2021). Spatially organized multicellular immune hubs in human colorectal cancer. Cell 184, 4734–4752 e4720. 10.1016/j.cell.2021.08.003. - DOI - PMC - PubMed
    1. Magen A., Hamon P., Fiaschi N., Soong B.Y., Park M.D., Mattiuz R., Humblin E., Troncoso L., D’Souza D., Dawson T., et al. (2023). Intratumoral dendritic cell-CD4(+) T helper cell niches enable CD8(+) T cell differentiation following PD-1 blockade in hepatocellular carcinoma. Nat Med 29, 1389–1399. 10.1038/s41591-023-02345-0. - DOI - PMC - PubMed

References for methods:

    1. Lawson N.D., and Weinstein B.M. (2002). In vivo imaging of embryonic vascular development using transgenic zebrafish. Dev Biol 248, 307–318. 10.1006/dbio.2002.0711. - DOI - PubMed
    1. Covassin L.D., Siekmann A.F., Kacergis M.C., Laver E., Moore J.C., Villefranc J.A., Weinstein B.M., and Lawson N.D. (2009). A genetic screen for vascular mutants in zebrafish reveals dynamic roles for Vegf/Plcg1 signaling during artery development. Dev Biol 329, 212–226. 10.1016/j.ydbio.2009.02.031. - DOI - PMC - PubMed
    1. Patton E.E., Widlund H.R., Kutok J.L., Kopani K.R., Amatruda J.F., Murphey R.D., Berghmans S., Mayhall E.A., Traver D., Fletcher C.D., et al. (2005). BRAF mutations are sufficient to promote nevi formation and cooperate with p53 in the genesis of melanoma. Curr Biol 15, 249–254. 10.1016/j.cub.2005.01.031. - DOI - PubMed
    1. Langenau D.M., Ferrando A.A., Traver D., Kutok J.L., Hezel J.P., Kanki J.P., Zon L.I., Look A.T., and Trede N.S. (2004). In vivo tracking of T cell development, ablation, and engraftment in transgenic zebrafish. Proc Natl Acad Sci U S A 101, 7369–7374. 10.1073/pnas.0402248101. - DOI - PMC - PubMed
    1. White R.M., Sessa A., Burke C., Bowman T., LeBlanc J., Ceol C., Bourque C., Dovey M., Goessling W., Burns C.E., and Zon L.I. (2008). Transparent adult zebrafish as a tool for in vivo transplantation analysis. Cell Stem Cell 2, 183–189. 10.1016/j.stem.2007.11.002. - DOI - PMC - PubMed

Publication types