[Preprint]. 2024 Oct 31:2024.09.16.613345.
doi: 10.1101/2024.09.16.613345.

TIRTL-seq: Deep, quantitative, and affordable paired TCR repertoire sequencing

Affiliations

TIRTL-seq: Deep, quantitative, and affordable paired TCR repertoire sequencing

Mikhail V Pogorelyy et al. bioRxiv. .

Abstract

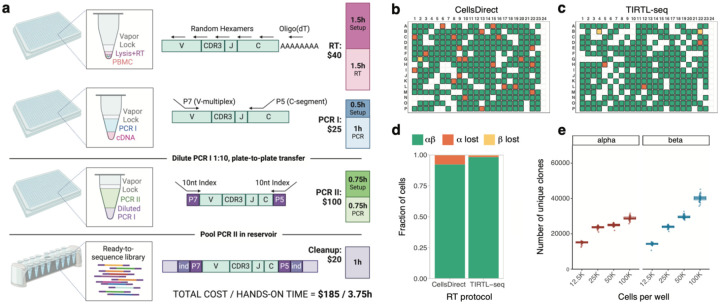
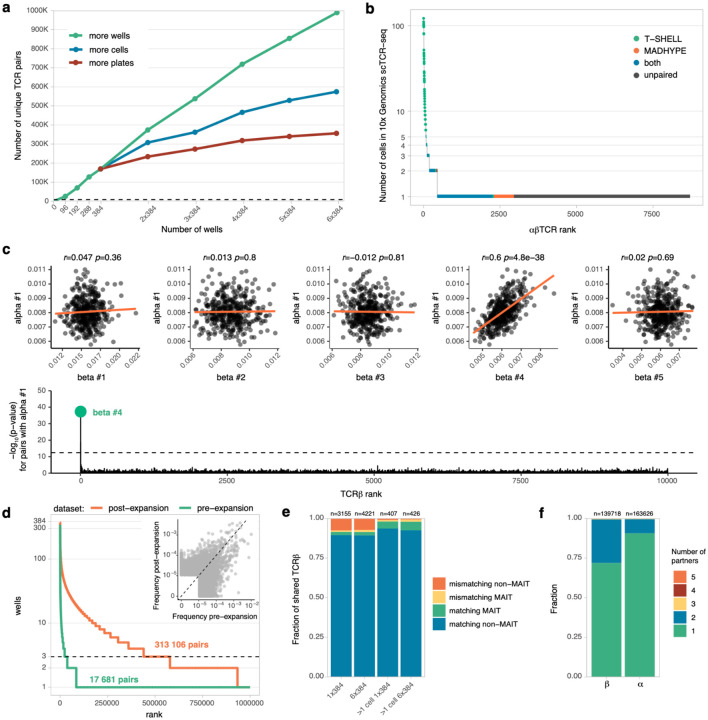
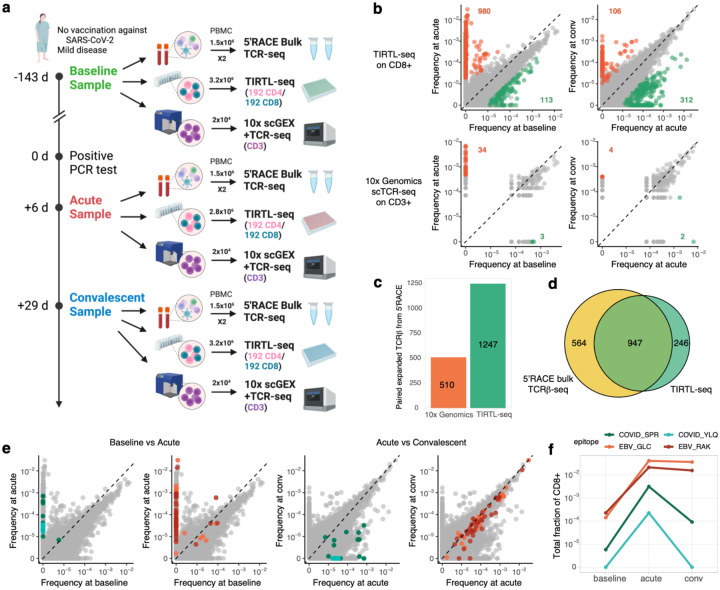
ɑ/β T cells are key players in adaptive immunity. The specificity of T cells is determined by the sequences of the hypervariable T cell receptor (TCR) ɑ and β chains. Although bulk TCR sequencing offers a cost-effective approach for in-depth TCR repertoire profiling, it does not provide chain pairings, which are essential for determining T cell specificity. In contrast, single-cell TCR sequencing technologies produce paired chain data, but are limited in throughput to thousands of cells and are cost-prohibitive for cohort-scale studies. Here, we present TIRTL-seq (Throughput-Intensive Rapid TCR Library sequencing), a novel approach that generates ready-to-sequence TCR libraries from live cells in less than 7 hours. The protocol is optimized for use with non-contact liquid handlers in an automation-friendly 384-well plate format. Reaction volume miniaturization reduces library preparation costs to <$0.50 per well. The core principle of TIRTL-seq is the parallel generation of hundreds of libraries providing multiple biological replicates from a single sample that allows precise inference of both frequencies of individual clones and TCR chain pairings from well-occurrence patterns. We demonstrate scalability of our approach up to 1 million unique paired αβTCR clonotypes corresponding to over 30 million T cells per sample at a cost of less than $2000. For a sample of 10 million cells the cost is ~$200. We benchmarked TIRTL-seq against state-of-the-art 5'RACE bulk TCR-seq and 10x Genomics Chromium technologies on longitudinal samples. We show that TIRTL-seq is able to quantitatively identify expanding and contracting clonotypes between timepoints while providing accurate TCR chain pairings, including distinct temporal dynamics of SARS-CoV-2-specific and EBV-specific CD8+ T cell responses after infection. While clonal expansion was followed by sharp contraction for SARS-CoV-2 specific TCRs, EBV-specific TCRs remained stable once established. The sequences of both ɑ and β TCR chains are essential for determining T cell specificity. As the field moves towards greater applications in diagnostics and immunotherapy that rely on TCR specificity, we anticipate that our scalable paired TCR sequencing methodology will be instrumental for collecting large paired-chain datasets and ultimately extracting therapeutically relevant information from the TCR repertoire.


Figures

Figure 1.
Figure 1.
a. Schematic of TIRTL-seq protocol. Briefly, a cell suspension is distributed into 384-well plates containing RT/lysis mastermix under a hydrophobic overlay using non-contact liquid dispensers. After the RT reaction, PCR I mastermix with V-segment and C-segment primers is dispensed into the same plate. The PCR I product is then diluted and transferred to the PCR II plate for indexing PCR with well-specific unique dual indices. The PCR II products are pooled by centrifugation, purified, size-selected using magnetic beads, and sequenced on an Illumina platform. Total library preparation cost is listed for one 384-well plate. b. CellsDirect vs c. TIRTL-seq (Maxima H-based) sensitivity on single sorted T cells. Green: both TCRɑ and TCRβ identified; orange: TCRɑ lost; yellow: TCRβ lost; blank: no cell present. Column 24 is a negative control (no cells sorted). d. Relative fraction of cells with both TCRɑ and TCRβ identified (green), lost TCRɑ chain (orange), and lost TCRβ chain (yellow) shown for Invitrogen CellsDirect RT protocol (left) and TIRTL-seq protocol (right). e. TIRTL-seq shows robustness to an increasing number of PBMCs. Number of unique clonotypes detected from each well (y-axis) plotted for different numbers of cells per well (x-axis) for the TIRTL-seq protocol.
Figure 2.
Figure 2.
a. TIRTL-seq scaling with different analysis methods. The total number of unique paired αβTCRs recovered (y-axis) is plotted using three distinct analytical approaches: increasing the number of individual plates analyzed (more plates, red), increasing the number of cells per well analyzed (more cells, blue), or increasing the number of total wells analyzed (more wells, green). b. Clone-size distribution of paired and unpaired (dark gray) clones by TIRTL-seq. Paired αβTCRs from a 10x Genomics scTCR-seq experiment are ordered by the number of cells with a clonotype (y axis, log scale), while the x-axis shows the clone rank. Each color indicates overlap between 10x Genomics scTCR-seq and αβTCRs called by MAD-HYPE (orange), T-SHELL (green) or both (blue). Dark gray indicates lack of pairing in TIRTL-seq compared to 10X Genomics scTCR-seq. c. T-SHELL algorithm pairs TCR chain through frequency correlation. top: Correlation of relative per well frequencies of largest TCRɑ #1 and top 5 largest TCRβs in the repertoire, red line shows linear fit. bottom: Manhattan plot for p-values for pairing of TCRɑ #1 to 10 000 most abundant TCRβs. Dotted line shows p-value cutoff after Bonferroni multiple testing adjustment. d. T cell expansion increases pairing efficiency. T cell clone frequency (y-axis) is plotted against rank (x-axis). The dotted line shows the minimal 3-well occurrence threshold for ɑ/β chain pairing by TIRTL-Seq. An increased number of clones clearing the threshold after expansion (orange curve) results in more called pairs compared to pre-expansion (green curve). Inset shows clonal frequency distortion after antigen-independent T cell expansion. Clonal frequency pre-expansion (x-axis) is plotted against clonal frequency post-expansion (y-axis). e. Fraction of TCRβs overlapping between 10X Genomics scTCR-seq (filtered or unfiltered for clones with > 1 cell) and TIRTL-seq experiments (x-axis) with matching or mismatching TCRɑ for MAIT and non-MAIT clones. f. Fraction of clonotypes with a given chain (ɑ or β) paired with one or more partner chains (TIRTL-seq data from one 384-well plate experiment).
Figure 3.
Figure 3.
a. Longitudinal sampling of a donor with SARS-CoV-2 infection. b. (top) TIRTL-seq identifies expansions and contractions in the CD8+ T cell repertoire. (bottom): 10x Genomics scTCR-seq clonal frequency from the same time points. c. Number of expanded (from baseline to acute) clonotypes from an independent bulk TCRβ sequencing experiment paired using 10x Genomics scTCR-seq and TIRTL-seq. d. Overlap between expanded clonotypes from independent bulk TCRβ sequencing (yellow) experiments and TIRTL-seq expanded clones (green, CD4 and CD8 combined). e. Colored dots show clonotypes matching known TCRs specific for A*02 YLQ (cyan) and B*07 SPR COVID epitopes (green) and A*02 GLC (orange) and B*07 RAK EBV epitopes (red) on pairwise time point comparisons. f. Cumulative frequency of CD8+ clones specific to A*02 YLQ (cyan) and B*07 SPR COVID epitopes (green) and A*02 GLC (orange) and B*07 RAK EBV epitopes (red) across time points.

References

    1. Akondy Rama S., Monson Nathan D., Miller Joseph D., Edupuganti Srilatha, Teuwen Dirk, Wu Hong, Quyyumi Farah, et al. 2009. “The Yellow Fever Virus Vaccine Induces a Broad and Polyfunctional Human Memory CD8+ T Cell Response.” Journal of Immunology (Baltimore, Md.: 1950) 183 (12): 7919–30. 10.4049/jimmunol.0803903. - DOI - PMC - PubMed
    1. Birnbaum Michael E., Mendoza Juan L., Sethi Dhruv K., Dong Shen, Glanville Jacob, Dobbins Jessica, Özkan Engin, Davis Mark M., Wucherpfennig Kai W., and Garcia K. Christopher. 2014. “Deconstructing the Peptide-MHC Specificity of T Cell Recognition.” Cell 157 (5): 1073–87. 10.1016/j.cell.2014.03.047. - DOI - PMC - PubMed
    1. Bolotin Dmitriy A., Poslavsky Stanislav, Mitrophanov Igor, Shugay Mikhail, Mamedov Ilgar Z., Putintseva Ekaterina V., and Chudakov Dmitriy M.. 2015. “MiXCR: Software for Comprehensive Adaptive Immunity Profiling.” Nature Methods 12 (5): 380–81. 10.1038/nmeth.3364. - DOI - PubMed
    1. Carlson Christopher S., Emerson Ryan O., Sherwood Anna M., Desmarais Cindy, Chung Moon-Wook, Parsons Joseph M., Steen Michelle S., et al. 2013. “Using Synthetic Templates to Design an Unbiased Multiplex PCR Assay.” Nature Communications 4 (1): 2680. 10.1038/ncomms3680. - DOI - PubMed
    1. Dash Pradyot, Fiore-Gartland Andrew J., Hertz Tomer, Wang George C., Sharma Shalini, Souquette Aisha, Crawford Jeremy Chase, et al. 2017. “Quantifiable Predictive Features Define Epitope-Specific T Cell Receptor Repertoires.” Nature 547 (7661): 89–93. 10.1038/nature22383. - DOI - PMC - PubMed

Publication types