[Preprint]. 2024 Sep 21:2024.09.20.614128.
doi: 10.1101/2024.09.20.614128.

Abstinence from cocaine self-administration promotes microglia pruning of astrocytes which drives cocaine-seeking behavior

Affiliations

Abstinence from cocaine self-administration promotes microglia pruning of astrocytes which drives cocaine-seeking behavior

Anze Testen et al. bioRxiv. .

Update in

Abstract

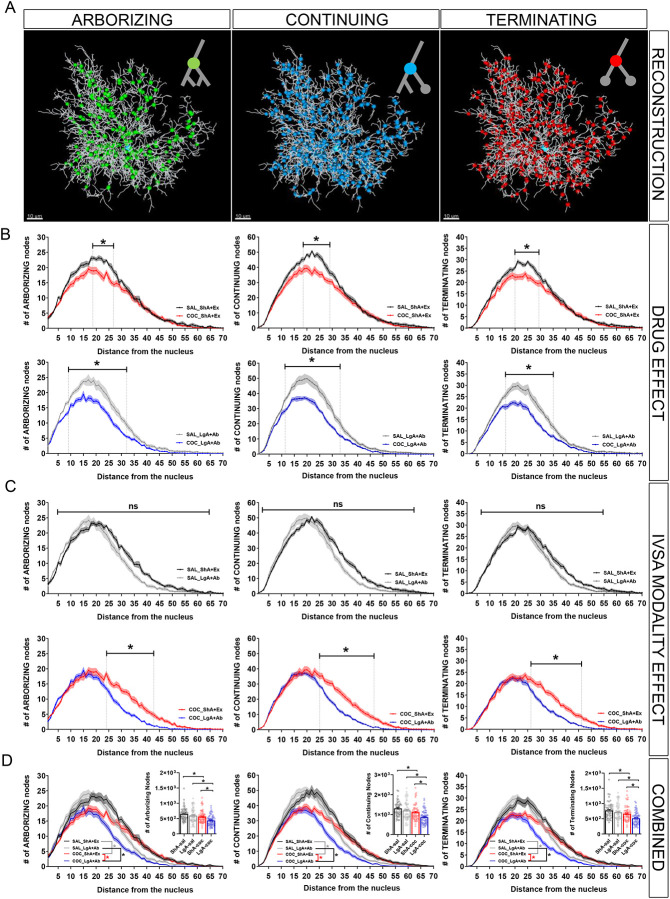
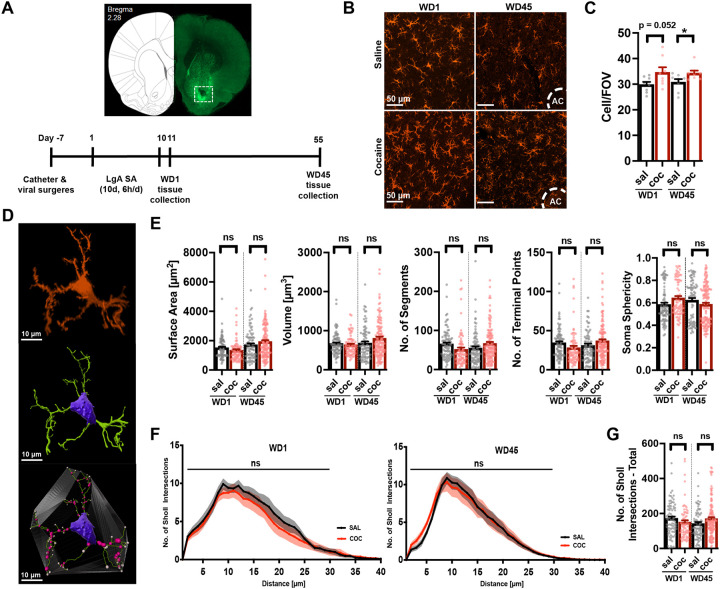
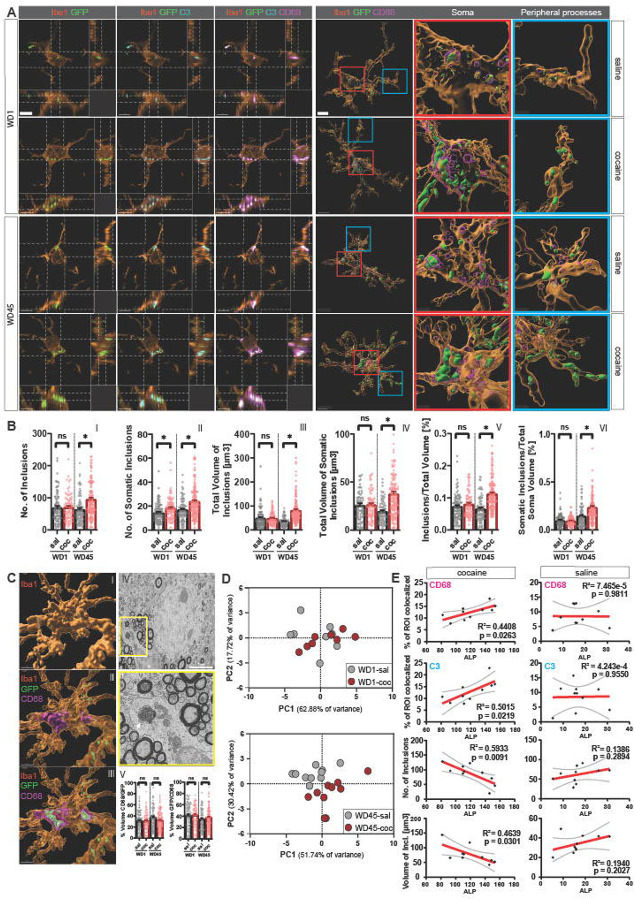
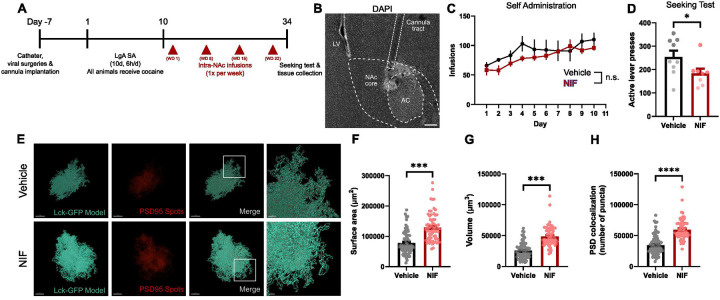
Rodent drug self-administration leads to compromised ability of astrocytes to maintain glutamate homeostasis within the brain's reward circuitry, as well as reductions in surface area, volume, and synaptic colocalization of astrocyte membranes. However, the mechanisms driving astrocyte responses to cocaine are unknown. Here, we report that long-access cocaine self-administration followed by prolonged home cage abstinence results in decreased branching complexity of nucleus accumbens astrocytes, characterized by the loss of peripheral processes. Using a combination of confocal fluorescence microcopy and immuno-gold electron microscopy, we show that alterations in astrocyte structural features are driven by microglia phagocytosis, as labeled astrocyte membranes are found within microglia phagolysosomes. Inhibition of complement C3-mediated phagocytosis using the neutrophil inhibitory peptide (NIF) rescued astrocyte structure and decreased cocaine seeking behavior following cocaine self-administration and abstinence. Collectively, these results provide evidence for microglia pruning of accumbens astrocytes across cocaine abstinence which mediates cocaine craving.

Keywords: astrocytes; cocaine; drug seeking; microglia; nucleus accumbens; phagocytosis; relapse.


Conflict of interest statement

Declaration of interests: The authors declare no competing interests.

Figures

Figure 1.
Figure 1.
Cocaine induced atrophic phenotype of accumbal astrocytes is characterized by decreased structural complexity. (A) Timelines for each self-administration paradigm (B) 3- dimensional reconstructions of isolated masks of Lck-GFP positive astrocytes (left) were used for filament tracing to construct wire models of each astrocyte (middle) to be used for Sholl analysis (right). Scale bar: 20μm (C) Sholl intersections from all 4 groups plotted as a function of distance from the nucleus. Three-way interaction (distance × paradigm × drug: F(93, 2604) = 1.334, p=0.0194); two-way interactions (distance × paradigm: F(93, 2604) = 10.960, p<0.0001, distance × drug: F(93, 2604) = 9.383, p<0.0001). Three-way RM ANOVA. Asterixis signifies statistically significant group difference confirmed with 2-way RM ANOVA (expanded on in E and F). (D) The total number of Sholl intersections (left; F(3, 28)=9.111, p=0.0002), the peak intersections (maximum intersection value) (middle; F(3, 28)=5.342, p=0.0049)) and the distance at the peak complexity (right; F(3, 28)=4.908, p=0.0025) are all decreased in LgA-coc group. Each data point represents an analyzed cell (nested factor). One-way nested ANOVA with Tukey post-hoc test. (E) Sholl intersections, plotted as a function of distance for both behavioral paradigms separately and their respective AUC. Larger decrease in astrocyte complexity observed for the cocaine group with the LgA paradigm (bottom; main effect of the drug: F(1, 14)=20.62, p=0.0005; AUC: p<0.0001) then with the ShA group (top; main effect of the drug: F(1, 14)=1.802, p=0.2009; AUC: P=0.0079). 2-way RM ANOVA with Bonferroni post-hoc test (distance plots) and two-tailed unpaired t-test (AUC). (F) Sholl intersections, plotted as a function of distance for both drug conditions separately and their respective AUC. No effect of the self-administration paradigm on the saline control groups (top; main effect of the paradigm: F(1, 13)=0.1677, p=0.6888; AUC: p=0.03682) while LgA-coc shows more decrease in complexity compared to ShA-coc (bottom; main effect of the paradigm: F(1, 15)=9.734, p=0.0070; AUC: p<0.001). Two-way RM ANOVA with Bonferroni post-hoc test (distance plots) and two-tailed unpaired t-test (AUC). ns=not significant. Data are represented as mean +/− SEM. Significance was set at p<0.05. Group sizes: ShA-sal: N=7, n=6–9; ShAcoc: N=9, n=8; LgA-sal: N=8, n=8–11; LgA-coc: N=8, n=8–10 (N=number of animals, n=number of cells per animal). Detailed statistics for all the interactions in three- and two-way ANOVA reported in supp. Stats. Table #1. All group comparisons for the one-way nested ANOVA reported in the supp. Stats. Table #2.
Figure 2.
Figure 2.
Cocaine-induced decrease in structural complexity of accumbal astrocytes results from decreased branching of peripheral processes. (A) Wire model of astrocyte processes showing arborizing (left), continuing (middle) and terminating (right) bifurcation nodes. Scale bar: 10μm (B) Number of bifurcations, plotted as a function of distance for both behavioral paradigms separately. ShA (top) (arborizing (left) - main effect of the drug: F(1, 14)=5.391, p=0.0358; continuing (middle) - main effect of the drug: F(1, 14)=6.072, p=0.0273; terminating (right) - main effect of the drug: F(1, 14)=7.529, p=0.0158). LgA (bottom) (arborizing (left) - main effect of the drug: F(1, 14)=19.20, p=0.0006; continuing (middle) - main effect of the drug: F(1, 14)=22.02, p=0.0003; terminating (right) - main effect of the drug: F(1, 14)=18.48, P=0.0007). Two-way RM ANOVA with Bonferroni post-hoc test. (C) Number of bifurcations, plotted as a function of distance for drug conditions separately. Saline (top) (arborizing (left) - main effect of the paradigm: F(1, 13)=2.343, p=0.1498; continuing (middle) - main effect of the paradigm: F(1, 13)=2.326, p=0.1512; terminating (right) - main effect of the paradigm: F(1, 13)=3.794, p=0.0734). Cocaine (bottom) (arborizing (left) - main effect of the paradigm: F(1, 15)=10.87, p=0.0049; continuing (middle) - main effect of the paradigm: F(1, 15)=11.31, p=0.0043; terminating (right) - main effect of the paradigm: F(1, 15)=10.71, p=0.0051). Two-way RM ANOVA with Bonferroni post-hoc test. ns=not significant. (D) Type-specific bifurcations of all 4 groups plotted together as a function of distance. Arborizing (left) – distance × paradigm: F(91, 2548)=9.709, p<0.0001; distance × drug: F(91, 2548)=8.143, p<0.0001. Continuing (middle) - distance × paradigm: F(91, 2548)=9.772, p<0.0001; distance × drug: F(91, 2548)=10.330, p<0.0001. Terminating (right) - distance × paradigm: F(91, 2548)=6.510, p<0.0001; distance × drug: F(91, 2548)=9.617, p<0.0001. Three-way RM ANOVA. Asterixis signifies statistically significant group difference confirmed with two-way RM ANOVA. Panel inserts (total number of type-specific bifurcations): arborizing (left) – F(3, 28)=9.607, p=0.0002; continuing (middle) – F(3, 28)=10.10, p=0.0001; terminating (right) – F(3, 28)=9.093, p=0.0002. One-way nested ANOVA with Tukey post-hoc test. Data are represented as mean +/− SEM. Significance was set at p<0.05. Group sizes: ShA-sal: N=7, n=6–9; ShAcoc: N=9, n=8; LgA-sal: N=8, n=8–11; LgA-coc: N=8, n=8–10 (N=number of animals, n=number of cells per animal). Detailed statistics for all the interactions in three- and two-way ANOVA reported in supp. Stats. Table #1. All group comparisons for the one-way nested ANOVA reported in the supp. Stats. Table #2.
Figure 3.
Figure 3.
The cocaine-induced decrease in branching of accumbal astrocytes is a result of a loss of peripheral astrocyte processes. (A) Wire model of reconstructed astrocyte showing terminal points of most peripheral segments (a proxy for PAPs). Scale bar: 10μm (B) Total number PAPs for all groups (F(3, 28)=9.297, p=0.0002). One-way nested ANOVA with Tukey posthoc test. (C) Number of PAPs for all 4 groups plotted as a function of distance from the nucleus (distance × paradigm: F(91, 2548)=8.012, p<0.0001; distance × drug: F(91, 2548)=9.953, p<0.0001). 3-way RM ANOVA. Asterixis signifies statistically significant group difference confirmed with 2-way RM ANOVA. (D) Number of PAPs, plotted as a function of distance for both behavioral paradigms separately (ShA (left) - main effect of the drug: F(1, 14)=5.287, p=0.0374; LgA (right) - main effect of the drug: F(1, 14)=19.71, p=0.0006). Two-way RM ANOVA with Bonferroni post-hoc test. (E) Number of PAPs, plotted as a function of distance for both drug conditions separately (saline (left) - main effect of the paradigm: F(1, 13)=1.842, p=0.1978; cocaine (right) - main effect of the paradigm: F(1, 15)=10.80, p=0.0050). 2-way RM ANOVA with Bonferroni post-hoc test. ns = not significant (F) A complete wire model of an isolated astrocyte, used to measure the combined length of the filament and count its segments (Insert: a single segment; defined as a part of the filament between two bifurcation nodes). Scale bar: 5μm (G) Total length of the filament (F(3, 28)=12.19, p<0.0001), number of segments (F(3, 28)=9.626, p=0.0002) and average length of the segments (F(3, 28)=0.4517, p=0.7181) for all groups. One-way nested ANOVA with Tukey post-hoc test. ns = not significant (H) Principle component analysis of all the measured astrocyte complexity parameters shows clear separation and clustering between the cocaine and saline groups for LgA (bottom), with the PC1 contributing to the separation of the groups (PC1: POV=83.06%, Eigenvalue=9.137; PC2: POV=9.56%, Eigenvalue=1.052; PCR (ALP): F(2, 13)=10.14, P=0.0022) while in the ShA paradigm (top), the separation is not clear (PC1: POV=71.32%, Eigenvalue=7.846; PC2: POV=17.33%, Eigenvalue=1.906; PCR (ALP): F(2, 13)=2.837, p=0.0949). PCs used in PCR selected by the Keiser rule. (I) Regression analysis for the LgA-coc group, showing correlation between the number of active lever presses (ALP) during SA and most relevant complexity parameters of astrocytes: number of segments (left - R2=0.6734, F(1, 6)=12.37, p=0.0126), number of PAPs (middle - R2=0.6720, F(1, 6)=12.29, p=0.0127) and the total number of all bifurcations nodes (right - R2=0.6736, F(1, 6)=12.38, p=0.0125). Plotted as a simple linear regression with the 95% confidence interval. (J) Simple liner regression analysis for the LgA-sal group, showing the lack of correlation between active lever presses (ALP) during SA and most relevant complexity parameters of astrocytes: number of segments (R2=0.4482, F(1, 6)=4.841, p=0.0694), number of PAPs (R2=0.4466, F(1, 6)=4.841, p=0.0701) and the total number of all bifurcations nodes (R2=0.4508, F(1, 6)=4.925, p=0.0683). Plotted as a simple linear regression with the 95% confidence interval. Plotted as a simple linear regression with the 95% confidence interval. Data are represented as mean +/− SEM. Significance was set at p<0.05. Group sizes: ShA-sal: N=7, n=6–9; ShA-coc: N=9, n=8; LgA-sal: N=8, n=8–11; LgA-coc: N=8, n=8–10 (N=number of animals, n=number of cells per animal). Detailed statistics for all the interactions in three- and two-way ANOVA reported in supp. Stats. Table #1. All group comparisons for the one-way nested ANOVA reported in the supp. Stats. Table #2. See SF2 for PCA analysis loadings, biplots and full POV.
Figure 4.
Figure 4.
There were no detected microglia morphological changes at WD1 or WD45 following LgA cocaine self-administration. There was a significant increase in the number of microglia in the nucleus accumbens at both time points. (A) Whole-brain slice showing the nucleus accumbens, with expression of AAV5-GfaABC1D-Lck-GFP (top). Microglia were examined from within the white square. Timeline of self-administration and tissue collection points for microglia analysis (bottom). (B) Microglial cells were counted at WD1 and WD45. The images on the right depict 20x representative fields of view (FOV) images of Iba1-stained microglia. (C) Cell counts were measured at each time point by looking at cell/FOV. WD1 sal vs. coc F(1, 14)=2.115, p=0.0528; WD45 sal vs. coc F(1, 14)=2.272, p= 0.0394. (D) Individual microglial cell stained with Iba1 (top). 3-dimensional reconstruction of the same cell using Bitplane Imaris Software showing the soma in purple and reconstruction of processes in green (middle). The reconstructed cell shows branch points (magenta) and terminal points (white) (bottom). (E) Microglial morphometric measurements were collected, and a few chosen graphs are shown from left to right: Surface area, volume, number of segments, number of terminal points, and soma sphericity. Surface area: sal vs. coc, WD1: F(1, 14)=0.8313, p=0.4197; WD45:F(1, 18)=0.06991, p=0.9450. Volume: sal vs. coc, WD1: F(1, 14)=0.5609, p=0.5837; WD45: F(1, 18)=0.1614, p=0.8736. Number of segments sal vs. coc, WD1: F(1, 14)=1.017, p=0.3265; WD45 F(1, 18)=0.5116, p=0.6152. Number of terminal points sal vs. coc, WD1: F(1, 14)=0.9016, p= 0.3825; WD45 F(1, 18)=0.4314, p= 0.6713. Soma sphericity: sal vs. coc, WD1: F(1, 14)=1.735, p= 0.2089; WD45 F(1, 18)=0.9626, p= 0.3485. (F) Sholl analysis was also conducted with shown graphs of WD1 and WD45. (G) The accompanying quantification for sholl analysis is shown in the graph depicted by total number of sholl intersections. * p < 0.05 between groups, all error bars are standard error of the mean (SEM). Data are represented as mean +/− SEM. Significance was set at P<0.05. Group sizes: WD1-sal: N=8, n=8–14; WD1-coc: N=8, n=7–17; WD45-sal: N=10, n=4–14; WD45-coc: N=10, n=4–26 (N=number of animals, n=number of cells per animal).
Figure 5.
Figure 5.
Cocaine SA and withdrawal leads to increased astrocytes-microglia interactions (A) Representative images of isolated microglia (Iba1) from two SA paradigms, microglia-associated astrocyte processes (Lck-GFP) as well as microglia-colocalized CD68 and C3 signal. (B) Colocalization analysis for Iba1/CD68 (top – WD1: F(1, 14)=0.6292, p=0.4409; WD45: F(1, 18)=7.215, p=0.0151), Iba1/Lck-GFP (middle – WD1: F(1, 14)=1.950, p=0.1844; WD45: F(1, 18)=13.98, p=0.0015) and Iba1/C3 (bottom – WD1: F(1, 14)=0.9589, p=0.3441; WD45: F(1, 18)=5.242, p=0.0343). Two-tailed nested t-test. ns = not significant Data are represented as mean +/− SEM. Significance was set at p<0.05. Group sizes: WD1-sal: N=8, n=8–14; WD1-coc: N=8, n=7–17; WD45-sal: N=10, n=4–14; WD45-coc: N=10, n=4–26 (N=number of animals, n=number of cells per animal).
Figure 6.
Figure 6.
Increase in the microglia-PAPs colocalization following cocaine SA and prolonged abstinence is a result of microglial phagocytosis of PAPs FOV size. (A) Orthogonal projections of isolated microglia showing Iba1/Lck-GFP, Iba1/Lck-GFP/C3 and Iba1/Lck-GFP/C3/CD68 colocalization, respectively (right). The same isolated microglia, 3-D reconstructed with transparent surface, showing that colocalized GFP and CD68 signals are located inside the microglial cytoplasm and not merely colocalized with the cell surface/membrane. CD68- and GFP-positive microglial inclusions can be found in soma (red boxes) as well as in the peripheral microglial processes (blue boxes). (B) The number of total GFP-positive inclusions per microglia (I – WD1: F(1, 14)=0.0294, p=0.8663; WD45: F(1, 18)=6.076, p=0.0240), the number of GFP-positive inclusions per microglial soma ((II – WD1: F(1, 14)=5.970, p=0.0284; WD45: F(1, 18)=4.837, p=0.0412), total volume of GFP-positive inclusions per microglia (III – WD1: F(1, 14)=0.0133, p=0.9098; WD45: F(1, 18)=17.26, p=0.0006), total volume of GFP-positive inclusions per microglial soma (IV – WD1: F(1, 14)=0.1626, p=0.6928; WD45: F(1, 18)=14.61, p=0.0012), percentage of the total microglia volume occupied by the GFP-positive inclusions (V – WD1: F(1, 14)=1.067, p=0.3192; WD45: F(1, 18)=16.00, p=0.0008) and percentage of the total microglia soma volume occupied by the somatic GFP-positive inclusions (VI – WD1: F(1, 14)=0.0002, p=0.9890; WD45: F(1, 18)=35.01, p=0.001. Two-tailed nested t-test. ns = not significant (C) 3-dimensional reconstruction of a representative microglia (WD45-coc group) showing opaque surface of the soma and primary microglial processes (I). The same reconstruction with transparent surface, showing CD68-positive phagosome with opaque surface inside microglial soma (II). The same reconstruction with the transparent surface of the CD68-postive phagosome, showing GFP-positive astrocyte inclusions inside microglial phagosome (III). Scale bar. SBF-TEM micrography of a microglial phagosome showing GFPpositive inclusion (IV) Percentage of volume of all CD68-positive astrocyte inclusions versus total volume of GFP-positive astrocyte inclusions (left – WD1: F(1, 14)=0.7203, p=0.7203; WD45: F(1, 18)=1.389, p=0.2540) and a percentage of CD68-positive phagosome volume filed with Lck-GFP-positive inclusions versus total CD68-positive phagosome volume (right - WD1: F(1, 14)=0.2229, p=0.6441; WD45: F(1, 18)=0.5687, p=0.4605) (V). Two-tailed nested t-test. ns = not significant (D) Principle component analysis of all the measured microglial astrocyte-derived inclusion parameters shows clear separation and clustering between the cocaine and saline groups for the WD45 group (bottom), with both PCs contributing to the separation of the groups (PC1: POV=51.74%, Eigenvalue=5.691; PC2: POV=30.42%, Eigenvalue=3.346; PCR (infusions): F(2, 17)=17.47, p<0.0001) while at the WD1 timepoint (top), the separation is not clear (PC1: POV=62.88%, Eigenvalue=6.916; PC2: POV=17.72%, Eigenvalue=1.949; PCR not performed). PCs used in PCR selected by the Keiser rule. (E) Linear regression analysis for the WD45-cocaine group (left), showing correlation between the number of active lever presses (ALP) during SA and astrocyte inclusion-related parameters of microglia: CD68/Iba1 colocalization (R2=0.4804, F(1, 8)=7.397, p=0.0263), and C3/Iba1 colocalization (R2=0.5015, F(1, 8)=8.049, p=0.0219) positively correlated to ALP (top), while the total number of astrocyte-derived inclusions (R2=0.5933, F(1, 8)=11.670, p=0.0091) and the total volume of inclusions (R2=0.4639, F(1, 8)=6.922, p=0.0301) were correlated inversely (bottom). None of the inclusion measurements were correlated in the WD45-saline group (right): CD68/Iba1 colocalization (R2=7.465×10⁻⁵, F(1, 8)=0.0006, p=0.9811), C3/Iba1 colocalization (R2=0.0004, F(1, 8)=0.0033, p=0.9550, the total number of astrocytederived inclusions (R2=0.1386, F(1, 8)=1.287, p=0.2894), the total volume of inclusions (R2=0.1940, F(1, 8)=1.925, p=0.2027). Plotted as a simple linear regression with the 95% confidence interval. Data are represented as mean +/− SEM. Significance was set at p<0.05. Group sizes: WD1-sal: N=8, n=8–14; WD1-coc: N=8, n=7–17; WD45-sal: N=10, n=4–14; WD45-coc: N=10, n=4–26 (N=number of animals, n=number of cells per animal).
Figure 7.
Figure 7.
Blocking microglia-mediated astrocyte pruning restores astrocytic synaptic coverage and decreases cocaine seeking (A) Timeline for self-administration and intra-NAc NIF infusions (B) Representative image of the NAc core showing location of cannula placement. Scale bar: 100 μm (C) The number of cocaine infusions across 10 days of LgA self-administration, showing no difference between groups (main effect of treatment: F(1, 15) = 1.069, p=0.3176) (D) The number of lever presses during cocaine seeking test on WD24. Animals that received intra-NAc infusions of NIF peptide once weekly during abstinence had a significant reduction in the number of lever presses (Mann Whitney U=14.50, p=0.038) (E) Representative 3D surface model of an astrocyte from vehicle (top left) or NIF (bottom left) treated animals with corresponding PSD95 spots model (middle left, top and bottom). Merged images show colocalization of PSD95 signal to astrocyte surface models (middle right, top and bottom). Inset indicates higher magnification image showing colocalization of PSD95 spots to perisynaptic astrocyte processes for vehicle and NIF-treated animals (right, top and bottom). Scale bars: 15 μm and 5 μm (inset) (F) Astrocyte surface area quantified in vehicle and NIF-treated animals. Nested t test t(17) = 4.343, p < 0.001 (G) Astrocyte volume quantified in vehicle and NIF-treated animals. Nested t test t(17) = 5.002, p < 0.001 (H) Number of PSD95 spots colocalized to astrocytes in vehicle and NIF-treated animals. Nested t test t(17) = 5.360, p < 0.001 Data are represented as mean +/− SEM. Significance was set at p<0.05. Group sizes: vehicle: N=9–10, n=7–9; NIF: N=8–9, n=8; (N=number of animals, n=number of cells per animal).

References

    1. Khakh B.S., and Sofroniew M.V. (2015). Diversity of astrocyte functions and phenotypes in neural circuits. Nat Neurosci 18, 942–952. 10.1038/nn.4043. - DOI - PMC - PubMed
    1. Bushong E.A., Martone M.E., Jones Y.Z., and Ellisman M.H. (2002). Protoplasmic astrocytes in CA1 stratum radiatum occupy separate anatomical domains. J Neurosci 22, 183–192. 10.1523/JNEUROSCI.22-01-00183.2002. - DOI - PMC - PubMed
    1. Baldwin K.T., Murai K.K., and Khakh B.S. (2024). Astrocyte morphology. Trends Cell Biol 34, 547–565. 10.1016/j.tcb.2023.09.006. - DOI - PMC - PubMed
    1. Shigetomi E., Bushong E.A., Haustein M.D., Tong X., Jackson-Weaver O., Kracun S., Xu J., Sofroniew M.V., Ellisman M.H., and Khakh B.S. (2013). Imaging calcium microdomains within entire astrocyte territories and endfeet with GCaMPs expressed using adeno-associated viruses. J Gen Physiol 141, 633–647. 10.1085/jgp.201210949. - DOI - PMC - PubMed
    1. Chai H., Diaz-Castro B., Shigetomi E., Monte E., Octeau J.C., Yu X., Cohn W., Rajendran P.S., Vondriska T.M., Whitelegge J.P., et al. (2017). Neural Circuit-Specialized Astrocytes: Transcriptomic, Proteomic, Morphological, and Functional Evidence. Neuron 95, 531–549 e539. 10.1016/j.neuron.2017.06.029. - DOI - PMC - PubMed

Publication types

LinkOut - more resources