[Preprint]. 2024 Oct 26:2024.09.18.613279.
doi: 10.1101/2024.09.18.613279.

The transcriptomic landscape of spinal V1 interneurons reveals a role for En1 in specific elements of motor output

Affiliations

The transcriptomic landscape of spinal V1 interneurons reveals a role for En1 in specific elements of motor output

Alexandra J Trevisan et al. bioRxiv. .

Abstract

Neural circuits in the spinal cord are composed of diverse sets of interneurons that play crucial roles in shaping motor output. Despite progress in revealing the cellular architecture of the spinal cord, the extent of cell type heterogeneity within interneuron populations remains unclear. Here, we present a single-nucleus transcriptomic atlas of spinal V1 interneurons across postnatal development. We find that the core molecular taxonomy distinguishing neonatal V1 interneurons perdures into adulthood, suggesting conservation of function across development. Moreover, we identify a key role for En1, a transcription factor that marks the V1 population, in specifying one unique subset of V1Pou6f2 interneurons. Loss of En1 selectively disrupts the frequency of rhythmic locomotor output but does not disrupt flexion/extension limb movement. Beyond serving as a molecular resource for this neuronal population, our study highlights how deep neuronal profiling provides an entry point for functional studies of specialized cell types in motor output.


Conflict of interest statement

DECLARATION OF INTERESTS The authors declare no competing interests.

Figures
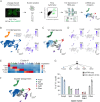
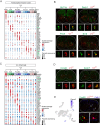
Figure 1.
Figure 1.. Single-nucleus transcriptomic profiling identifies V1 clades as molecularly distinct subsets.
(A) Schematic of the experimental design for single-nucleus transcriptomic analysis of V1 interneurons. (B) Unsupervised clustering of V1 interneuron nuclei at low resolution reveals the first division corresponds to V1 interneurons expressing either Nfib (Group N) or Zfhx3 (Group Z). All UMAP plots depicting gene expression display log normalized values. (C) Unsupervised clustering of V1 interneuron nuclei at higher resolution identifying 14 clusters. (D) UMAP showing expression of the V1 clade markers Foxp2, Pou6f2, Sp8, and Calb1 (a proxy for MafA), which largely segregate in UMAP space. (E) Heatmap showing the scaled average expression per cluster of V1 clade markers. (F) Assignment of clade identity based on expression of Foxp2, Sp8, Pou6f2, and Calb1. (G) Comparison of the proportion of V1 interneurons contained within the clusters assigned to a given clade versus the proportion previously measured by immunohistochemical analysis of P0 lumbar spinal cord, where V1Foxp2 = 42.3% ± 0.8% vs 34.4% ± 1.1%, V1Sp8 = 19.1% ± 0.5% vs 12.5% ± 0.6%, V1Pou6f2 = 12.6% ± 0.5% vs 12.6% vs 0.4%, and V1MafA/Calbindin1 = 5.7% ± 0.2% vs 4.6% ± 0.9%; mean ± SEM; n = 2 replicates or 4 mice. All immunohistochemical data is from Bikoff et al. See also Figures S1- S4.
Figure 2.
Figure 2.. Identification of a novel V1 interneuron subset.
(A) Expression of Rnf220 within clusters #1 and #6, which are not defined by the other four clade markers. (B) Immunohistochemical analysis of Rnf220 expression in lumbar spinal cord of P0 En1INTACT mice, demonstrating expression in V1 interneurons (arrows). Scale bar = 100 μm (top) or 20 μm (bottom). (C) Fraction of V1Rnf220 interneurons in P0 lumbar spinal cord assessed by the proportion of V1 interneurons in Rnf220+ clusters #1 and #6 (14.9% ± 0.5%) or via immunohistochemistry (13.2% ± 1.5%); mean ± SEM; n = 2 snRNA-seq replicates or 4 mice, respectively. (D) Spatial distribution of V1Rnf220 interneurons largely recapitulates the distribution of the overall V1 population. (E-G) Rnf220-expressing V1 interneurons represent a largely non-overlapping population with the four major clades, completely distinct from V1Pou6f2 and V1MafA clades and exhibiting modest overlap with V1Foxp2 and V1Sp8 clades. Scale bars = 100 μm (top) or 20 μm (bottom) (H) Assignment of V1Rnf220 clusters relative to V1Foxp2, V1Sp8, V1Pou6f2, and V1Calb1 clusters, which together constitute 95% of all V1 nuclei.
Figure 3.
Figure 3.. Molecular profiles of V1 interneuron subsets.
(A) Average scaled expression of transcription factors (TFs) enriched in each of the 14 V1 clusters. TFs validated by in situ hybridization (ISH) appear in green text. (B) RNAScope ISH validating expression of select TFs in V1 interneurons in P0 lumbar spinal cords of En1::Cre; Ai14 mice. Scale bars = 200 μm (top) or 10 μm (bottom). (C) Average scaled expression of ion channels enriched in each of the 14 V1 clusters. Validated genes appear in green text. (D) RNAScope ISH validating expression of select ion channels in V1 interneurons in P28 lumbar spinal cord of En1::Cre; Ai14 mice. Scale bars = 200 μm (top) or 10 μm (bottom). (E) Left, UMAP showing Piezo2 expression in V1 interneurons. Right, P0 cervical spinal cord from Piezo2::Cre; En1::Flpo; Ai65D mouse demonstrating Pou6f2 expression (green) or Calb1 expression (blue) in V1Piezo2 interneurons (red). Of the V1Piezo2 neurons in cervical segments, 41.1% ± 11% were Pou6f2+, 36.1% ± 4.5% were Calb1+, and 22.8% ± 6.6% were not positive for either marker, whereas at lumbar segments 2.8% ± 1.9% were Pou6f2+, 58.0% ± 2.1% were Calb1+, and 39.2% ± 2.0% were not positive for either marker (mean ± SEM, n = 3 animals). Scale bars = 200 μm (top) or 20 μm (bottom). See also Figures S3 and S4.
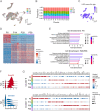
Figure 4:
Figure 4:. Changes in gene expression across postnatal development do not change core neuronal identity.
(A) UMAP of V1 nuclei color-coded by age (P0, P14, P28, or P56) at the time of sample collection. (B) The relative contribution of each sample to the 14 V1 clusters. (C) Integrated local inverse Simpson’s index (iLISI) calculated for age. iLISI scores ranged from 1 to 4 (the number of groups), with higher scores indicating better intermixing between groups. (D) Heatmap of the top 30 most differentially expressed genes at each time point. (E) Gene ontology (GO) analysis showing the top 8 biological processes enriched in the gene expression profiles of V1 nuclei at P0 (top) or P28 and P56 combined (bottom). (F) Ridge plot highlighting genes with increasing expression (Snap25, red) and decreasing expression (Sema6d, blue) from P0 to P56. Log normalized values are shown. (G) Identification of genes dynamically regulated across postnatal development that are specific to cluster #8 (top) or Cluster #13 (bottom).
Figure 5.
Figure 5.. Transcriptomic analysis of V1 interneurons in En1KO mice reveals En1 is required for the development of a specific V1Pou6f2 cell type.
(A) Top, representative images of P0 lumbar spinal cords from En1::Cre heterozygous; RC.lsl.Sun1-sfGFP (En1 Het) or En1::Cre homozygous; RC.lsl.Sun1-sfGFP (En1 KO) mice immunostained for En1 (red) and lineage-traced V1 interneurons (green). Bottom, UMAP visualization of unsupervised clustering of snRNA-seq data generated for these genotypes, identifying 11 distinct clusters. (B) UMAP of En1Het (blue) and En1KO (orange) nuclei. (C) Normalized percentage of nuclei in cluster 10 originating from either En1Het or En1KO animals across two biological replicates. (D) Normalized ratio of Het:KO nuclei in each cluster across two biological replicates, where 1 corresponds to equal representation of both genotypes. With cluster #2 as a reference, only cluster #10 was found to have a credible change in abundance, as determined by scCODA (log2FC = −1.61, False Discovery Rate [FDR] < 0.05). (E) UMAP showing expression of Pou6f2 and Nr5a2 enriched in Cluster #10. (F) Immunohistochemical (IHC) analysis of V1Pou6f2 (left) and V1Nr5a2 (right) interneurons in P0 lumbar spinal cords of En1Het or En1KO mice demonstrating a significant reduction in each subset. V1 interneurons were lineage-traced using Tau.lsl.nLacZ mice (green). V1Pou6f2: 13.9% ± 0.3% vs 8.4% ± 0.6% in Het vs KO animals, respectively, mean ± SEM, n = 7 animals; V1Nr5a2: 6.3% ± 0.3% vs 0.1% ± 0.1% in Het vs KO animals, mean ± SEM, n = 5 animals, *** p < 0.0001, unpaired two-tailed T-test). (G) Percentage of V1 subsets defined by 17 other TFs in En1Het or En1KO mice assessed by IHC, showing no statistical difference between genotypes (mean ± SEM, n = 2 to 5 animals per condition, p > 0.5 for all comparisons, unpaired two-tailed t-test with Holm-Sidak correction for multiple comparisons). See also Figure S5.
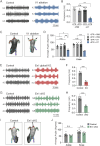
Figure 6.
Figure 6.. Loss of spinal En1 expression reduces the frequency of fictive locomotion but does not result in limb hyperflexion.
(A) Ventral root recordings during fictive locomotion performed on P4 control (−DTR + DT, gray) or V1-ablated (+DTR + DT, blue) spinal cords. (B) Reduced frequency of fictive locomotor activity upon DT-mediated ablation of V1 interneurons (locomotor frequency of 0.44 ± 0.02 Hz, 0.38 ± 0.03 Hz, 0.41 ± 0.02 Hz in control conditions vs 0.13 ± 0.02 Hz upon V1 ablation, mean ± SEM, n = 3-11 mice, two-way ANOVA: F(1,18) = 13.86, ***p < 0.001, two-way ANOVA followed by Holm-Sidak test for multiple comparisons). (C) Tail suspension assay performed in P7 control (−DTR +DT, left) or V1 ablated (+DTR +DT, right) mice. Hindlimb hyperflexion is indicated by arrows, with joints and angles identified using DeepLabCut. (D) The average angles of the ankle and knee joints are significantly reduced upon ablation of V1 interneurons, indicating a hyperflexed state (n = 3 to 12 mice, mean ± SEM, *p < 0.05, **p < 0.01, ***p < 0.001, two-way ANOVA followed by Holm-Sidak test for multiple comparisons). (E) Ventral root recordings during fictive locomotion in control (En1::CreHet) or global En1 KO (En1::CreHom) mice. (F) Reduced frequency of fictive locomotor activity in global En1 KO mice (n = 6-7 mice, mean ± SEM, ***p < 0.001, unpaired two-tailed t-test). (G) Ventral root recordings in control (En1flox/+, gray) or En1 cKO (Hoxb8::Cre; En1flox/flox, green) mice. (H) En1 cKO mice show reduced locomotor frequency (n = 4-10 mice, mean ± SEM, ***p < 0.001, unpaired two-tailed t-test). (I) The hindlimbs of control (En1flox/+) or En1 cKO mice observed during tail suspension assay, with normal flexion/extension. (J) The average angles of the ankle and knee joints are not significantly different upon loss of En1 (n = 7-11 mice, mean ± SEM, n.s. = not significant by unpaired two-tailed t-test). See also Figure S6.

References

    1. Eccles J.C., Fatt P., and Landgren S. (1956). Central pathway for direct inhibitory action of impulses in largest afferent nerve fibres to muscle. J Neurophysiol 19, 75–98. 10.1152/jn.1956.19.1.75. - DOI - PubMed
    1. Eccles J.C., Fatt P., and Koketsu K. (1954). Cholinergic and inhibitory synapses in a pathway from motor-axon collaterals to motoneurones. J Physiol 126, 524–562. 10.1113/jphysiol.1954.sp005226. - DOI - PMC - PubMed
    1. Jankowska E. (1992). Interneuronal relay in spinal pathways from proprioceptors. Prog Neurobiol 38, 335–378. 10.1016/0301-0082(92)90024-9. - DOI - PubMed
    1. Rudomin P. (2009). In search of lost presynaptic inhibition. Exp Brain Res 196, 139–151. 10.1007/s00221-009-1758-9. - DOI - PubMed
    1. Cote M.P., Murray L.M., and Knikou M. (2018). Spinal Control of Locomotion: Individual Neurons, Their Circuits and Functions. Front Physiol 9, 784. 10.3389/fphys.2018.00784. - DOI - PMC - PubMed

Publication types