

This is a preprint.
The Pattern and Staging of Brain Atrophy in Spinocerebellar Ataxia Type 2 (SCA2): MRI Volumetrics from ENIGMA-Ataxia
- PMID: 39345594
- PMCID: PMC11429976
- DOI: 10.1101/2024.09.16.613281
The Pattern and Staging of Brain Atrophy in Spinocerebellar Ataxia Type 2 (SCA2): MRI Volumetrics from ENIGMA-Ataxia
Abstract
Objective: Spinocerebellar ataxia type 2 (SCA2) is a rare, inherited neurodegenerative disease characterised by progressive deterioration in both motor coordination and cognitive function. Atrophy of the cerebellum, brainstem, and spinal cord are core features of SCA2, however the evolution and pattern of whole-brain atrophy in SCA2 remain unclear. We undertook a multi-site, structural magnetic resonance imaging (MRI) study to comprehensively characterize the neurodegeneration profile of SCA2.
Methods: Voxel-based morphometry analyses of 110 participants with SCA2 and 128 controls were undertaken to assess groupwise differences in whole-brain volume. Correlations with clinical severity and genotype, and cross-sectional profiling of atrophy patterns at different disease stages, were also performed.
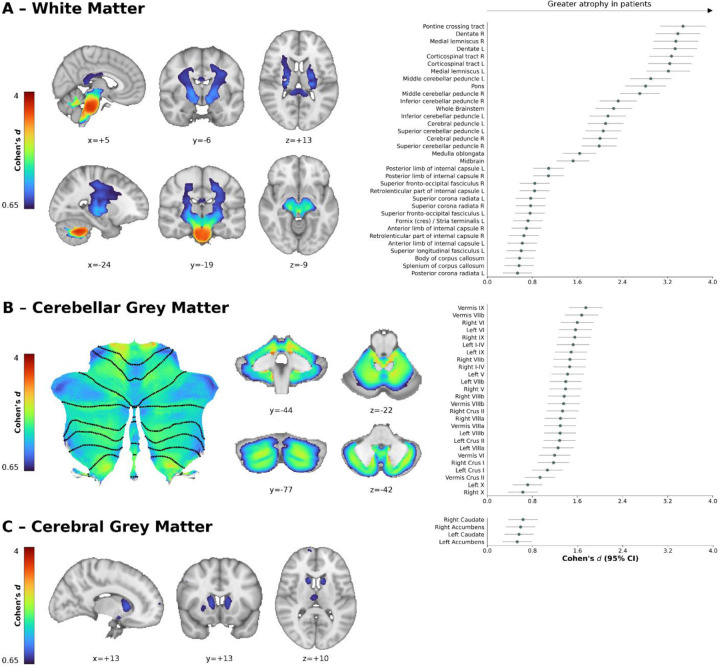
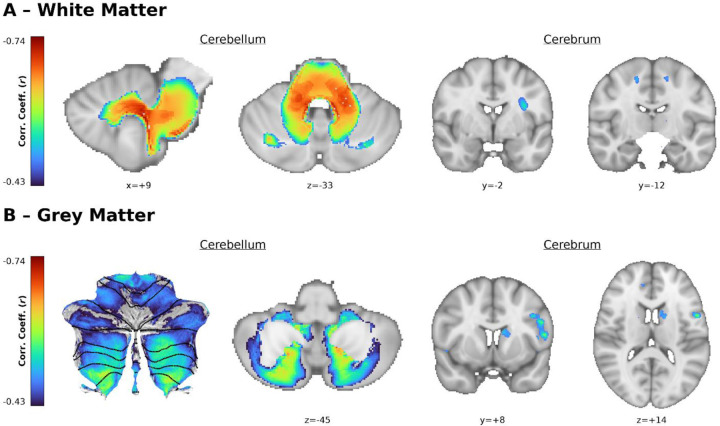
Results: Atrophy in SCA2 relative to controls was greatest (Cohen's d>2.5) in the cerebellar white matter (WM), middle cerebellar peduncle, pons, and corticospinal tract. Very large effects (d>1.5) were also evident in the superior cerebellar, inferior cerebellar, and cerebral peduncles. In cerebellar grey matter (GM), large effects (d>0.8) mapped to areas related to both motor coordination and cognitive tasks. Strong correlations (|r|>0.4) between volume and disease severity largely mirrored these groupwise outcomes. Stratification by disease severity showed a degeneration pattern beginning in cerebellar and pontine WM in pre-clinical subjects; spreading to the cerebellar GM and cerebro-cerebellar/corticospinal WM tracts; then finally involving the thalamus, striatum, and cortex in severe stages.
Interpretation: The magnitude and pattern of brain atrophy evolves over the course of SCA2, with widespread, non-uniform involvement across the brainstem, cerebellar tracts, and cerebellar cortex; and late involvement of the cerebral cortex and striatum.
Conflict of interest statement
Potential Conflicts of Interest The authors have no conflicts of interest to declare with respect to this study.
Figures


Similar articles
-
The Pattern and Stages of Atrophy in Spinocerebellar Ataxia Type 2: Volumetrics from ENIGMA-Ataxia.Mov Disord. 2025 Apr;40(4):651-661. doi: 10.1002/mds.30143. Epub 2025 Feb 10. Mov Disord. 2025. PMID: 39927598 Free PMC article.
-
Brain white matter damage in SCA1 and SCA2. An in vivo study using voxel-based morphometry, histogram analysis of mean diffusivity and tract-based spatial statistics.Neuroimage. 2008 Oct 15;43(1):10-9. doi: 10.1016/j.neuroimage.2008.06.036. Epub 2008 Jul 11. Neuroimage. 2008. PMID: 18672073
-
Structural cerebellar correlates of cognitive functions in spinocerebellar ataxia type 2.J Neurol. 2018 Mar;265(3):597-606. doi: 10.1007/s00415-018-8738-6. Epub 2018 Jan 22. J Neurol. 2018. PMID: 29356974
-
Spinocerebellar Ataxia Type 2: Clinicogenetic Aspects, Mechanistic Insights, and Management Approaches.Front Neurol. 2017 Sep 11;8:472. doi: 10.3389/fneur.2017.00472. eCollection 2017. Front Neurol. 2017. PMID: 28955296 Free PMC article. Review.
-
Voxel-based meta-analysis of gray matter and white matter changes in patients with spinocerebellar ataxia type 3.Front Neurol. 2023 Jul 27;14:1197822. doi: 10.3389/fneur.2023.1197822. eCollection 2023. Front Neurol. 2023. PMID: 37576018 Free PMC article.
References
-
- Rü U, Schöls L, Paulson H, et al. Clinical features, neurogenetics and neuropathology of the polyglutamine spinocerebellar ataxias type 1, 2, 3, 6 and 7 [Internet]. Prog. Neurobiol. 2013;104:38–66.Available from: https://linkinghub.elsevier.com/retrieve/pii/S0301008213000105 - PubMed
-
- Sun Y-M, Lu C, Wu Z-Y. Spinocerebellar ataxia: relationship between phenotype and genotype – A review [Internet]. Clin. Genet. 2016;90(4):305–314.Available from: https://onlinelibrary.wiley.com/doi/10.1111/cge.12808 - DOI - PubMed
-
- Hernandez-Castillo CR, King M, Diedrichsen J, Fernandez-Ruiz J. Unique degeneration signatures in the cerebellar cortex for spinocerebellar ataxias 2, 3, and 7 [Internet]. NeuroImage Clin. 2018;20:931–938.Available from: https://linkinghub.elsevier.com/retrieve/pii/S2213158218303012 - PMC - PubMed
-
- Jung BC, Choi SI, Du AX, et al. MRI shows a region-specific pattern of atrophy in spinocerebellar ataxia type 2 [Internet]. The Cerebellum 2012;11:272–279.Available from: http://link.springer.com/10.1007/s12311-011-0308-8 - DOI - PMC - PubMed
-
- Adanyeguh IM, Perlbarg V, Henry P-G, et al. Autosomal dominant cerebellar ataxias: Imaging biomarkers with high effect sizes [Internet]. NeuroImage Clin. 2018;19:858–867.Available from: https://linkinghub.elsevier.com/retrieve/pii/S2213158218301943 - PMC - PubMed
Publication types
Grants and funding
LinkOut - more resources
Full Text Sources
Research Materials
Miscellaneous