[Preprint]. 2024 Sep 20:2024.09.19.613891.
doi: 10.1101/2024.09.19.613891.

EFFECTS OF SPINAL TRANSECTION AND LOCOMOTOR SPEED ON MUSCLE SYNERGIES OF THE CAT HINDLIMB

Affiliations

EFFECTS OF SPINAL TRANSECTION AND LOCOMOTOR SPEED ON MUSCLE SYNERGIES OF THE CAT HINDLIMB

Alexander N Klishko et al. bioRxiv. .

Update in

Abstract

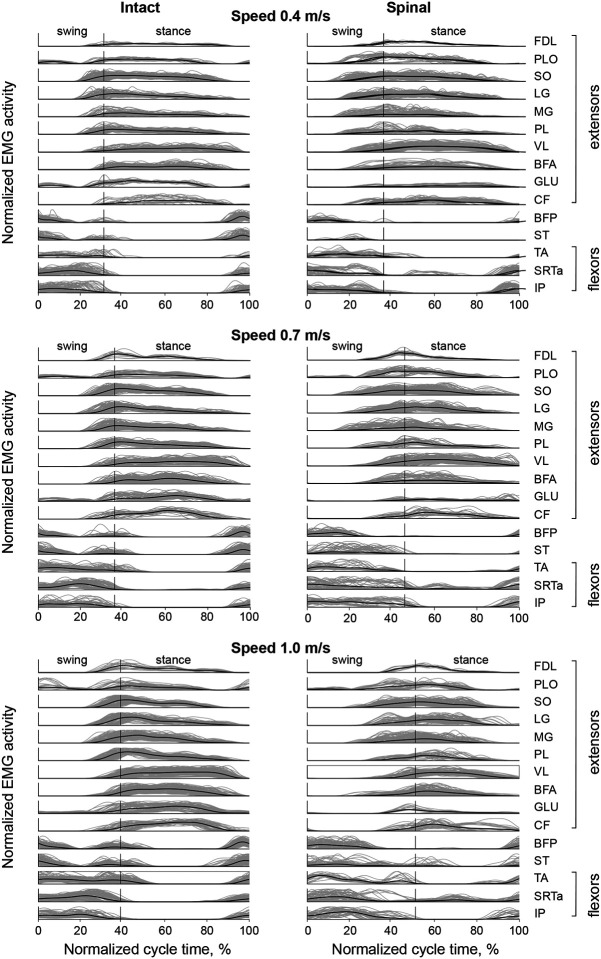
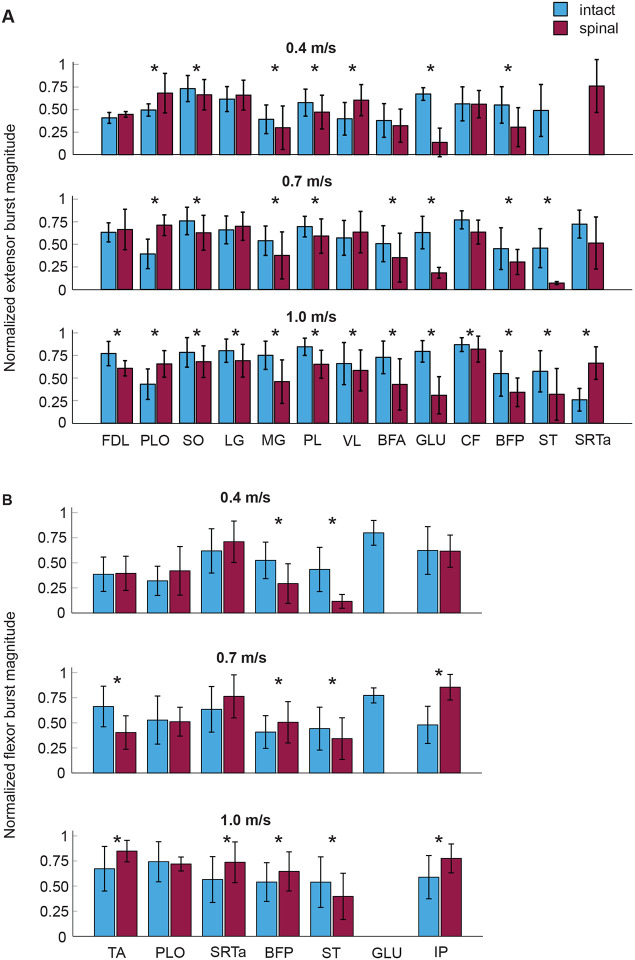
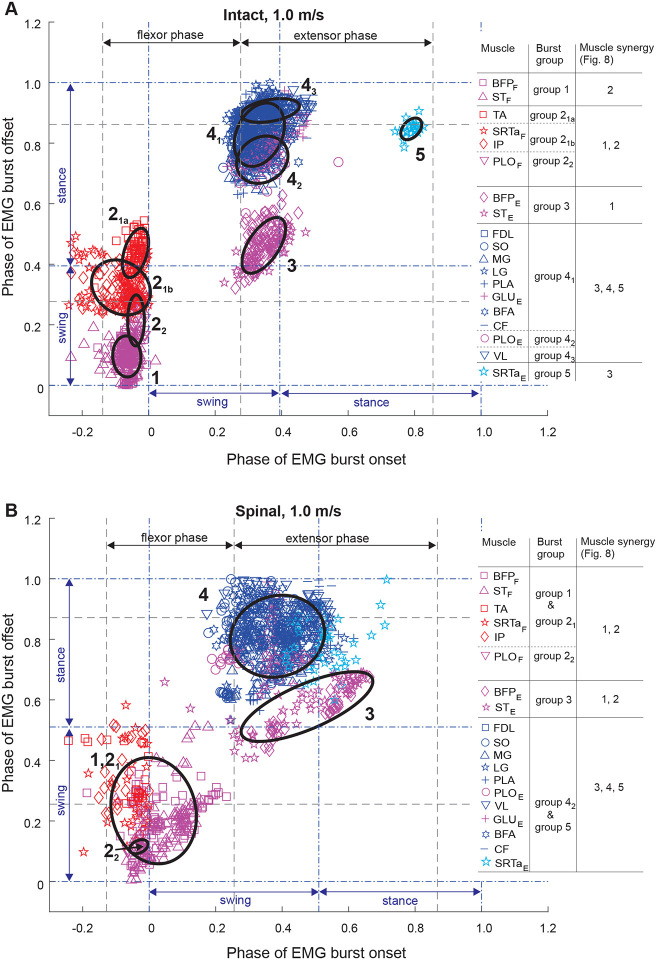
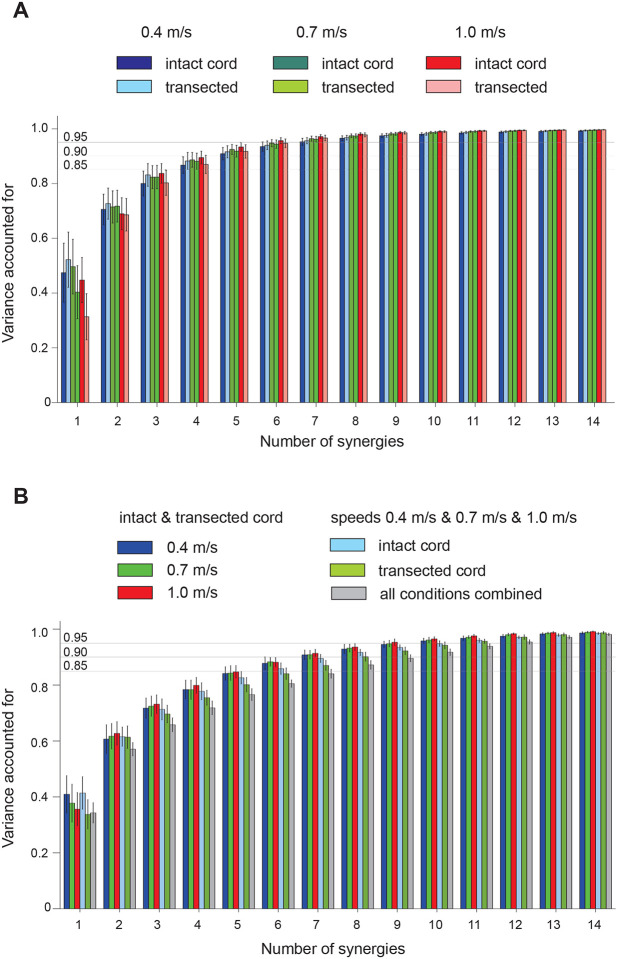
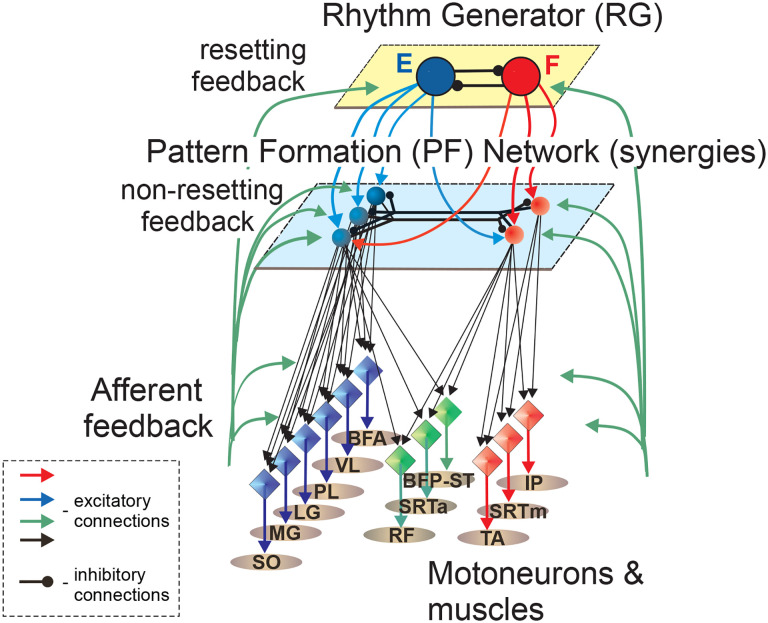
It was suggested that during locomotion, the nervous system controls movement by activating groups of muscles, or muscle synergies. Analysis of muscle synergies can reveal the organization of spinal locomotor networks and how it depends on the state of the nervous system, such as before and after spinal cord injury, and on different locomotor conditions, including a change in speed. The goal of this study was to investigate the effects of spinal transection and locomotor speed on hindlimb muscle synergies and their time-dependent activity patterns in adult cats. EMG activities of 15 hindlimb muscles were recorded in 9 adult cats of either sex during tied-belt treadmill locomotion at speeds of 0.4, 0.7, and 1.0 m/s before and after recovery from a low thoracic spinal transection. We determined EMG burst groups using cluster analysis of EMG burst onset and offset times and muscle synergies using non-negative matrix factorization. We found five major EMG burst groups and five muscle synergies in each of six experimental conditions (2 states × 3 speeds). In each case, the synergies accounted for at least 90% of muscle EMG variance. Both spinal transection and locomotion speed modified subgroups of EMG burst groups and the composition and activation patterns of selected synergies. However, these changes did not modify the general organization of muscle synergies. Based on the obtained results, we propose an organization for a pattern formation network of a two-level central pattern generator that can be tested in neuromechanical simulations of spinal circuits controlling cat locomotion.

Keywords: Locomotion; central pattern generator; muscle synergies; spinal transection.


Conflict of interest statement

Competing interests The authors declare no competing interests.

Figures

Figure 1.
Figure 1.
Low-pass filtered patterns of EMG activity of hindlimb muscles during intact (left panels) and spinal (right panels) tied-belt treadmill locomotion at speeds 0.4 m/s (top panels), 0.7 m/s (middle panels), and 1.0 m/s (bottom panels). Gray lines show EMG patterns of all analyzed 2457 cycles of 9 cats (see Table 1), thick black lines are the mean EMG patterns across all cycles and cats within a muscle and experimental condition. The EMG magnitude of each muscle is normalized to the peak low-pass filtered EMG across all experimental conditions within the cat. The vertical axis in each plot designates the range of the normalized EMG magnitude from 0 to 1. The vertical line within each EMG panel separates the swing and stance phases. Extensors are muscles with a stance phase related activity and primary function of supporting body against gravity and propelling it forward: FDL, flexor digitorum longus (digits and ankle plantarflexor); PLO, peroneus longus (ankle abductor and a dorsiflexor); SO, soleus (ankle plantarflexor); MG, medial gastrocnemius (ankle plantarflexor and knee flexor); PL, plantaris (digits and ankle plantarflexor and knee flexor); VL, vastus lateralis (knee extensor); BFA, biceps femoris (hip extensor); GLU, gluteus (hip abductor and extensor); CF, caudofemoralis (hip abductor and extensor). Flexors are muscles with a swing phase related activity: TA, tibialis anterior (ankle dorsiflexor); SRTa, sartorius anterior (hip flexor and knee extensor); IP, iliopsoas (hip flexor). Two muscles (BFP, biceps femoris posterior, hip extensor and knee flexor) and ST (semitendinosus, hip extensor and knee flexor) are bifunctional muscles with swing and stance related activity.
Figure 2.
Figure 2.
Normalized EMG burst activity (mean ± SD) in intact and spinal states during locomotion at speeds 0.4, 0.7 and 1.0 m/s. A: Normalized EMG activity of extensor (stance related) bursts. B: Normalized EMG activity of flexor (swing related) bursts. Asterisks indicate statistical significance between intact and spinal conditions. For extensor bursts main effect of condition was significant (p < 0.001, F1,5475 = 268.6, linear mixed-effects model). For flexor bursts the main effect of condition was not significant (F1,2035 = 2.427, p = 0.119), whereas the interaction effect of condition-speed-muscle was significant (p < 0.001). For muscle abbreviations see the legend for Fig. 1.
Figure 3.
Figure 3.
Temporal characteristics of locomotion cycles of individual cats (mean ± SD). A: Cycle time. B: Swing time. C: Stance time. D: Duty cycle. Horizontal lines and p-values above pairs of experimental conditions indicate significance of the difference between the conditions.
Figure 4.
Figure 4.
Scatter plots of EMG burst onset and offset times of 15 hindlimb muscles and EMG burst groups for locomotion speed of 0.4 m/s in intact (panel A) and spinal (panel B) states. Onset and offset times are shown as cycle phase from 0 (swing phase onset) to 1.0 (next swing phase onset). Ellipses and corresponding color-coded symbols denote EMG burst groups/subgroups identified by cluster analysis. The gray dashed lines indicate the onset of the flexor and extensor phases defined by the mean EMG burst onset time minus one SD of IP and SO, respectively. The blue dashed-dotted lines separate the swing and stance phases. For muscle abbreviations see the legend for Fig. 1.
Figure 5.
Figure 5.
Scatter plots of EMG burst onset and offset times of 15 hindlimb muscles and EMG burst groups for locomotion speed of 0.7 m/s in intact (panel A) and spinal (panel B) states. For further information see the legend for Fig. 4.
Figure 6.
Figure 6.
Scatter plots of EMG burst onset and offset times of 15 hindlimb muscles and EMG burst groups for locomotion speed of 1.0 m/s in intact (panel A) and spinal (panel B) states. For further information see the legend for Fig. 4.
Figure 7.
Figure 7.
Variance accounted for (mean ± SD) in recorded EMG patterns by EMG patterns reconstructed from muscle synergies as a function of the number of synergies. A: Variance accounted for by reconstructed EMG patterns in each intact and spinal state during locomotion at 0.4, 0.7, and 1.0 m/s. Horizontal lines indicate values of variance 0.85, 0.90, and 0.95. B: Variance accounted for by reconstructed EMG patterns obtained from different combinations of matrices D*COM = WCOMCCOM composed by mixing different experimental conditions (see Methods). Variance computed for six combinations is shown: (1–3) the intact & spinal state combination at speeds 0.4, 0.7, and 1.0 m/s, respectively; (4–5) the combination of three speeds for intact and spinal state, respectively; (6) the combination of all 6 experimental conditions.
Figure 8.
Figure 8.
Five muscle synergies and their activation patterns during tied-belt locomotion at speeds 0.4, 0.7, and 1.0 m/s in intact and spinal conditions. A: Mean (±SD) muscle synergy weights (relative contribution of each muscle to a given synergy; rows in (15 × 5) matrices WIn_0.4, WIn_0.7, WIn_1.0, WSp_0.4, WSp_0.7, WSp_1.0 corresponding to each experimental condition: intact and spinal states at three locomotion speeds). Matrix WIn|Sp_0.4|0.7|1.0 contains muscle weight coefficient for a combination of all 6 experimental conditions; matrix dimensions are (15 × 5). Each matrix W was computed using 50 randomly selected cycles across all cats (see Methods). B: Mean (±SD) activation patterns of five muscle synergies (columns in (5 × 100) matrices CIn_0.4, CIn_0.7, CIn_1.0, CSp_0.4, CSp_0.7, CSp_1.0 corresponding to each experimental condition. The activation patterns for each experimental condition are shown as a function of the normalized cycle time in the following order: intact (int), speed 0.4 m/s; intact, speed 0.7 m/s; intact, speed 1.0 m/s; spinal (Sp), speed 0.4 m/s; spinal, speed 0.7 m/s; and spinal, speed 1.0 m/s. Activation coefficients in matrix CIn|Sp_0.4|0.7|1.0 (orange line) represent synergy activation patterns of a combination of all 6 experimental conditions; matrix dimensions are (5 × 600). Vertical continues lines surrounded by vertical dashed lines correspond to the mean ± SD swing offset/stance onset normalized times in each experimental condition. These lines separate the swing (sw) and stance (st) phases. For muscle abbreviations see the legend for Fig. 1.
Figure 9.
Figure 9.
Angles (mean ± SD) between pairs of 15-dimensional vectors of muscle weights for a given synergy corresponding to all combinations of two different experimental conditions.
Figure 10.
Figure 10.
Five muscle synergies (mean ± SD) computed for different matrices WCOM composed by mixing different combinations of experimental conditions (see Methods). These combinations are (in the order of bars for each muscle): (1) the combination of all 6 experiments conditions (intact, spinal, speeds 0.4, 0.7, and 1.0 m/s), matrix WIn|Sp_0.4|0.7|1.0; (2) intact and the combination of all speeds, WIn_0.4|0.7|1.0; (3) spinal and the combination of all speeds WSp_0.4|0.7|1.0; (4) the combination of intact and spinal condition at speed 0.4 m/s, WIn|Sp_0.4; (5) the combination of intact and spinal condition at speed 0.7 m/s, WIn|Sp_0.7; and (6) the combination of intact and spinal condition at speed 1.0 m/s, WIn|Sp_1.0. For muscle abbreviations see the legend for Fig. 1.
Figure 11.
Figure 11.
Synergy activation patterns (mean ± SD) as a function of the normalized cycle time for individual experimental conditions and their combinations. A: Activation patterns for intact state and different locomotion speeds are shown in the following order from left to right: speed 0.4 m/s, speed 0.7 m/s, and speed 1.0 m/s. Activation coefficients in the common matrix CIn_0.4|0.7|1.0 (orange line) represent synergy activation patterns of a combination of all 3 speeds of intact state; the matrix dimensions are (5 × 300). Vertical continues lines surrounded by vertical dashed lines correspond to the mean ± SD swing offset/stance onset normalized times in each experimental condition. These lines separate the swing (sw) and stance (st) phases. Coefficients of determination (R2) indicate correlation between the activation pattern of an individual experimental condition with the corresponding component of the common matrix CIn_0.4|0.7|1.0. B: Activation patterns for spinal condition and different locomotion speeds are shown in the following order from left to right: speed 0.4 m/s, speed 0.7 m/s, and speed 1.0 m/s. Activation coefficients in the common matrix CSp_0.4|0.7|1.0 (orange line) represent synergy activation patterns of a combination of all 3 speeds of spinal condition. Coefficients of determination (R2) indicate correlation between the activation pattern of an individual experimental condition with the corresponding component of the common matrix CSp_0.4|0.7|1.0. C: Activation patterns for intact and spinal states at locomotion speed of 0.4 m/s and the activation coefficients in the common matrix CIn|Sp_0.4 (orange line). D: Activation patterns for intact and spinal states at locomotion speed of 0.7 m/s and the activation coefficients in the common matrix CIn|Sp_0.7 (orange line). D: Activation patterns for intact and spinal states at locomotion speed of 1.0 m/s and the activation coefficients in the common matrix CIn|Sp_1.0 (orange line).
Figure 12.
Figure 12.
Schematic of a spinal locomotor CPG for a single hindlimb consistent with five synergies revealed in spinal condition. The schematic is a modified version of a previous two-level CPG model (Rybak et al., 2006b; McCrea and Rybak, 2008). The model consists of a rhythm generator with flexor and extensor half-centers (large circles) mutually inhibiting each other, and a pattern formation network that contains 5 premotor interneuronal populations (smaller circles) activating motoneurons (diamonds) of the corresponding muscles (ovals). For muscle abbreviations see the legend for Fig. 1. Additional muscle legends: RF, rectus femoris (hip flexor, knee extensor) and SRTm, sartorius medial (hip flexor and knee flexor). These muscles were not investigated in this study and included in the schematic based on previous synergy analyses (Markin et al., 2012; Higgin et al., 2020; Klishko et al., 2021). See text for further explanations.

Similar articles

References

    1. Audet J, Harnie J, Lecomte CG, Mari S, Merlet AN, Prilutsky BI, Rybak IA, Frigon A (2022) Control of Forelimb and Hindlimb Movements and Their Coordination during Quadrupedal Locomotion across Speeds in Adult Spinal Cats. J Neurotrauma 39:1113–1131. - PMC - PubMed
    1. Berkowitz A (2019) Expanding our horizons: central pattern generation in the context of complex activity sequences. J Exp Biol 222. - PubMed
    1. Bernstein NA (1967) The Coordination and Regulation of Movements. New York: Pergamon Press.
    1. Bernstein NA (2021) On the Construction of Movements. 1947. In: Bernstein’s Construction of Movements: The Original Text and Commentaries. 2020 (Latash ML, ed). New York, London: Routledge.
    1. Bilchak JN, Caron G, Cote MP (2021) Exercise-Induced Plasticity in Signaling Pathways Involved in Motor Recovery after Spinal Cord Injury. Int J Mol Sci 22. - PMC - PubMed

Publication types

LinkOut - more resources