[Preprint]. 2024 Sep 16:2024.09.16.613328.
doi: 10.1101/2024.09.16.613328.

Distinct H3K9me3 heterochromatin maintenance dynamics govern different gene programs and repeats in pluripotent cells

Affiliations

Distinct H3K9me3 heterochromatin maintenance dynamics govern different gene programs and repeats in pluripotent cells

Jingchao Zhang et al. bioRxiv. .

Update in

Abstract

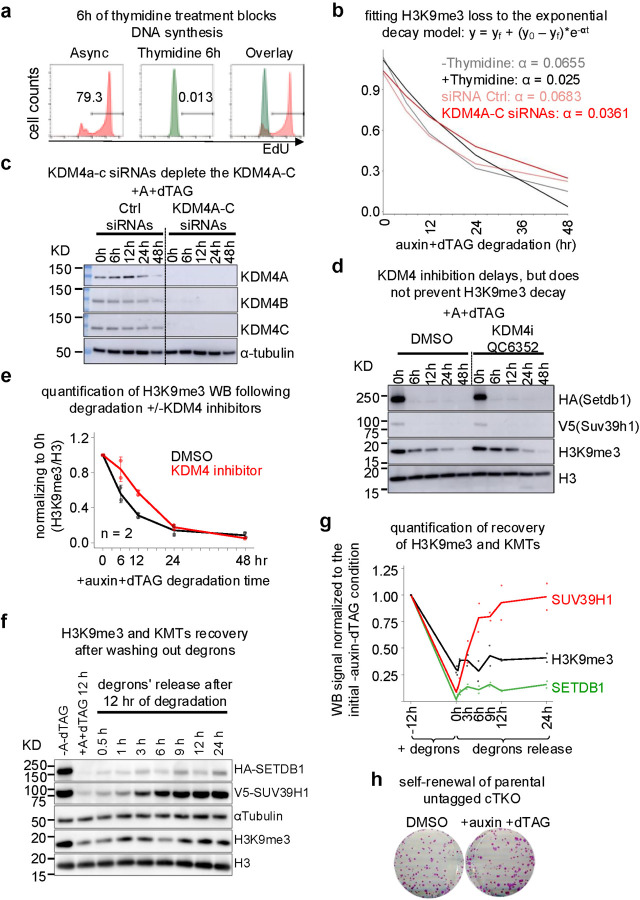
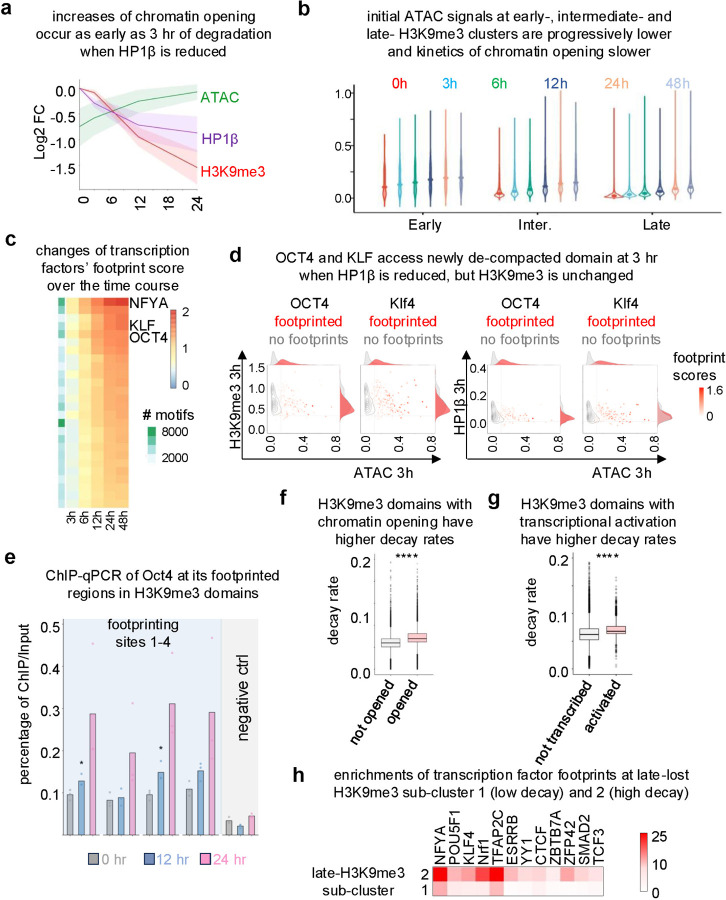
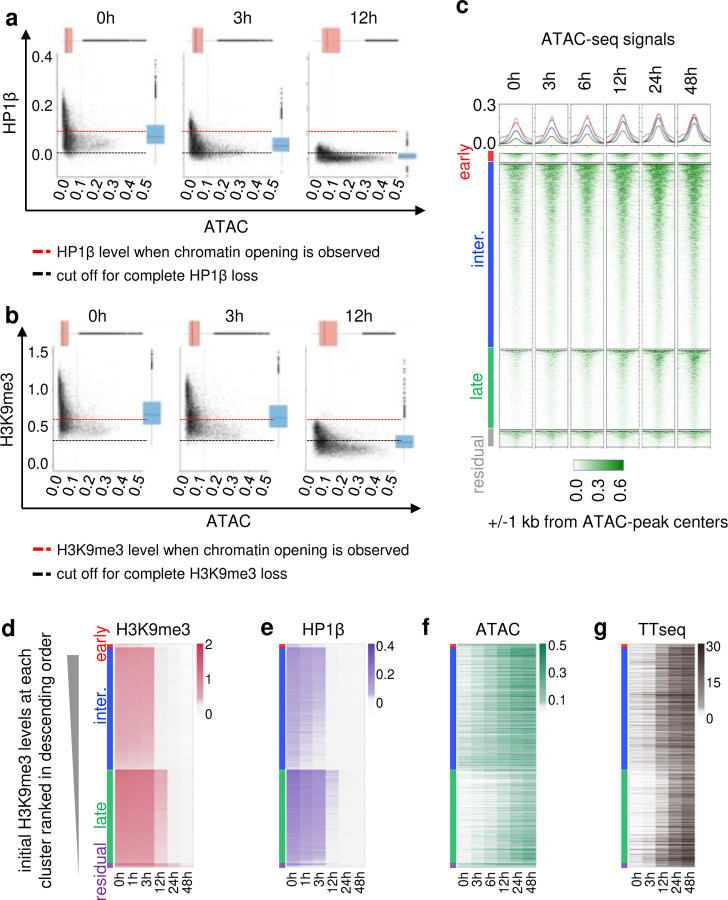
H3K9me3-heterochromatin, established by lysine methyltransferases (KMTs) and compacted by HP1 isoforms, represses alternative lineage genes and DNA repeats. Our understanding of H3K9me3-heterochromatin stability is presently limited to individual domains and DNA repeats. We engineered Suv39h2 KO mouse embryonic stem cells to degrade remaining two H3K9me3-KMTs within one hour and found that both passive dilution and active removal contribute to H3K9me3 decay within 12-24 hours. We discovered four different H3K9me3 decay rates across the genome and chromatin features and transcription factor binding patterns that predict the stability classes. A "binary switch" governs heterochromatin compaction, with HP1 rapidly dissociating from heterochromatin upon KMTs' depletion and a particular threshold level of HP1 limiting pioneer factor binding, chromatin opening, and exit from pluripotency within 12 hr. Unexpectedly, receding H3K9me3 domains unearth residual HP1β peaks enriched with heterochromatin-inducing proteins. Our findings reveal distinct H3K9me3-heterochromatin maintenance dynamics governing gene networks and repeats that together safeguard pluripotency.


Conflict of interest statement

Competing Interests Statement: The authors declare no competing interests.

Figures

Extended Data 1
Extended Data 1
Extended Data 2
Extended Data 2
Extended Data 3
Extended Data 3
Extended Data 4
Extended Data 4
Extended Data 5
Extended Data 5
Extended Data 6
Extended Data 6
Extended Data 7
Extended Data 7
Extended Data 8
Extended Data 8
Extended Data 9
Extended Data 9
Extended Data 10
Extended Data 10
Fig. 1:
Fig. 1:. Acute depletion of H3K9me3 KMTs causes rapid decay of H3K9me3 marks in mouse ESCs
a, Schematics of the genetic engineering of dTKO mouse ESC line. b, Western blot of SETDB1-HA and SUV39H1-V5 with designated tag antibodies, H3K9me3, and histone H3 in chromatin fraction after different hours of auxin and dTAG13 degrons treatment. Experiments were repeated three times independently with similar results. The molecular weight in KD (kilodaltons) is on the left. c, Differential analysis of the histone marks abundances measured by mass spectrometry between 0 hr and 48 hr of auxin and dTAG degrons treatment. Statistically significantly changed histone marks were highlighted in blue (reduced) and red (increased). d, Heatmap showing the dynamics of heterochromatin marks over the degradation time course. Values are log2 fold changes of the mean values of three biological replicates at each time point over 0 hr. e,f, Western blot (e) and quantifications (f) of H3K9me3 normalized to 0 hr sample after histone H3 normalization, following the auxin and dTAG treatments with or without thymidine; n = 3 biologically independent replicates. g,h, Western blot (g) and quantifications (h) of H3K9me3, following the auxin and dTAG treatment with non-targeting siRNAs (ctrl) or KDM4A-C siRNAs. H3K9me3 levels are normalized to 0 hr sample after histone H3 normalization; n = 3 biologically independent replicates. i, Schematics of different regimes of auxin and dTAG treatment of moue dTKO ESCs followed by degrons washout, before alkaline phosphatases staining (left). Quantifications of areas of alkaline phosphatase positive colonies, normalized to the 0 hr sample (right). n = 5 biologically independent replicates. AP, alkaline phosphatase. Values in f,h,i are means ± SEM; Two-sided Student’s t-tests were used for the two conditions. P Values are indicated above each time point. Source numerical data and unprocessed blots are available in Source data.
Fig. 2:
Fig. 2:. H3K9me3 and HP1β decay rates differ genome-wide
a, Schematics of H3K9me3-KMTs’ degradation time course for H3K9me3 and HP1β ChIP-seq, ATAC-seq and TT-seq, and mass spectrometry analysis (see Methods section for details). b,c, Differential analysis of the ATAC-seq (b) and nascent RNA TT-seq (c) between 48 hr and 0 hr of degradation. The ATAC peaks that directly overlap with the H3K9me3 domains (b) or the transcription units within 10kb of the nearest H3K9me3 domains (c) are highlighted in red. d,e, Heatmaps of H3K9me3 (d) and HP1β (e) ChIP-seq signals at 42,890 H3K9me3 domains over the time course. Domains were ranked in descending order of their size and centered at the middle of each domain with 10 kb flanking windows. f, Boxplots comparing H3K9me3 and HP1β ChIP-seq signals (Z-score transformed) at 42,890 H3K9me3 domains over the degron time course. g, Genomic snapshot of H3K9me3 (red) and HP1β (purple) ChIP-seq tracks over the degradation time course. The genome coordinate (mm10) is indicated above. The black arrows highlight faster HP1β loss than the H3K9me3 mark at the corresponding domains. The green arrows indicate the residual HP1β peaks after complete H3K9me3 depletions. h, Scatter plot of H3K9me3 and HP1β ChIP-seq signals (spike-in normalized ChIP/Input) at H3K9me3 domains in dTKO cells before degradation. i, Boxplot of H3K9me3 and HP1β decay rate across the H3K9me3 domains (n = 42,890). j, Mass spectrometry quantifications of the HP1α/β/γ in the chromatin fractions following KMTs’ degradation. Values are means ± SEM.; n = 3 biologically independent replicates. Two-sided Student’s t-tests were used for each time point vs. 0 hr. P Values of HP1α/β/γ at 3, 6, 12, 24 and 48 hr times are indicated above the graph. k, Heatmaps of HP1β signals over the degradation time course at ERV1, ERVK and L1 repeats that intersect with 24 hr residual HP1β peaks. ERV, endogenous retroviral elements; L1, LINE1. In boxplots (f,i), the boxes represent interquartile range (IQR) from 25th to 75th percentile, with the median at the center, and whiskers extending to 1.5 times the IQR from the quartiles. Source numerical data are available in Source data.
Fig. 3:
Fig. 3:. Heterochromatin states influence kinetics of H3K9me3 decay
a, Alluvial plots showing different timings of the H3K9me3 loss. The H3K9me3 of early-, intermediate-, and late- cluster are lost at 3 hr, 12 hr, and 24 hr, respectively, whereas the residual- cluster persist after 24 hr. Grey ribbons indicate the loss of the H3K9me3, and the height of the ribbon is proportional to the number of domains. b, Ribbon plot showing the different kinetics of H3K9me3 decay at each H3K9me3 alluvial cluster. The ribbon represents the standard deviations of the H3K9me3 signals from the mean value at each cluster. c, Boxplots showing the distributions of H3K9me3 decay constant at different H3K9me3 clusters: early (n=1498), intermediate (n=30660), late (n=8772), and residual (n=1960). The boxes represent interquartile range (IQR) from 25th to 75th percentile, with the median at the center, and whiskers extending to 1.5 times the IQR from the quartiles. Statistical analysis was performed using Wilcoxon test. P values are 7.1E-86, 1.8E-237 and 3.2E-234. ****, P < 2.22e-16 d, Schematics of mathematical modeling of the H3K9me3 establishment and decay. The K+ is the aggregated rates of the nucleation and spreading of H3K9me3 mark; K- is the aggregated decay rates eroding the H3K9me3. e, Density plots comparing the distributions of observed H3K9me3 decay constant (red) at different H3K9me3 clusters with the simulated H3K9me3 decay constant determined by different K- (grey). Note that there are two sub-clusters in the slow- cluster fitted with different K- parameters. f, Heatmap of the 16-state ChromHMM model parameters (state numbers on the left). Columns indicate the enrichments of different chromatin features at each chromatin state. Note that H3K9me3-heterochromatin (first column) are partitioned in chromatin states 1–4. g, Jaccard enrichment scores of heterochromatin states 1–4 at H3K9me3 domains with different ranges of decay rates. h, Heatmap showing the enrichments of each H3K9me3 clusters at different chromatin states. The percentage of each state in the mouse genome is indicated in the first column. Source numerical data are available in Source data.
Fig. 4:
Fig. 4:. Maintaining heterochromatin integrity involves a threshold level of H3K9me3 and HP1
a,b, Scatter plots showing the signals of HP1β (a) and H3K9me3 (b) vs. ATAC peaks within the H3K9me3 domains at 0 hr, 3 hr, and 12 hr of degradation. Boxplots on the top and on the right of the scatter plots are the distributions of ATAC signals (n=16783) and HP1β signals (a, n=12505) or H3K9me3 (b, n=12505), respectively. The black dashed horizontal lines indicate the threshold of complete loss of HP1β (a) or H3K9me3 (b). The red dashed horizontal lines indicate the threshold of HP1β (a) or H3K9me3 (b) signals at which ATAC signals were observed. c, Heatmaps showing ATAC signals within 1 kb window flanking the center of ATAC peaks at different H3K9me3 clusters over the degradation time course. d-g, Supervised heatmaps showing higher H3K9me3 (d) and HP1β (e) signals results in slower kinetics of chromatin opening in ATAC-seq (f) and transcription activation in TT-seq (g) at each H3K9me3 domains at different H3K9me3 clusters over the time course. The H3K9me3 domains within each cluster were ranked in descending order based on H3K9me3 signals at 0h (d), and the same order was applied to the HP1β (e), and ATAC peaks within the H3K9me3 (f) and the nearest transcription units in TT-seq (g). Source numerical data are available in Source data.
Fig. 5:
Fig. 5:. The critical loss of heterochromatin integrity within 12 hr leads to activation of various lineage genes and DNA repeats
a, Heatmaps showing 1055 genes that are significantly activated at different time of KMTs degradation. The values are log2 fold changes of averaged expression level at each time point normalized to 0 hr. b, Heatmap showing the transcriptional changes of different GO functional terms activated over the time course. The values are averages of genes within each GO terms after Z-score transformation. c, Heatmaps showing 8309 transposable elements that are significantly activated at different time of KMTs degradation. The values are log2 fold changes of averaged expression level at each time-point normalized to 0 hr. d, Boxplot showing the distances between activated genes (n=1055) and the nearest activated transposable elements. The boxes represent interquartile range (IQR) from 25th to 75th percentile, with the median at the center, and whiskers extending to 1.5 times the IQR from the quartiles. e, Supervised heatmaps showing on the left, the log2 fold change of 299 genes significantly activated at 12 hr of KMTs degradation (in descending order). The same gene order was applied to heatmap on the right showing the log2 ratio of HP1 TKO/WT mouse ESCs (GSE210606). f, Supervised heatmaps showing on the left, the log2 fold change (in descending order) of 2100 transposable elements significantly activated at 12 hr of KMTs degradation that are also detectable in the published HP1 TKO RNA-seq data (GSE210606). The same order was applied to heatmap on the right showing the log2 ratio of HP1 TKO/WT mouse ESCs. Source numerical data are available in Source data.
Fig. 6:
Fig. 6:. Pioneer factors eliciting further heterochromatin loss after KMTs’ decay
a, Differential analysis of the footprint scores of the transcription factors expressed in mouse ESCs between 24 hr and 0 hr of degradation. The NFYA/B/C, POU, and KLF transcription factors are highlighted. b,c, Scatter and contour plots of signals of H3K9me3 (b) or HP1β (c) in H3K9me3 domains vs. the ATAC peaks within the H3K9me3 domains at 3 hr. The NFYA footprint scores were super-imposed on the dot plots. d, Heatmap showing the nucleosome positioning within 1 kb window flanking the NFYA, OCT4 and KLF4 footprinted motifs over the degradation time-course. Nucleosome positions were inferred from ATAC-seq data using nucleoATAC. e-g, Supervised heatmaps showing NFYA footprint scores ranked based on footprint scores at 48 hr in descending order (e), and the associated ATAC signals (f), and the expression of nearest transcriptional units (g) with the same order over the time course. h, Heatmap showing enrichments of transcription factors-footprinted ATAC peaks in H3K9me3 domains at different ChromHMM states. The percentage of each state in the mouse genome is indicated in the first column. Source numerical data are available in Source data.
Fig. 7:
Fig. 7:. NF-YA acts as pioneer factors to uniquely target MMERVK10C repeat family
a, Western blot of NFYA, and the loading control αTubulin after 3 days of initial siRNA transduction. b, Western blot of H3K9me3, and the loading control histone H3 after 3 days of initial siRNA transductions, followed by the degradation time course. The time (hr) of auxin and dTAG addition are indicated above. Experiments were repeated three times independently with similar results. The molecular weight in KD (kilodaltons) is on the left. Ctrl siRNA, scramble siRNA (a,b). c, Ribbon plots showing the expression of different repeat subfamilies over the degradation course. The lines are the means of TT-seq signal, and ribbons are the distributions of ± one standard deviation from the mean. d, MAFFT alignments of all MMERVK10C-int subfamily sequences (in grey, truncations in white) with ATAC signals (in green, Top) and NFYA, TBP, and ZFX motifs super-imposed on the alignments (below). e, Supervised heatmaps showing TBP footprint scores ranked based on footprint scores at 48 hr in descending order (left) with or without NFYA co-occurrences, the associated ATAC signals (middle), and expression of the nearest transcriptional units (right) with the same order over the time course. f, Bar graph showing RT-qPCR quantification of MMERVK10C transcript levels with NFYA footprints (normalized to housekeeping gene TBP) after 3 days of initial siRNA transductions, followed by dual degrons treatment for 0, 12, 24, and 48 hr; n = 3 biologically independent replicates, values are means ± SEM. Two-sided Student’s t-tests were used for the two conditions. P Values are indicated above each time point. g, Heatmaps showing changes of DNaseI-seq signals from zygote to morula stage of mouse development (GSE76642), within 1 kb window from the center of NFYA footprinted regions at MMERVK10C identified over the degradation time course. h, Heatmap showing expression changes of MMERVK10C with NFYA footprints over the degradation time course during early mouse development (GSE98150). Source numerical data and unprocessed blots are available in Source data.
Fig. 8:
Fig. 8:. H3K9me3-heterochromatin constrains transcription factor Dppa2 to bivalent genes
a, Differential analysis of TT-seq between 24 hr and 0 hr, highlighting DNA repeats and protein coding genes in red and blue, respectively. b, Heatmaps of Dppa2 (GSE117173), H3K4me3 (GSE135841), H3K27me3 (GSE135841) and H3K9me3 (this study) signals within 1kb window flanking the TSS (transcription start sites) of the down-regulated genes in the degradation timecourse. c, Average H3K27me3 signals within 1 kb windows flanking TSS of downregulated genes at 0 hr and 48 hr of degradation. d, Average H3K27me3 signals in wildtype (WT) vs. Dppa2/4 double knockout (DKO) mouse ESCs (GSE135841) within 1kb window flanking the TSS of downregulated genes in the degradation time course. e, Heatmaps of Dppa2 (GSE117173) in wild-type mouse ESCs, ATAC, and H2A.Z in wild-type vs. Dppa2/4 knockout (DKO) mouse ESCs (GSE135841) at Dppa2 peaks inside (top) vs. outside (bottom) the H3K9me3 domains. f, Volcano plot showing differentially expressed transcription units after 24 hr of degradation, with Dppa2 targets highlighted in blue (protein coding genes) and red (DNA repeats). g, Supervised heatmaps of log2 fold changes of Dppa2 footprint scores ranked in descending order based on the 48 hr time point (left), the associated ATAC signals (middle), and the expression of the nearest transcriptional units (right) with the same order. The annotations on the left of the heatmap indicate whether the ATAC peaks directly overlap with the H3K9me3 domains, and whether the transcription units are DNA repeats or protein coding genes. h, Western blot of Dppa2, and the loading control αTubulin after 3 days of siRNA transductions. Experiments were repeated three times independently with similar results. The molecular weight in KD (kilodaltons) is on the left. e. Bar graph comparing Dppa2 footprinted L1Md_T LINE1 subfamily transcript (left) or total LINE1 transcript levels (right) over 3 days of degradation time course with or without Dppa2 depletion. n = 3 biologically independent replicates, values are means ± SEM. Two-sided Student’s t-tests were used for the two conditions. P Values at each time are indicated above the graph. Source numerical data and unprocessed blots are available in Source data.

References

    1. McCarthy R.L., Zhang J. & Zaret K.S. Diverse heterochromatin states restricting cell identity and reprogramming. Trends in biochemical sciences (2023). - PMC - PubMed
    1. Matsui T. et al. Proviral silencing in embryonic stem cells requires the histone methyltransferase ESET. Nature 464, 927–931 (2010). - PubMed
    1. Dodge J.E., Kang Y.K., Beppu H., Lei H. & Li E. Histone H3-K9 methyltransferase ESET is essential for early development. Molecular and cellular biology 24, 2478–2486 (2004). - PMC - PubMed
    1. Nicetto D. et al. H3K9me3-heterochromatin loss at protein-coding genes enables developmental lineage specification. Science 363, 294–297 (2019). - PMC - PubMed
    1. Tsumura A. et al. Maintenance of self-renewal ability of mouse embryonic stem cells in the absence of DNA methyltransferases Dnmt1, Dnmt3a and Dnmt3b. Genes Cells 11, 805–814 (2006). - PubMed

Methods-only references

    1. Czechanski A. et al. Derivation and characterization of mouse embryonic stem cells from permissive and nonpermissive strains. Nature protocols 9, 559–574 (2014). - PMC - PubMed
    1. Nora E.P. et al. Targeted Degradation of CTCF Decouples Local Insulation of Chromosome Domains from Genomic Compartmentalization. Cell 169, 930–944 e922 (2017). - PMC - PubMed
    1. Gagnon K.T., Li L., Janowski B.A. & Corey D.R. Analysis of nuclear RNA interference in human cells by subcellular fractionation and Argonaute loading. Nature protocols 9, 2045–2060 (2014). - PMC - PubMed
    1. Sidoli S., Bhanu N.V., Karch K.R., Wang X. & Garcia B.A. Complete Workflow for Analysis of Histone Post-translational Modifications Using Bottom-up Mass Spectrometry: From Histone Extraction to Data Analysis. Journal of visualized experiments : JoVE (2016). - PMC - PubMed
    1. MacLean B. et al. Skyline: an open source document editor for creating and analyzing targeted proteomics experiments. Bioinformatics 26, 966–968 (2010). - PMC - PubMed

Publication types