[Preprint]. 2024 Sep 21:2024.09.16.613347.
doi: 10.1101/2024.09.16.613347.

Fibroblasts Regulate the Transformation Potential of Human Papillomavirus-positive Keratinocytes

Affiliations

Fibroblasts Regulate the Transformation Potential of Human Papillomavirus-positive Keratinocytes

Claire D James et al. bioRxiv. .

Update in

Abstract

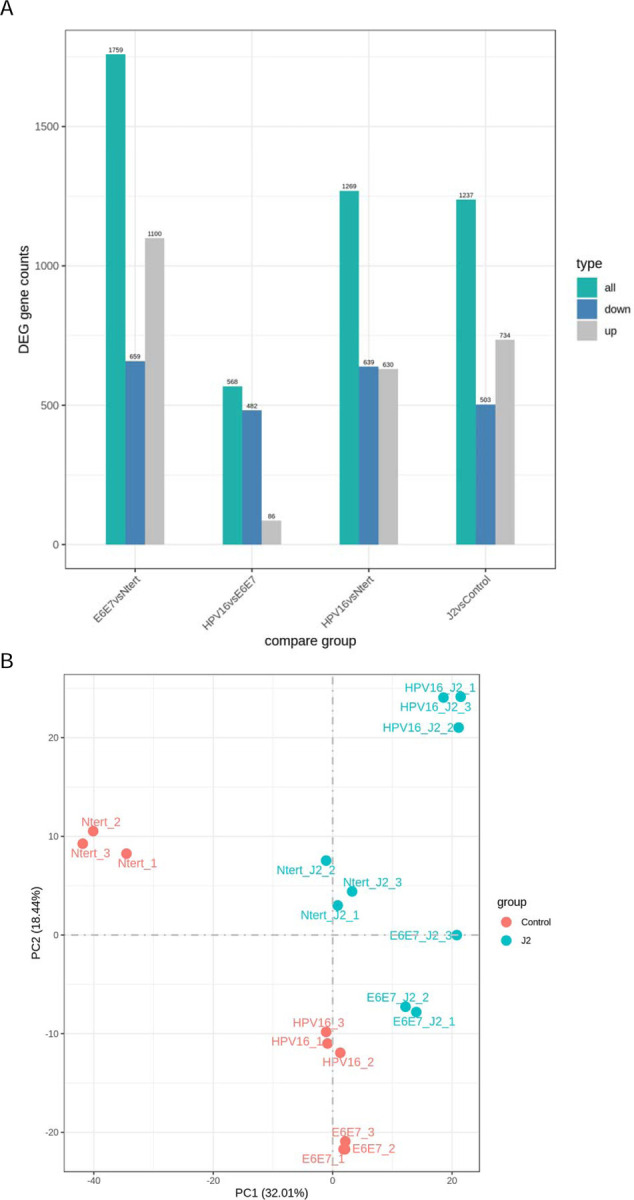
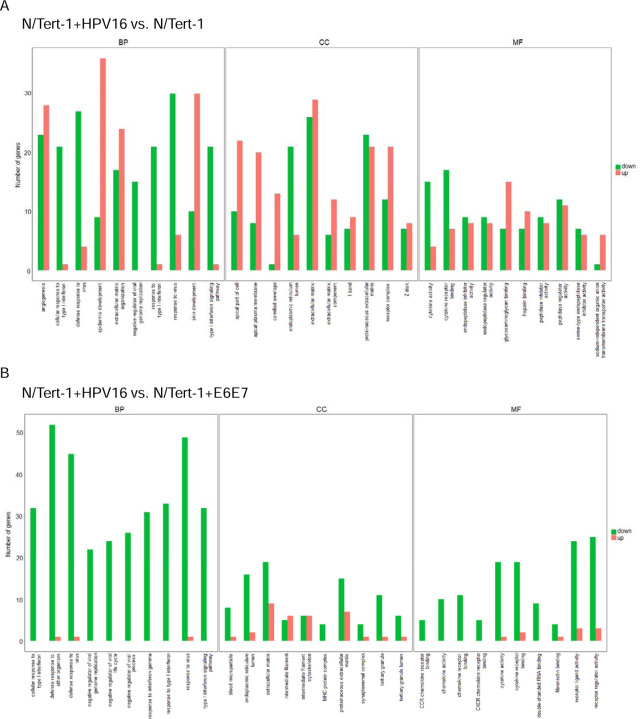
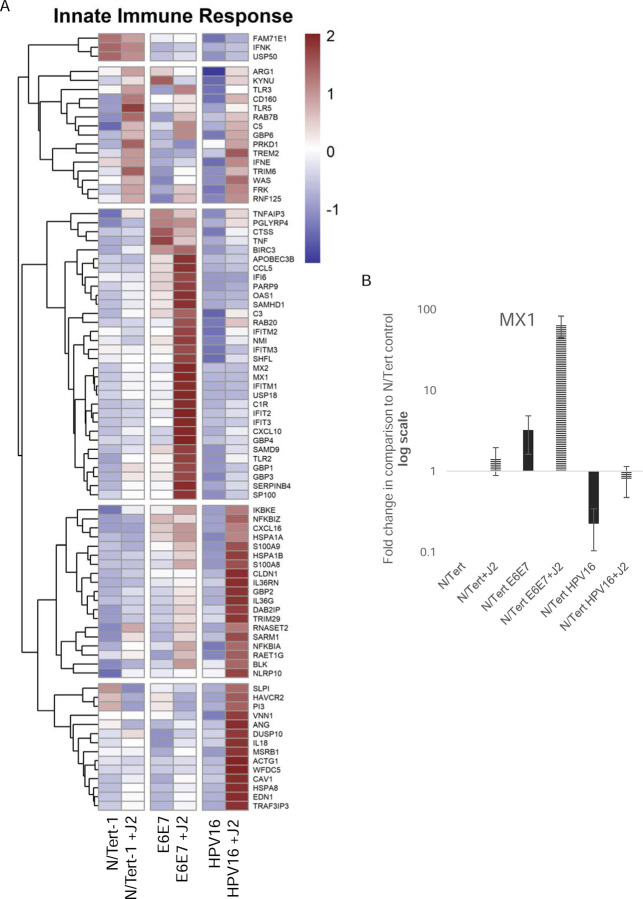
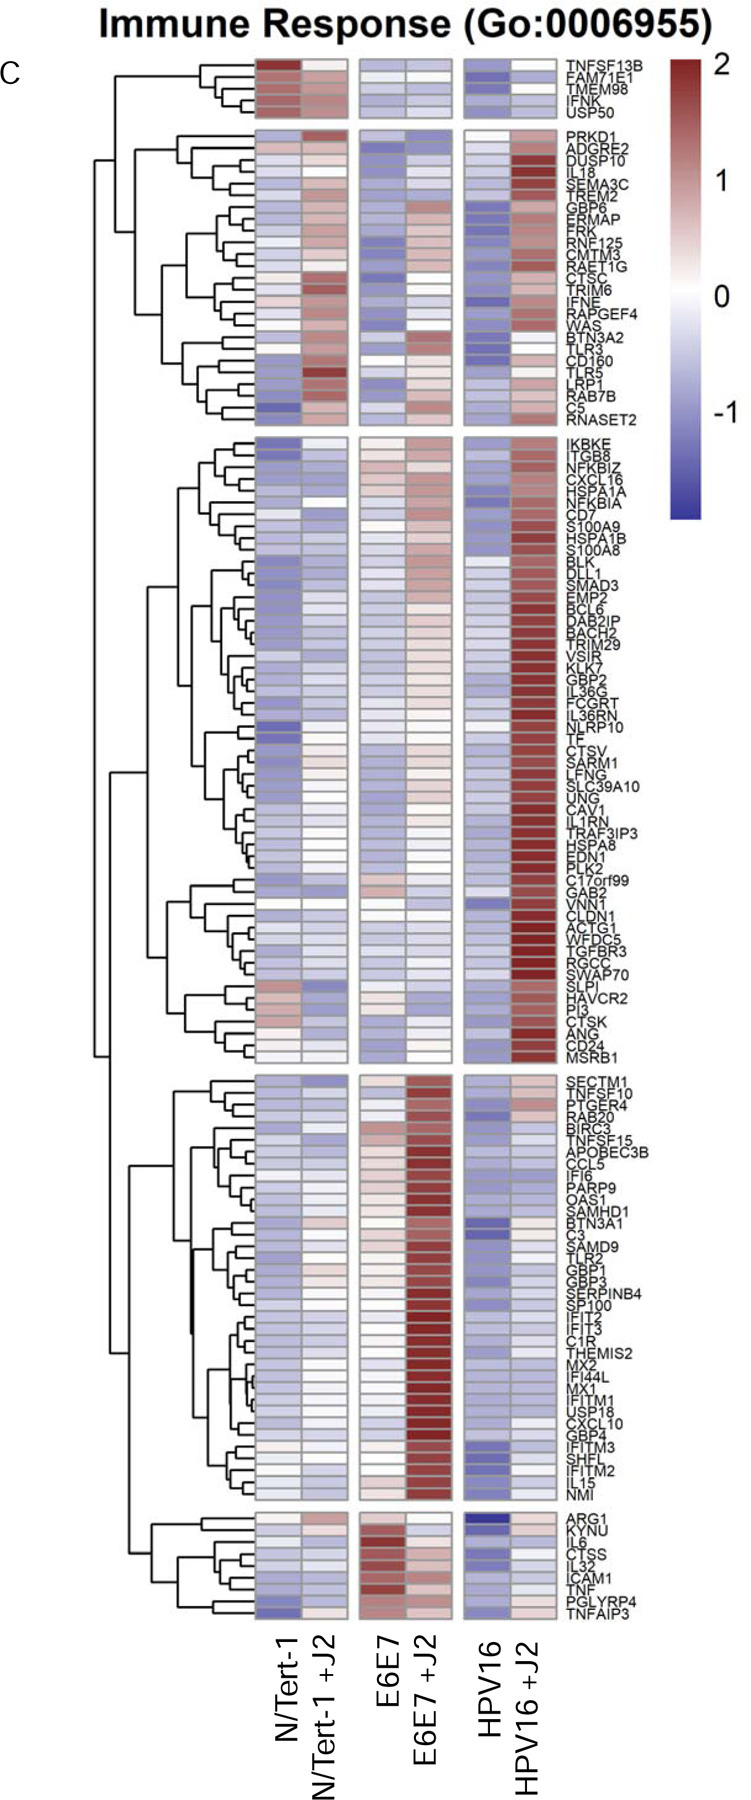
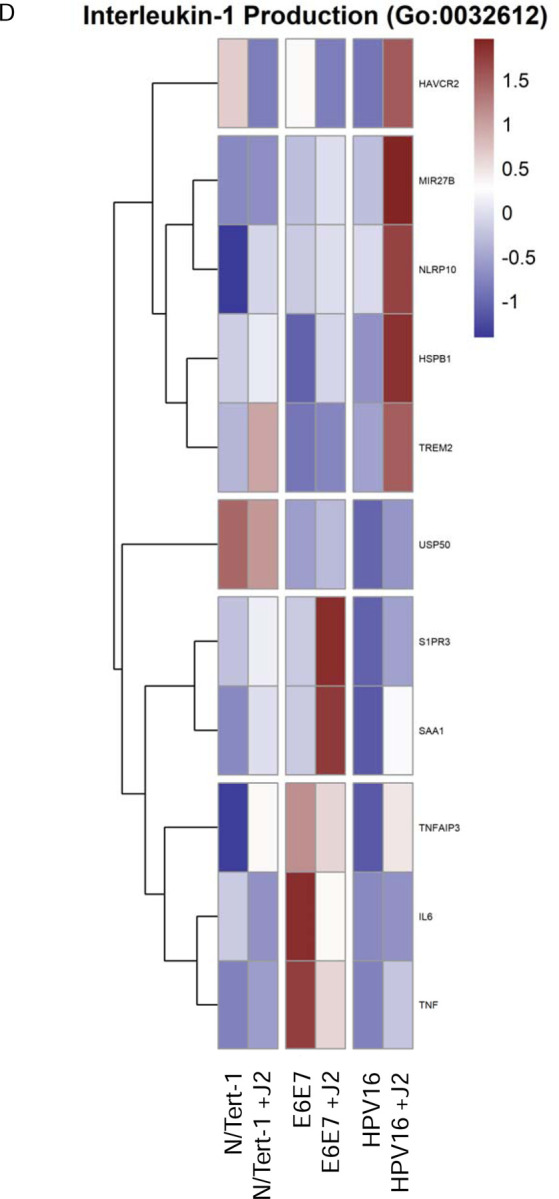
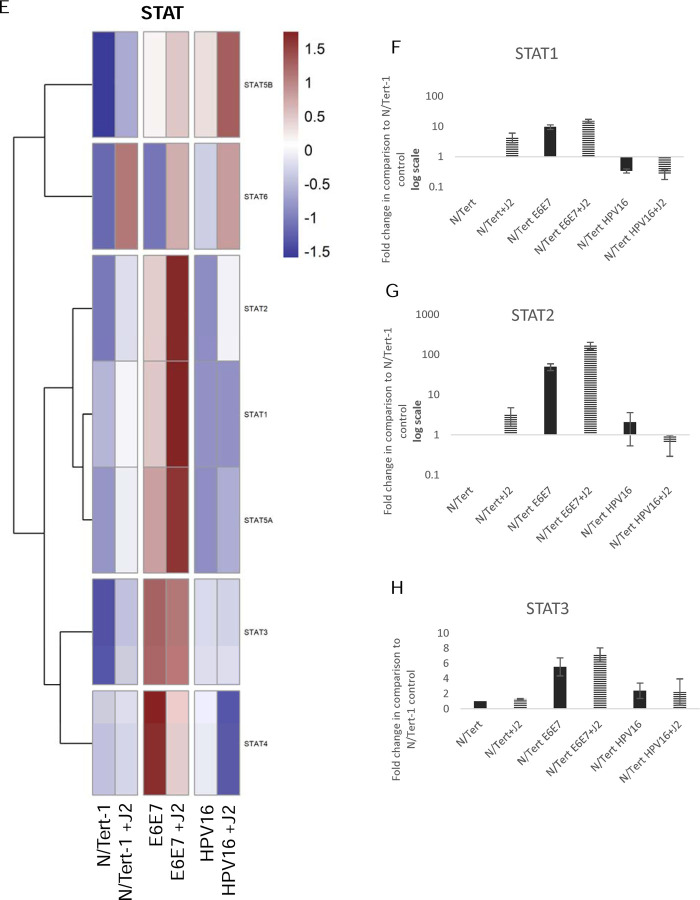
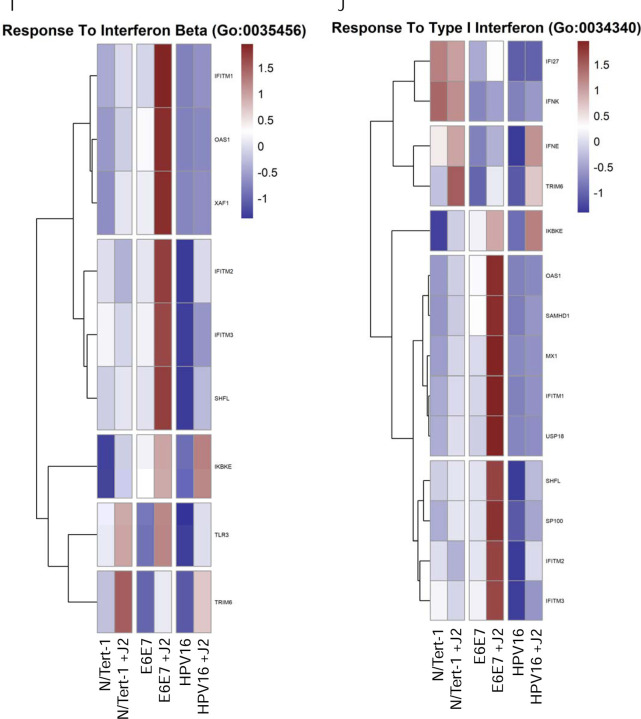
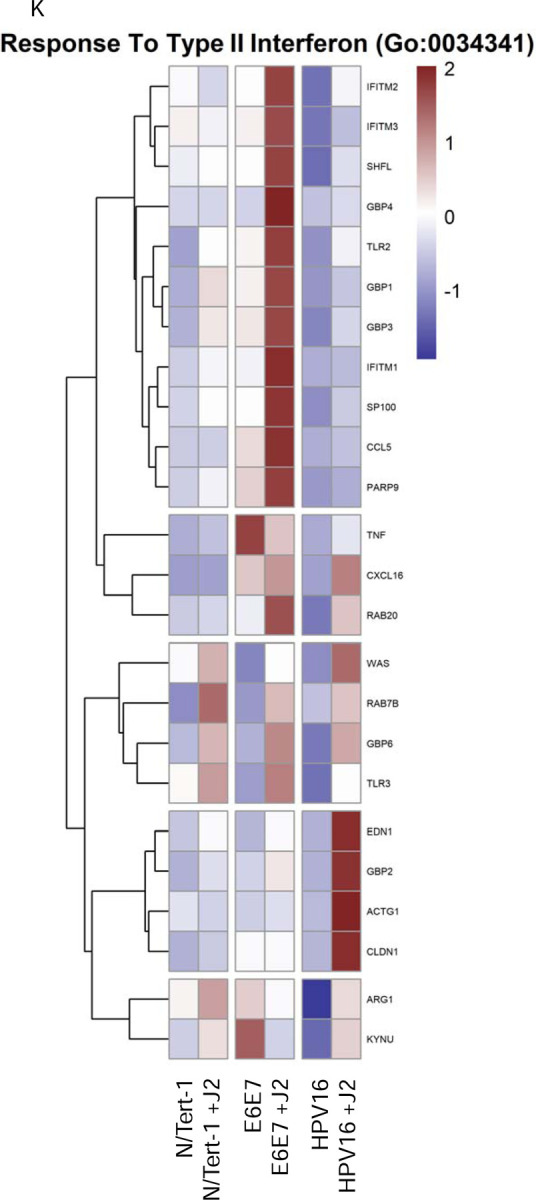
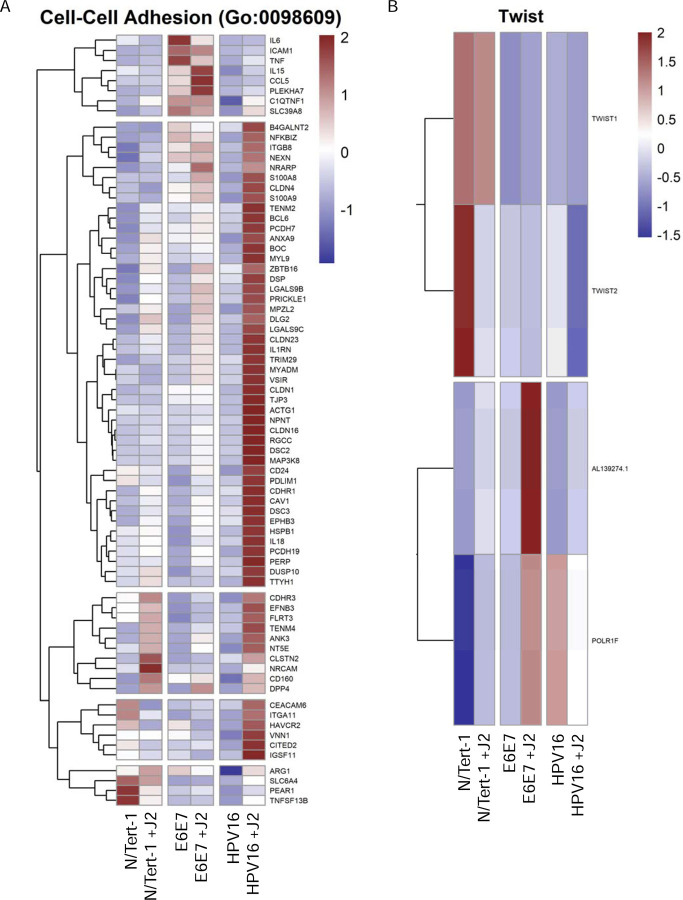
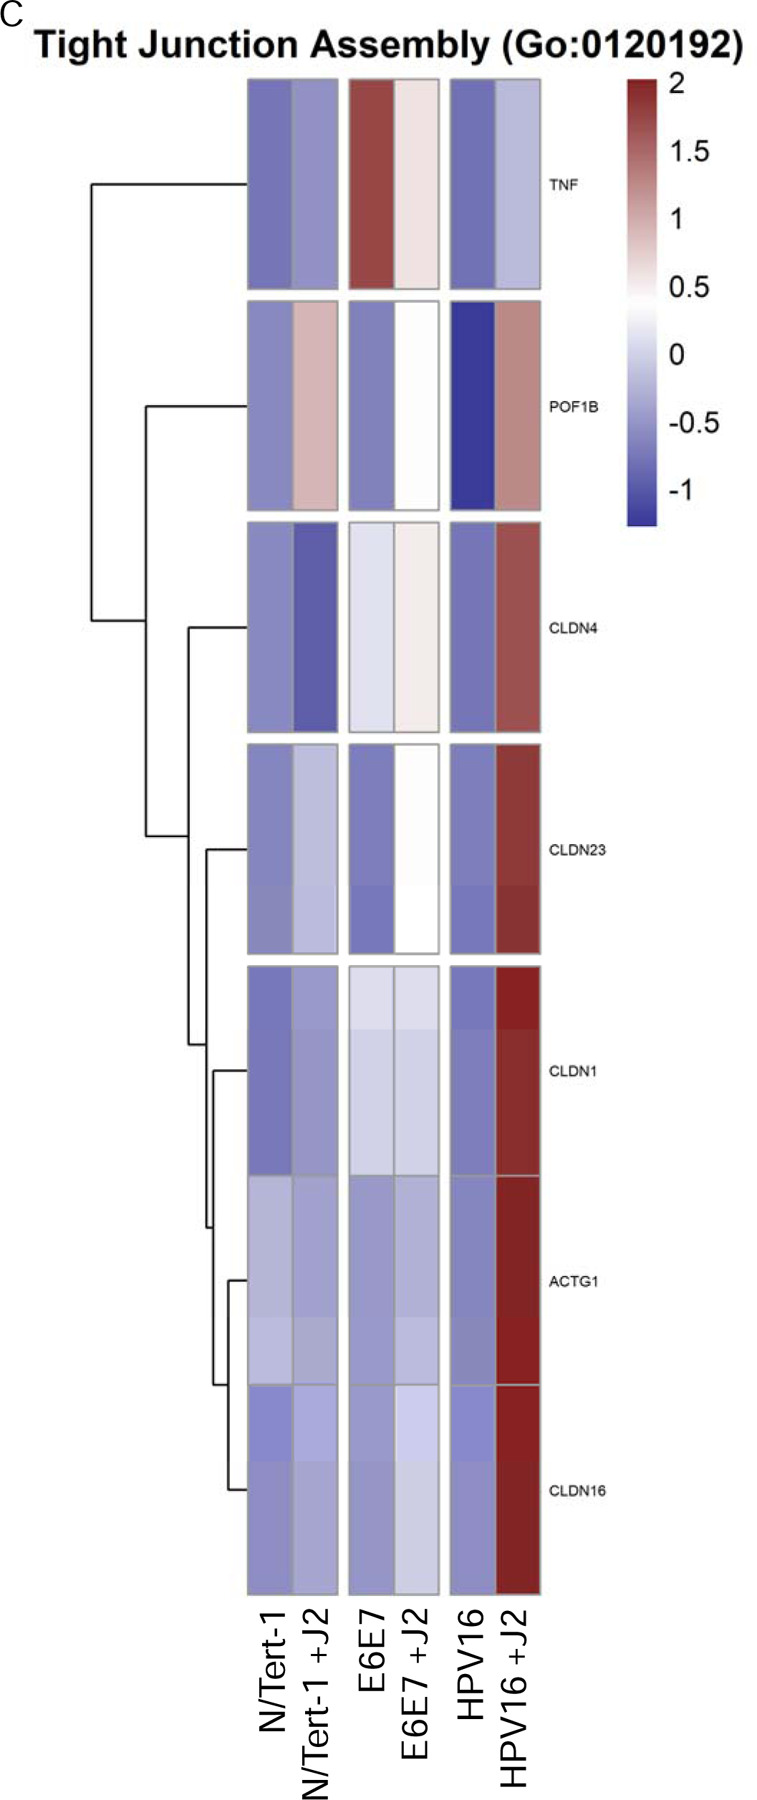
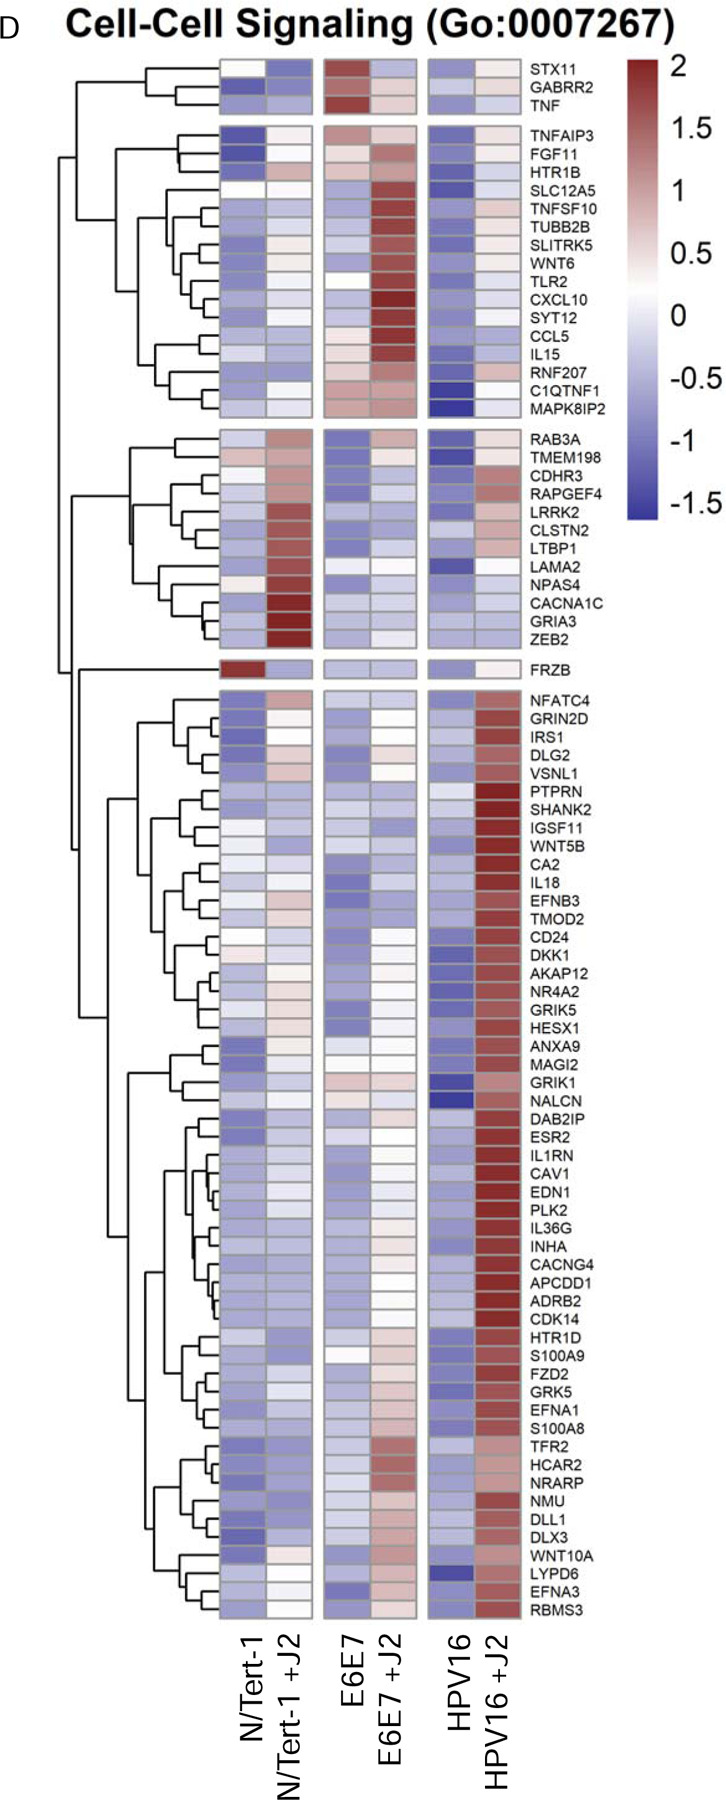
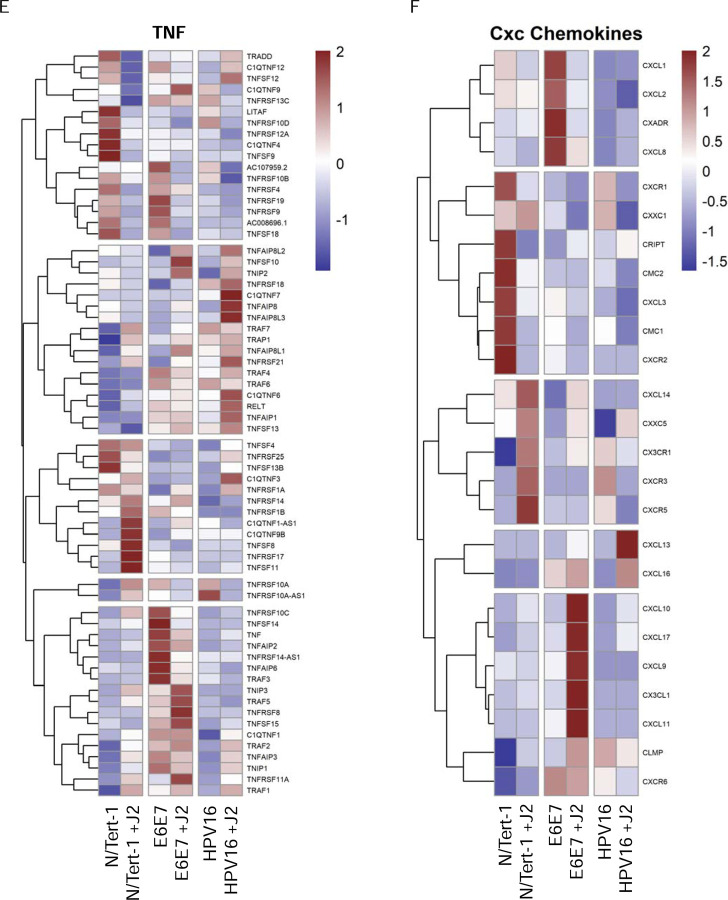
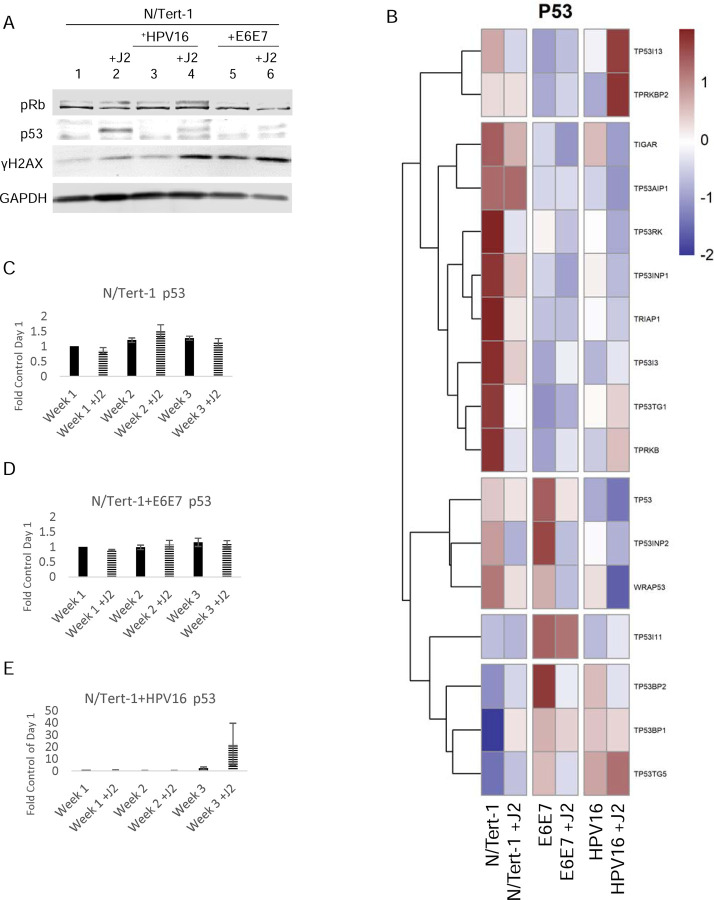
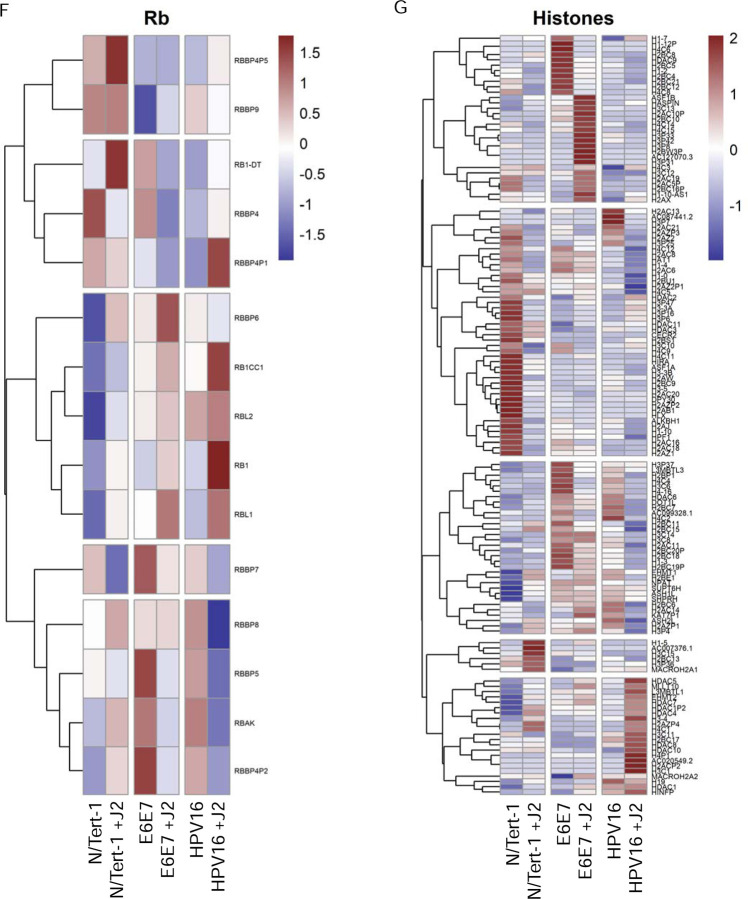
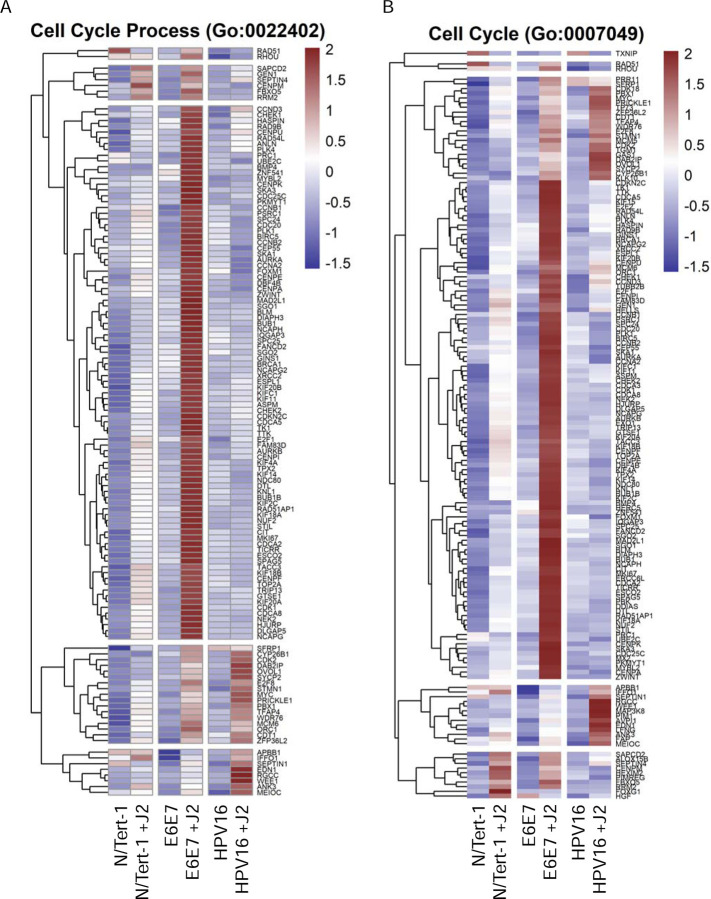
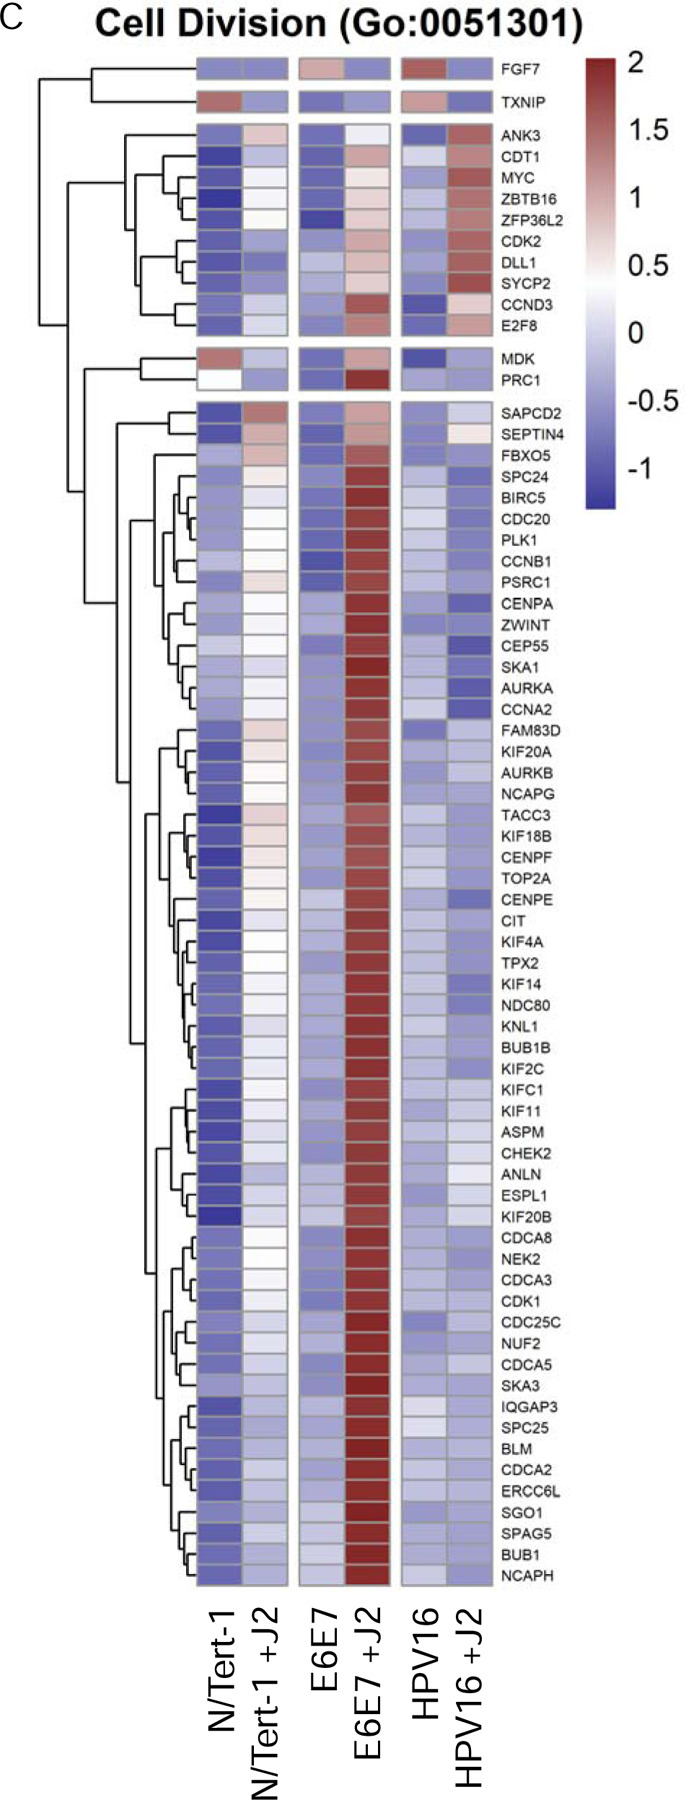
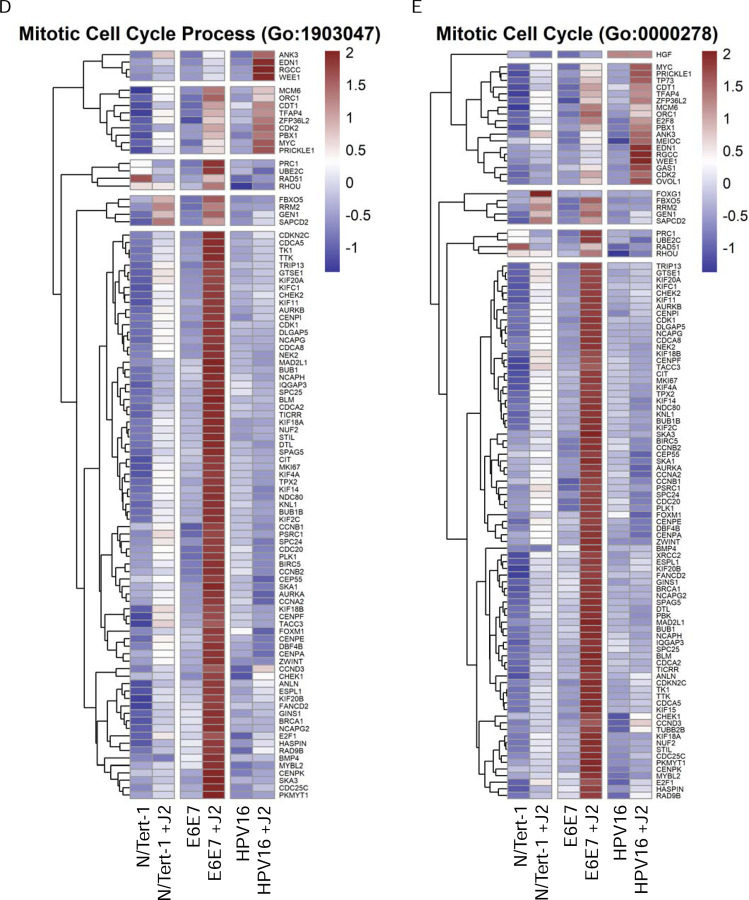
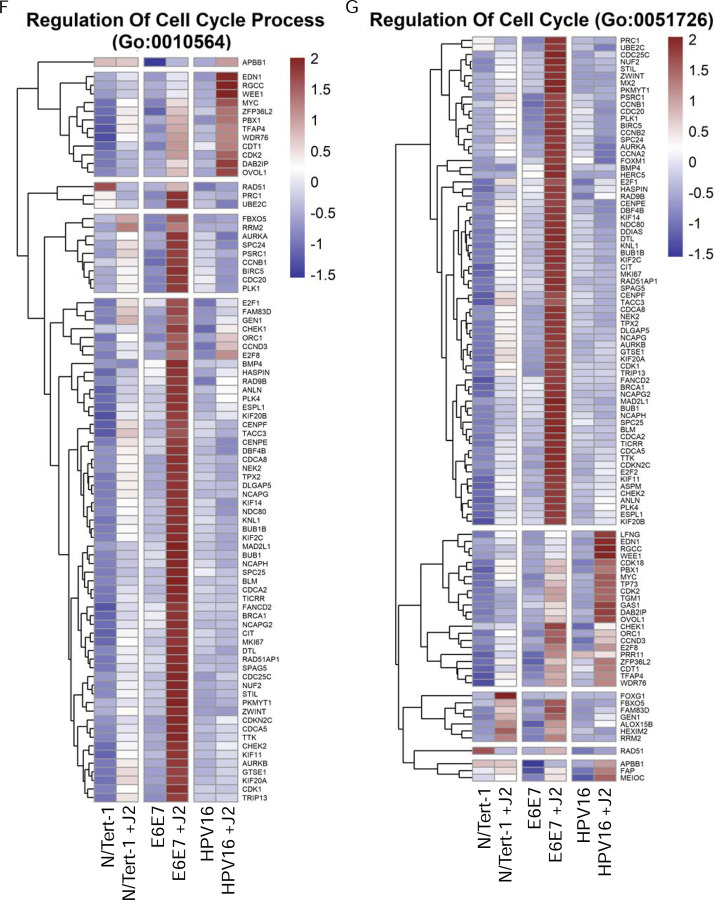
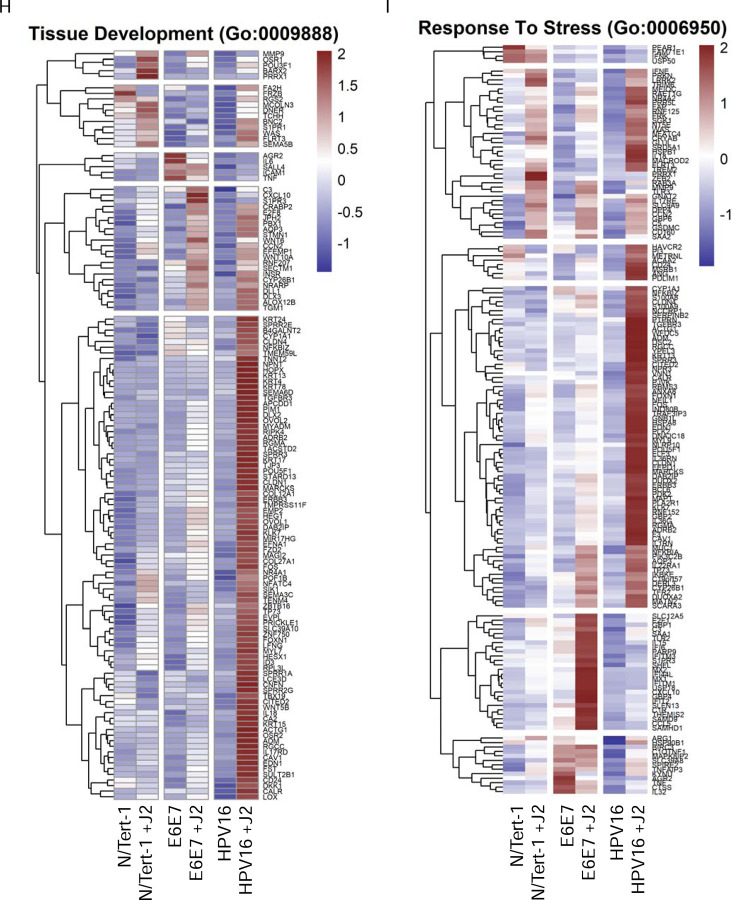
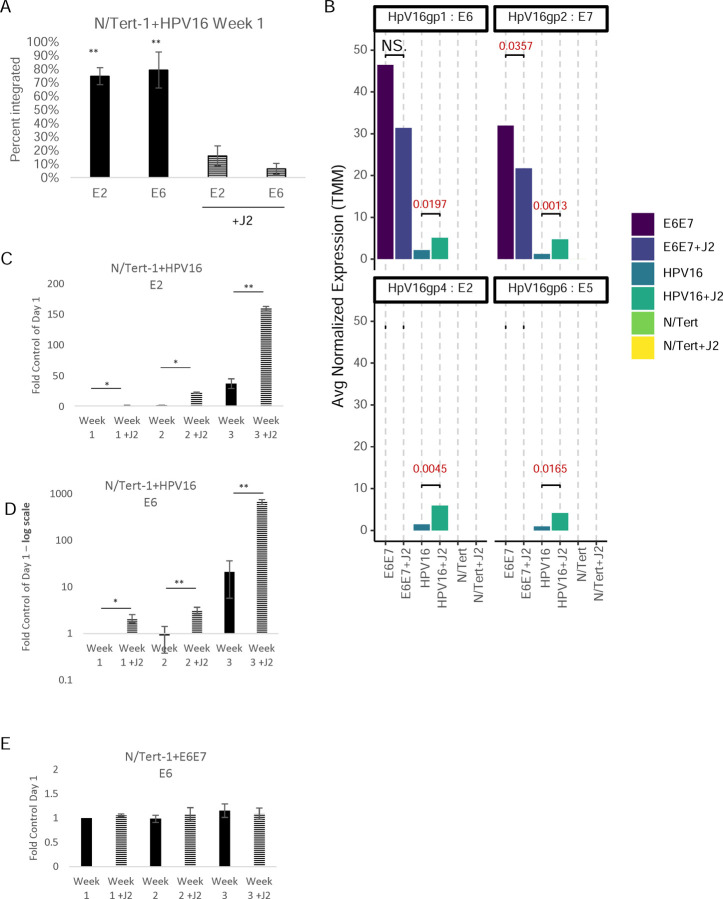
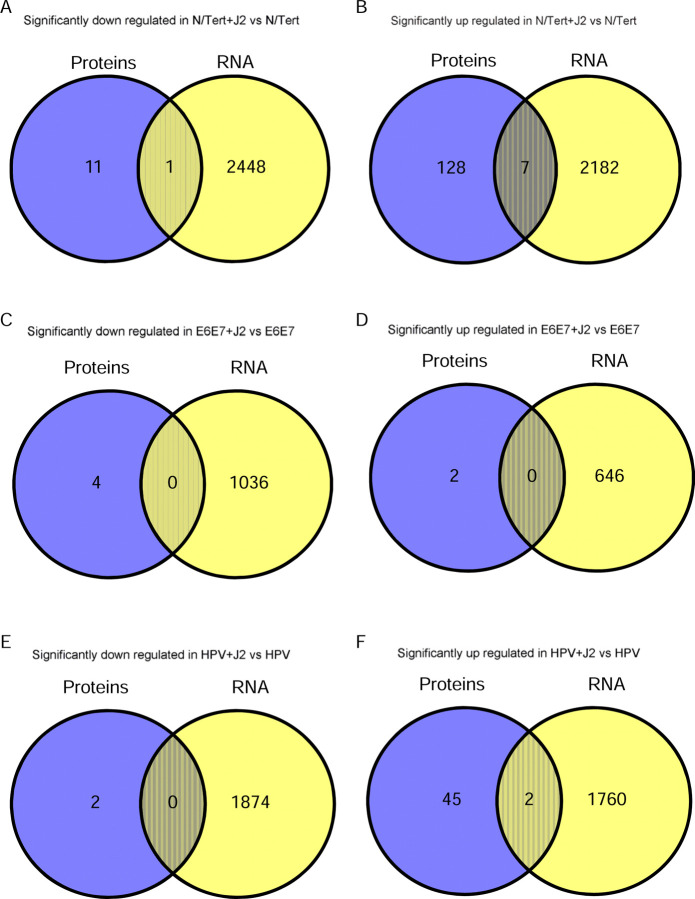
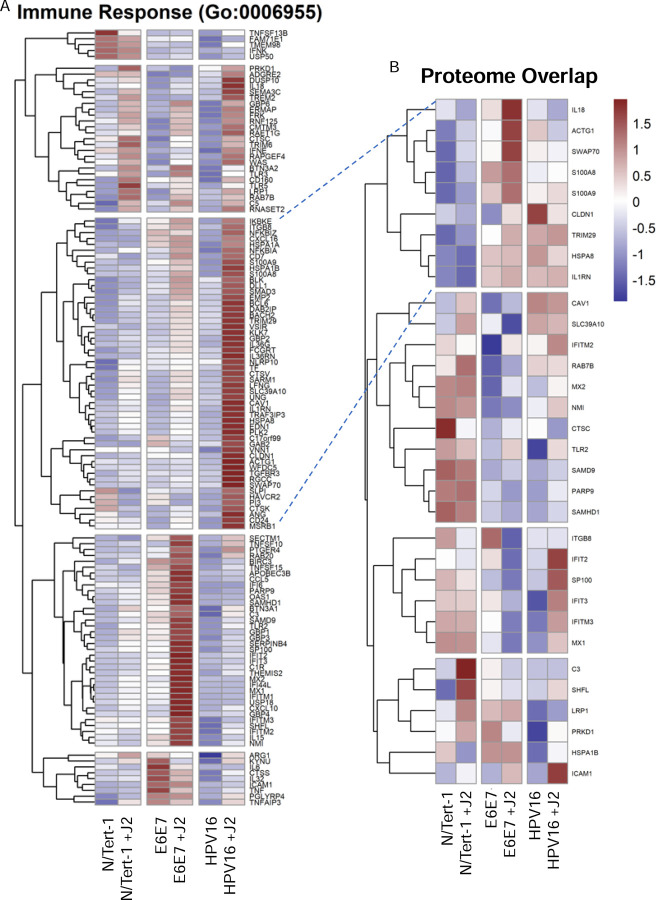
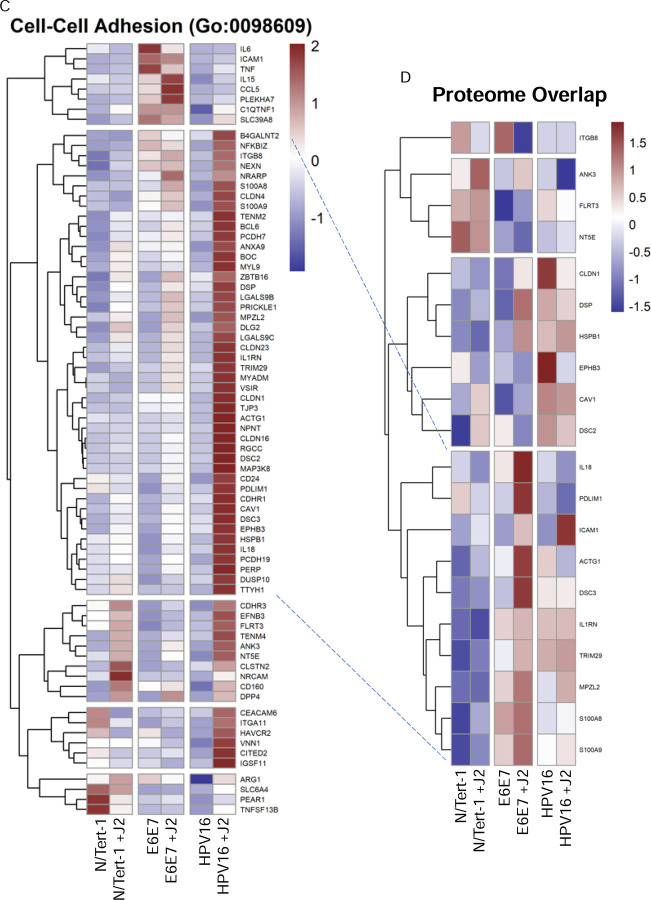
Persistent human papillomavirus (HPV) infection is necessary but insufficient for viral oncogenesis. Additional contributing co-factors, such as immune evasion and viral integration have been implicated in HPV-induced cancer progression. It is widely accepted that HPV+ keratinocytes require co-culture with fibroblasts to maintain viral episome expression, yet the exact mechanisms for this have yet to be elucidated. Here we present comprehensive RNA sequencing and proteomic analysis demonstrating that fibroblasts not only support the viral life cycle, but reduce HPV+ keratinocyte transformation. Our co-culture models offer novel insights into HPV-related transformation mechanisms.

Keywords: HPV; fibroblasts; human papillomavirus; microenvironment; oropharyngeal cancer; stroma; transformation.


Figures

Figure 1.
Figure 1.. Global comparison of RNA-seq.
1A. RNA-seq differential expression (DEG) analysis histogram comparison of the number of significant differential genes (including up-regulation and down-regulation) for each combination. 1B. Principal component analysis (PCA) analysis on the gene expression value (FPKM) of all samples.
Figure 2.
Figure 2.. Gene ontology (GO) enrichment analysis histograms demonstrate differential regulation between N/Tert-1 cell lines and between mono vs co-culture.
The 30 most significantly GO terms are displayed. All Terms are separated according to major categories of biological processes (BP), cell components (CC), molecular functions (MF) and categories of upregulated and downregulated expression of noted GO. 2A. Grouped N/Tert-1+HPV16 are compared to Grouped N/Tert-1. 2B. Grouped N/Tert-1+HPV16 are compared to Grouped N/Tert-1+E6E7. 2C. Grouped N/Tert-1+E6E7 are compared to Grouped N/Tert-1. 2D. Grouped fibroblast co-culture cell line sets (J2) are compared to Grouped mono-culture cell line sets (Control).
Figure 3.
Figure 3.. Fibroblasts differentially regulate GO enrichment in relation to innate immune function.
3A. Heat map demonstrating significant GO:0045087 innate immune regulation across all groups. 3B. qPCR validation of MX1 RNA expression, presented in log scale. 3C. Heat map demonstrating significant GO:0006955 innate immune response across all groups. 3D. Heat map demonstrating significant GO:0032612 interleukin-1 production across all groups. 3E. Heatmap demonstrating significant STAT RNA expression across all groups. 3F. qPCR validation of STAT1 RNA expression, presented in log scale. 3G. qPCR validation of STAT2 RNA expression, presented in log scale. 3H. qPCR validation of STAT3 RNA expression. 3I. Heat map demonstrating significant GO:0035456 response to interferon beta across all groups. 3J. Heat map demonstrating significant GO:0034340 response to type I interferon across all groups. 3K. Heat map demonstrating significant GO:0034341 response to type II interferon across all groups.
Figure 4.
Figure 4.. Fibroblasts differentially regulate GO enrichment in relation to cell signaling and epithelial-to-mesenchymal (EMT) progression.
4A. Heat map demonstrating significant GO:0098609 cell-cell adhesion across all groups. 4B. Heatmap demonstrating significant TWIST RNA expression across all groups. 4C. Heat map demonstrating significant GO:0120192 tight junction assembly across all groups. 4D. Heat map demonstrating significant GO:0007267 cell-cell signaling across all groups. 4E. Heat map demonstrating significant GO:0033209 TNF across all groups. 4F. Heat map demonstrating significant CXC chemokines across all groups.
Figure 5
Figure 5. Fibroblasts differentially regulate p53, pRb, and histone related expression.
5A. N/Tert-1 (lanes 1,2) N/Tert-1+E6E7 (lanes 3,4), N/Tert-1+HPV16 (lanes 5,6) cells were seeded on day 0 and grown in the presence or absence of J2s for 1 week. Cells were washed to remove J2s in noted conditions, trypsinized, lysed, and analyzed via western blotting for pRb, p53, and γH2AX. GAPDH was utilized as a loading control. 5B. Heat map demonstrating significant p53 GO enrichment all groups. 5C. N/Tert-1, 5D. N/Tert-1+E6E7, and 5E. N/Tert-1+HPV16 were grown in the presence or absence of J2s for 3 weeks. Time course of p53 RNA is presented at fold control of day 1. 5F. Heat map demonstrating significant pRb RNA enrichment all groups. 5G. Heat map demonstrating significant histone RNA enrichment in all groups.
Figure 6.
Figure 6.. Fibroblasts differentially regulate cell cycle, tissue development, and stress response related GO enrichment.
6A. Heat map demonstrating significant GO:0022402 cell cycle progression across all groups. 6B. Heat map demonstrating significant GO:0007049 cell cycle across all groups. 6C. Heat map demonstrating significant GO:0051301 cell division across all groups. 6D. Heat map demonstrating significant GO:1903047 mitotic cell cycle progress across all groups. 6E. Heat map demonstrating significant GO:0000278 mitotic cell cycle across all groups. 6F. Heat map demonstrating significant GO:0010564 regulation of cell cycle process across all groups. 6G. Heat map demonstrating significant GO:0051726 regulation of cell cycle across all groups. 6H. Heat map demonstrating significant GO:0009888 tissue development across all groups. 6I. Heat map demonstrating significant GO:0006950 response to stress across all groups.
Figure 7.
Figure 7.. Fibroblasts support viral RNA expression and episomal maintenance in HPV+keratinocytes.
7A. N/Tert-1+HPV16 cells were grown in the presence or absence of J2s for 1 week. Cells were washed to removed J2, then lysed and analyzed for DNA expression of E2 and E6 via the exonuclease V assay, in comparison to GAPDH and mitochondrial DNA controls. Results are presented as percent integration as calculated from the cut ratio of matched GAPDH. **P < 0.01. 7B. Differential expression data from RNAseq from average normalized reads of E6, E7, E2, and E5 matched to HPV reference genome. Exact significance is presented for each (student’s t-test), NS represents no significance. 7C-E. qPCR time course validation of E2 and E6 RNA expression in N/Tert-1+E6E7 and N/Tert-1+HPV16 in the presence or absence of J2 for 3 weeks, 7D is presented in log scale. *P < 0.05. **P < 0.01.
Figure 8.
Figure 8.. Differential expression Venn diagrams comparing significant up or down regulation via fibroblasts in RNA-seq and proteomic analysis.
The sum of all the numbers in the circle represents the total number in the compared groups, and the overlapping area indicates the number of differential genes shared between the groups, as shown in the following figures. 8A,B. Cross comparison of N/Tert-1 downregulation, and upregulation, respectively via fibroblasts. 8C,D. Cross comparison of N/Tert-1+E6E7 downregulation, and upregulation, respectively via fibroblasts. 8E,F. Cross comparison of N/Tert-1+HPV16 downregulation, and upregulation, respectively via fibroblasts.
Figure 9.
Figure 9.. RNA-seq and proteomic cross comparisons demonstrate fibroblasts differentially regulate GO enrichment in relation to innate immune function and cell-cell adhesion.
9A. Heat map demonstrating significant GO:0006955 immune response across all groups. 9B. Matched heat map analysis of significant proteome alterations of GO:0006955 across all groups. 9C. Heat map demonstrating significant GO:0098609 cell-cell adhesion across all groups. 9D. Matched heat map analysis of significant proteome alterations of GO:0098609 across all groups. Dotted lines are added to help visually compare similar matched sets.

Similar articles

References

    1. Doorbar J, Quint W, Banks L, Bravo IG, Stoler M, Broker TR, et al. The biology and life-cycle of human papillomaviruses. Vaccine 2012;30 Suppl 5:F55–70. 10.1016/j.vaccine.2012.06.083. - DOI - PubMed
    1. Bzhalava D, Eklund C, Dillner J. International standardization and classification of human papillomavirus types. Virology 2015;476:341–4. 10.1016/j.virol.2014.12.028. - DOI - PubMed
    1. Parkin DM, Bray F. Chapter 2: The burden of HPV-related cancers. Vaccine 2006;24 Suppl 3:S3/11–25. 10.1016/j.vaccine.2006.05.111. - DOI - PubMed
    1. Burd EM. Human papillomavirus and cervical cancer. Clin Microbiol Rev 2003;16:1–17. 10.1128/CMR.16.1.1-17.2003. - DOI - PMC - PubMed
    1. Gribb JP, Wheelock JH, Park ES. Human Papilloma Virus (HPV) and the Current State of Oropharyngeal Cancer Prevention and Treatment. Del J Public Health 2023;9:26–8. 10.32481/djph.2023.04.008. - DOI - PMC - PubMed

Publication types

LinkOut - more resources