

Identification of Potential Key Genes for the Comorbidity of Myasthenia Gravis With Thymoma by Integrated Bioinformatics Analysis and Machine Learning
- PMID: 39345724
- PMCID: PMC11437577
- DOI: 10.1177/11779322241281652
Identification of Potential Key Genes for the Comorbidity of Myasthenia Gravis With Thymoma by Integrated Bioinformatics Analysis and Machine Learning
Abstract
Background: Thymoma is a key risk factor for myasthenia gravis (MG). The purpose of our study was to investigate the potential key genes responsible for MG patients with thymoma.
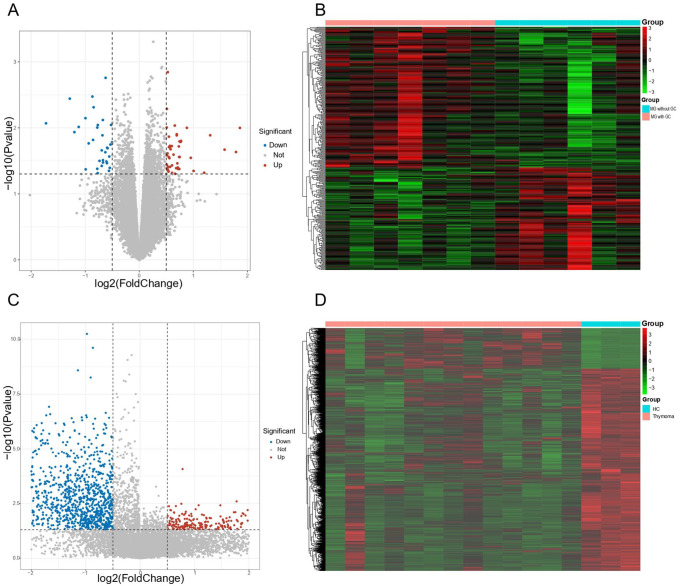
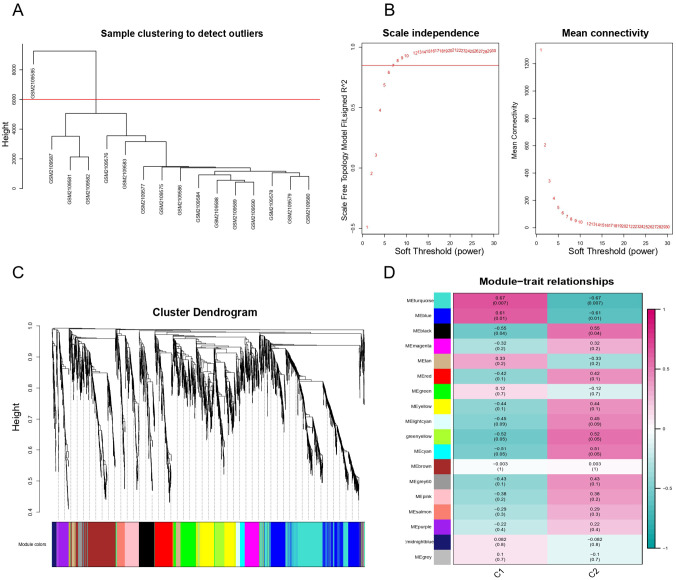
Methods: We obtained MG and thymoma dataset from GEO database. Differentially expressed genes (DEGs) were determined and functional enrichment analyses were conducted by R packages. Weighted gene co-expression network analysis (WGCNA) was used to screen out the crucial module genes related to thymoma. Candidate genes were obtained by integrating DEGs of MG and module genes. Subsequently, we identified several candidate key genes by machine learning for diagnosing MG patients with thymoma. The nomogram and receiver operating characteristics (ROC) curves were applied to assess the diagnostic value of candidate key genes. Finally, we investigated the infiltration of immunocytes and analyzed the relationship among key genes and immune cells.
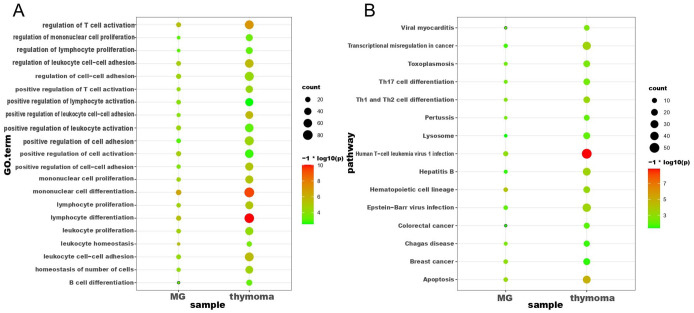
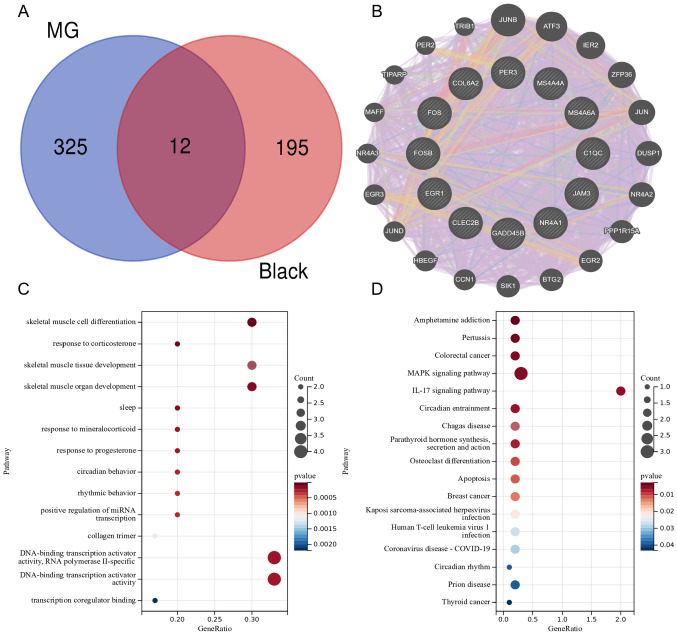
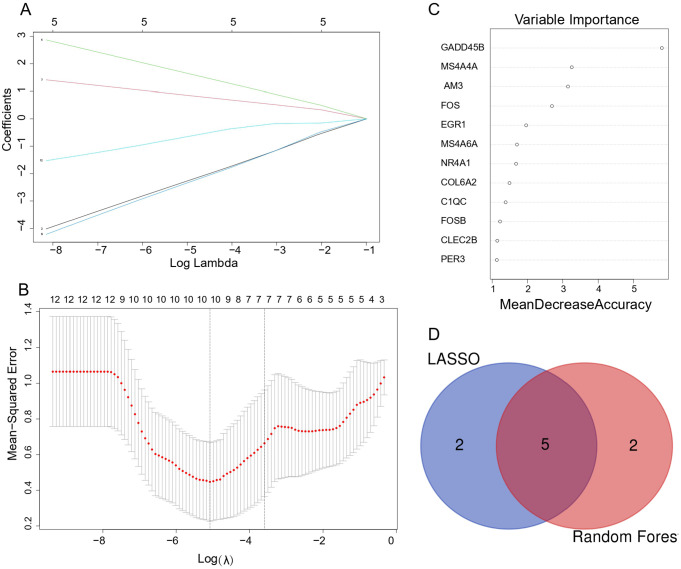
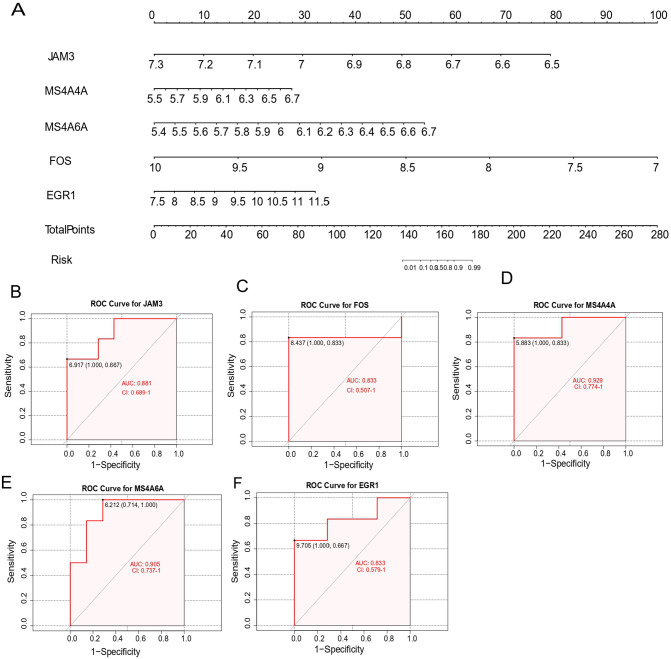
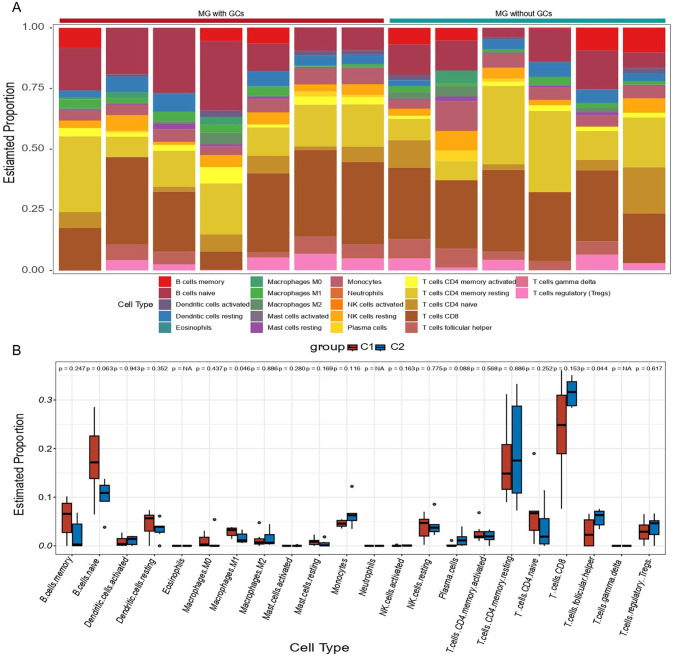
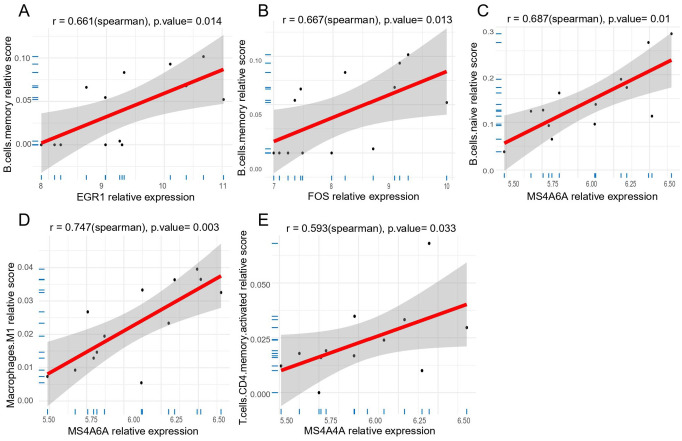
Results: We obtained 337 DEGs in MG dataset and 2150 DEGs in thymoma dataset. Biological function analyses indicated that DEGs of MG and thymoma were enriched in many common pathways. Black module (containing 207 genes) analyzed by WGCNA was considered as the most correlated with thymoma. Then, 12 candidate genes were identified by intersecting with MG DEGs and thymoma module genes as potential causes of thymoma-associated MG pathogenesis. Furthermore, five candidate key genes (JAM3, MS4A4A, MS4A6A, EGR1, and FOS) were screened out through integrating least absolute shrinkage and selection operator (LASSO) regression and Random forest (RF). The nomogram and ROC curves (area under the curve from 0.833 to 0.929) suggested all five candidate key genes had high diagnostic values. Finally, we found that five key genes and immune cell infiltrations presented varying degrees of correlation.
Conclusions: Our study identified five key potential pathogenic genes that predisposed thymoma to the development of MG, which provided potential diagnostic biomarkers and promising therapeutic targets for MG patients with thymoma.
Keywords: Myasthenia gravis; WGCNA; immune infiltration; machine learning; thymoma.
© The Author(s) 2024.
Conflict of interest statement
The author(s) declared no potential conflicts of interest with respect to the research, authorship, and/or publication of this article.
Figures
Similar articles
-
Identification of Immune-Associated Genes in Diagnosing Aortic Valve Calcification With Metabolic Syndrome by Integrated Bioinformatics Analysis and Machine Learning.Front Immunol. 2022 Jul 4;13:937886. doi: 10.3389/fimmu.2022.937886. eCollection 2022. Front Immunol. 2022. PMID: 35865542 Free PMC article.
-
Identification of immune-related genes in diagnosing retinopathy of prematurity with sepsis through bioinformatics analysis and machine learning.Front Genet. 2023 Nov 10;14:1264873. doi: 10.3389/fgene.2023.1264873. eCollection 2023. Front Genet. 2023. PMID: 38028617 Free PMC article.
-
Machine learning algorithms assisted identification of post-stroke depression associated biological features.Front Neurosci. 2023 Mar 8;17:1146620. doi: 10.3389/fnins.2023.1146620. eCollection 2023. Front Neurosci. 2023. PMID: 36968495 Free PMC article.
-
Identifying of immune-associated genes for assessing the obesity-associated risk to the offspring in maternal obesity: A bioinformatics and machine learning.CNS Neurosci Ther. 2024 Mar;30(3):e14700. doi: 10.1111/cns.14700. CNS Neurosci Ther. 2024. PMID: 38544384 Free PMC article.
-
Identification of novel biomarkers and immune infiltration characteristics of ischemic stroke based on comprehensive bioinformatic analysis and machine learning.Biochem Biophys Rep. 2023 Dec 7;37:101595. doi: 10.1016/j.bbrep.2023.101595. eCollection 2024 Mar. Biochem Biophys Rep. 2023. PMID: 38371524 Free PMC article.
References
-
- Gilhus NE. Myasthenia gravis. N Engl J Med. 2016;375:2570-2581. - PubMed
-
- Álvarez-Velasco R, Gutiérrez-Gutiérrez G, Trujillo JC, et al.. Clinical characteristics and outcomes of thymoma-associated myasthenia gravis. Eur J Neurol. 2021;28:2083-2091. - PubMed
-
- Mantegazza R, Bernasconi P, Cavalcante P. Myasthenia gravis: from autoantibodies to therapy. Curr Opin Neurol. 2018;31:517-525. - PubMed
-
- Hehir MK, Silvestri NJ. Generalized myasthenia gravis: classification, clinical presentation, natural history, and epidemiology. Neurol Clin. 2018;36:253-260. - PubMed
LinkOut - more resources
Full Text Sources
