

Transcriptomic Analysis of Cardiac Tissues in a Rodent Model of Coronary Microembolization
- PMID: 39345897
- PMCID: PMC11437660
- DOI: 10.2147/JIR.S469297
Transcriptomic Analysis of Cardiac Tissues in a Rodent Model of Coronary Microembolization
Abstract
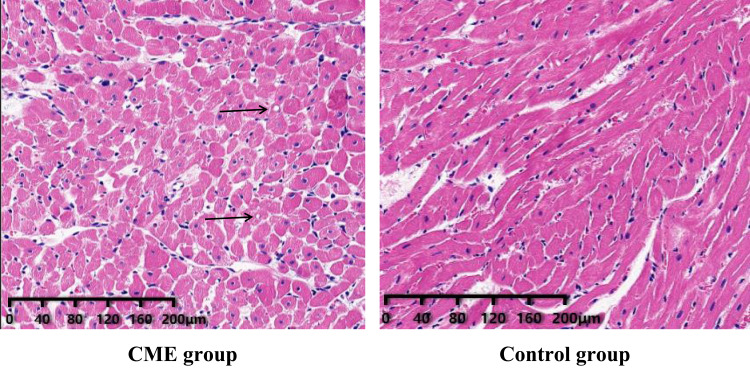
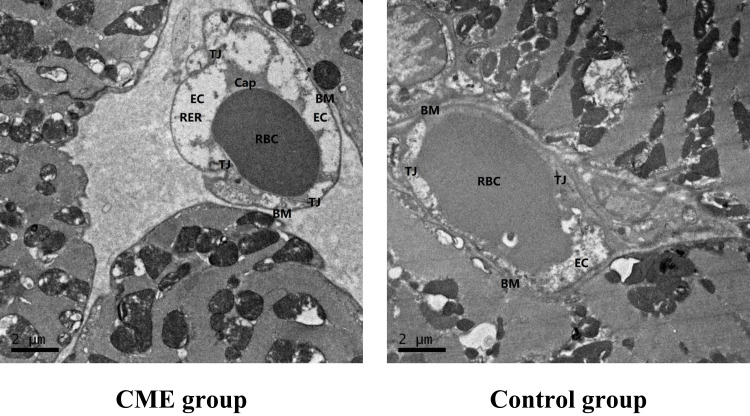
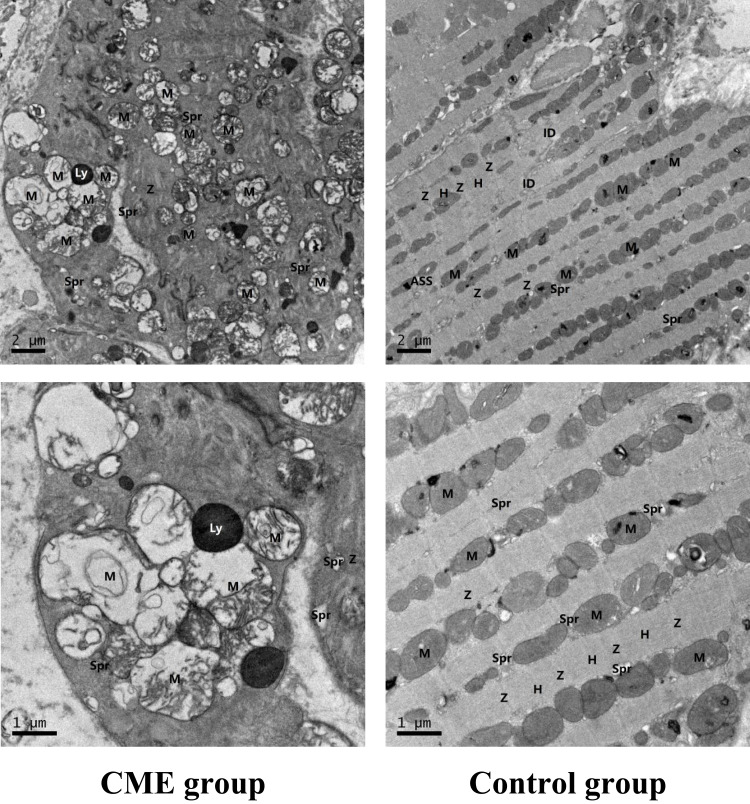
Purpose: Coronary microembolization (CME) can result in cardiac dysfunction, severe arrhythmias, and a reduced coronary flow reserve. Impairment of mitochondrial energy metabolism has been implicated in the progression and pathogenesis of CME; however, its role remains largely undetermined. This study aimed to explore alterations in mitochondria-related genes in CME.
Methods: A rat model of CME was successfully established by injecting plastic microspheres into the left ventricle. The cardiac tissues of the two groups were sequenced and mitochondrial functions were assessed.
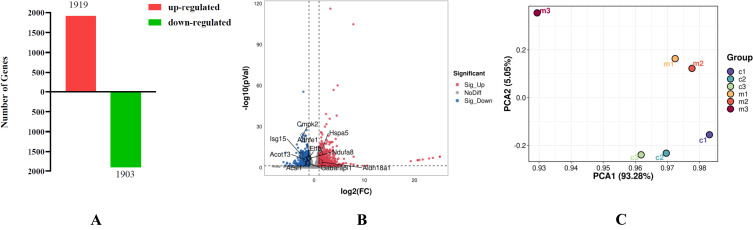
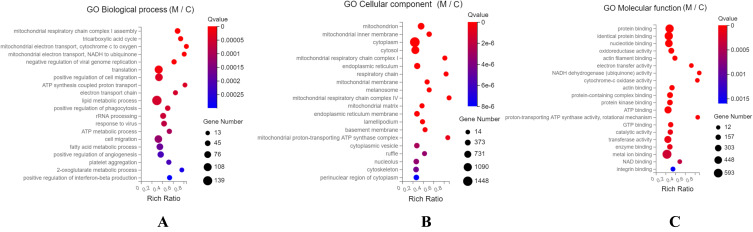
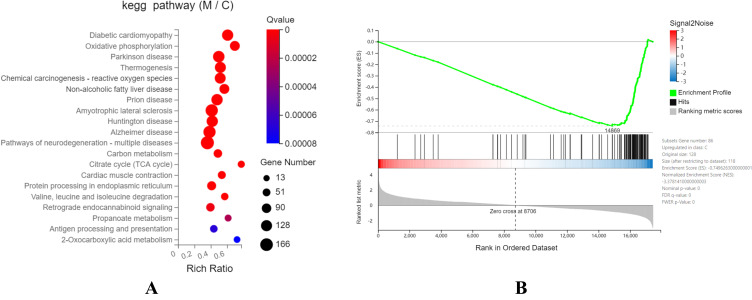
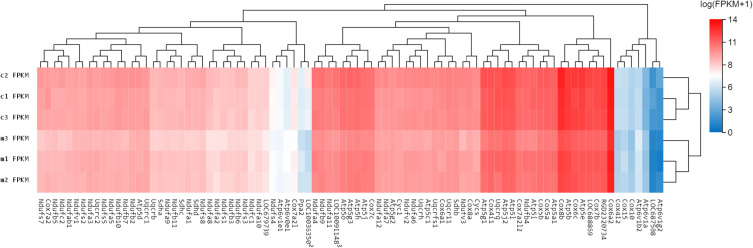
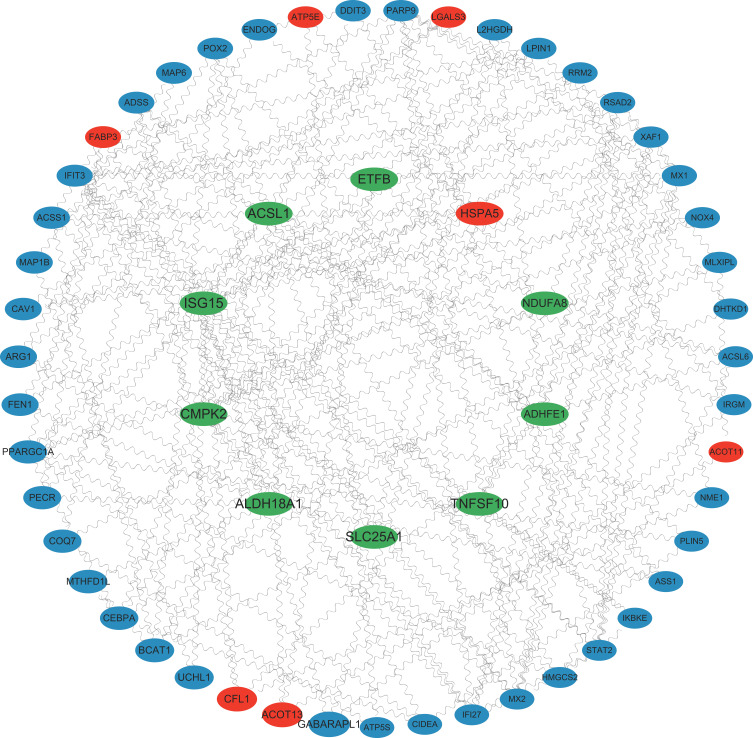
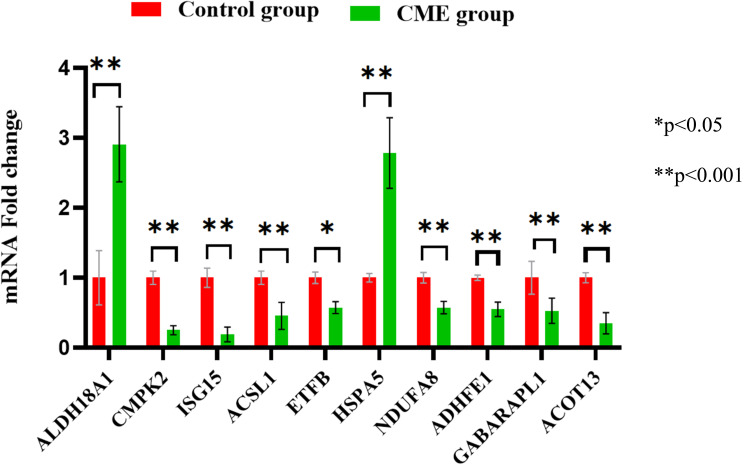
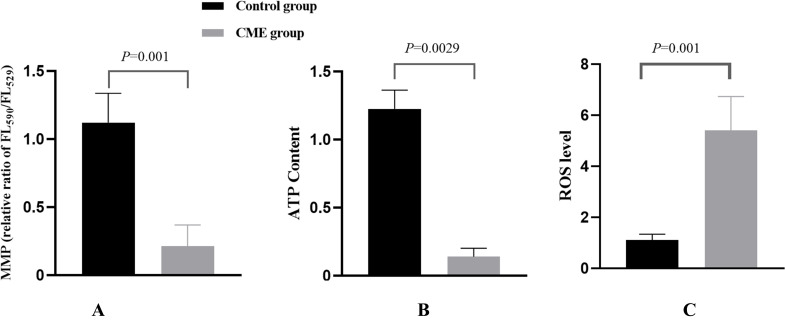
Results: Using RNA-Seq, together with GO and KEGG enrichment analyses, we identified 3822 differentially expressed genes (DEGs) in CME rats compared to control rats, and 101 DEGs were mitochondria-related genes. Notably, 36 DEGs were up-regulated and 65 DEGs were down-regulated (CME vs control). In particular, the oxidative phosphorylation (OXPHOS) and mitochondrial electron transport were obviously down-regulated in the CME group. Functional analysis revealed that CME mice exhibited marked reductions in ATP and mitochondrial membrane potential (MMP), by contrast, the production of reactive oxygen species (ROS) was much higher in CME mice than in controls. Protein-protein interaction (PPI) and quantitative PCR (qPCR) validation suggested that eight hub genes including Cmpk2, Isg15, Acsl1, Etfb, Ndufa8, Adhfe1, Gabarapl1 and Acot13 were down-regulated in CME, whereas Aldh18a1 and Hspa5 were up-regulated.
Conclusion: Our findings suggest that dysfunctions in mitochondrial activity and metabolism are important mechanisms for CME, and mitochondria-related DEGs may be potential therapeutic targets for CME.
Keywords: CME; DEGs; OXPHOS; RNA-Sequence; energy metabolism; rat model.
© 2024 Jiang et al.
Conflict of interest statement
The authors have declared that no competing interests exist.
Figures
References
-
- Morishima I, Sone T, Okumura K, et al. Angiographic no-reflow phenomenon as a predictor of adverse long-term outcome in patients treated with percutaneous transluminal coronary angioplasty for first acute myocardial infarction. J Am Coll Cardiol. 2000;36(4):1202–1209. doi: 10.1016/s0735-1097(00)00865-2 - DOI - PubMed
LinkOut - more resources
Full Text Sources
Miscellaneous
