

Metabolic Reprogramming of CD4+ T Cells by Mesenchymal Stem Cell-Derived Extracellular Vesicles Attenuates Autoimmune Hepatitis Through Mitochondrial Protein Transfer
- PMID: 39345912
- PMCID: PMC11430536
- DOI: 10.2147/IJN.S472086
Metabolic Reprogramming of CD4+ T Cells by Mesenchymal Stem Cell-Derived Extracellular Vesicles Attenuates Autoimmune Hepatitis Through Mitochondrial Protein Transfer
Abstract
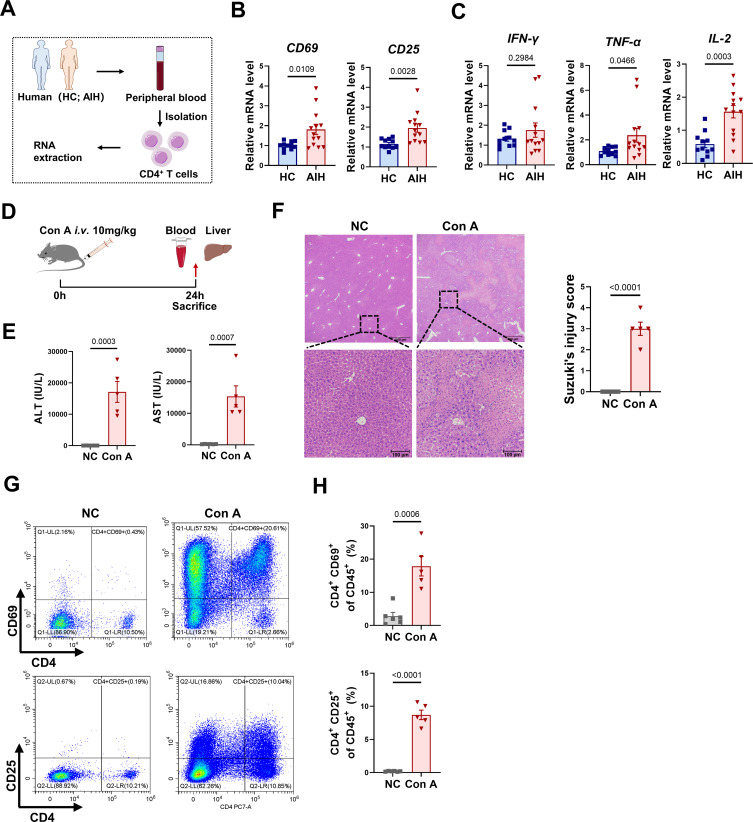
Background: Autoimmune hepatitis (AIH) is a serious liver disease characterized by immune disorders, particularly effector T-cell overactivation. This study aimed to explore the therapeutic effect and underlying mechanism of mesenchymal stem cell-derived extracellular vesicle (MSC-EV) treatment on CD4+ T-cell overactivation and liver injury in AIH.
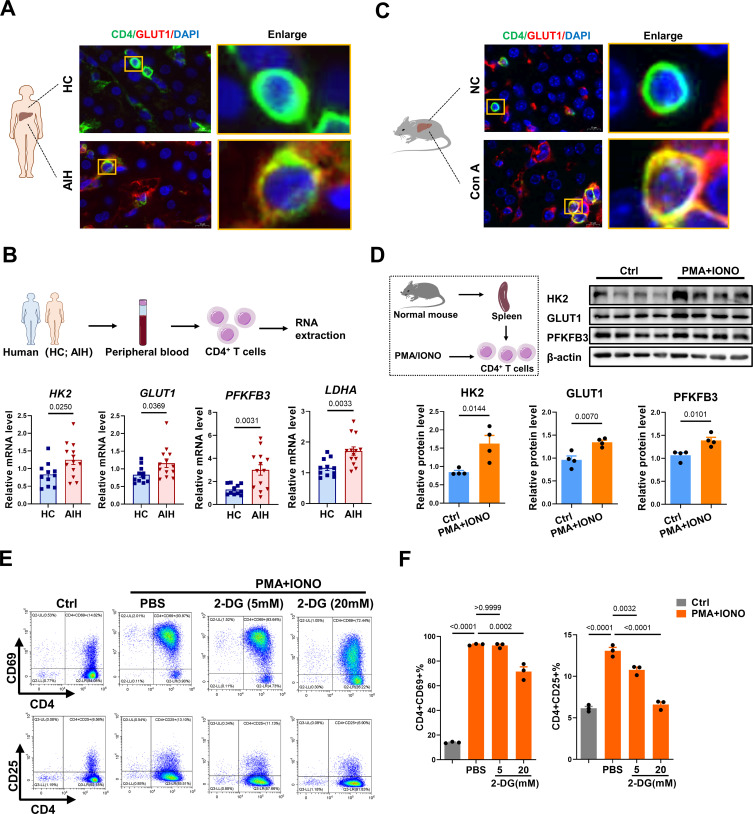
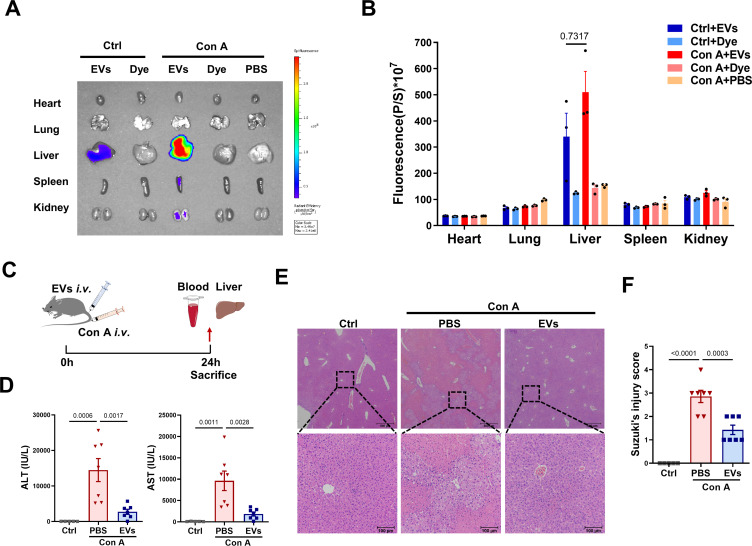
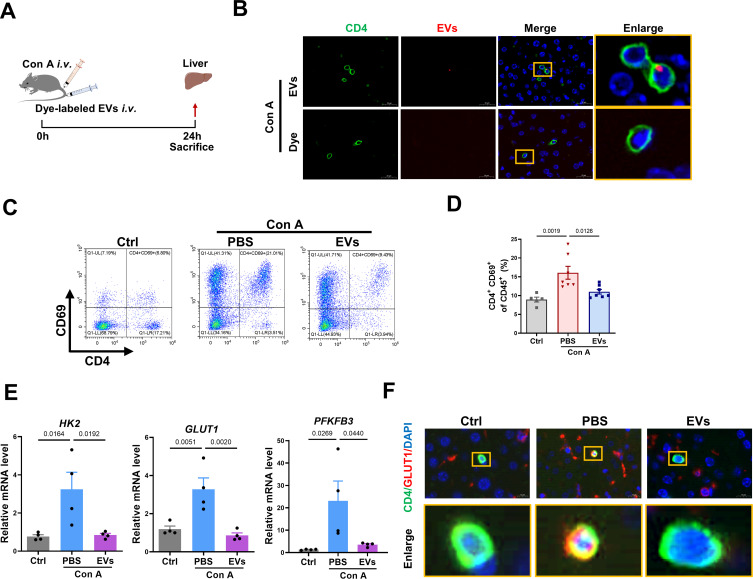
Methods: The metabolic changes of CD4+ T cells were assayed in human AIH and mouse hepatitis models. The liver protective effect of MSC-EVs was evaluated by transaminase levels, liver histopathology and inflammation. The effect of MSC-EVs on the metabolic state of CD4+ T cells was also explored.
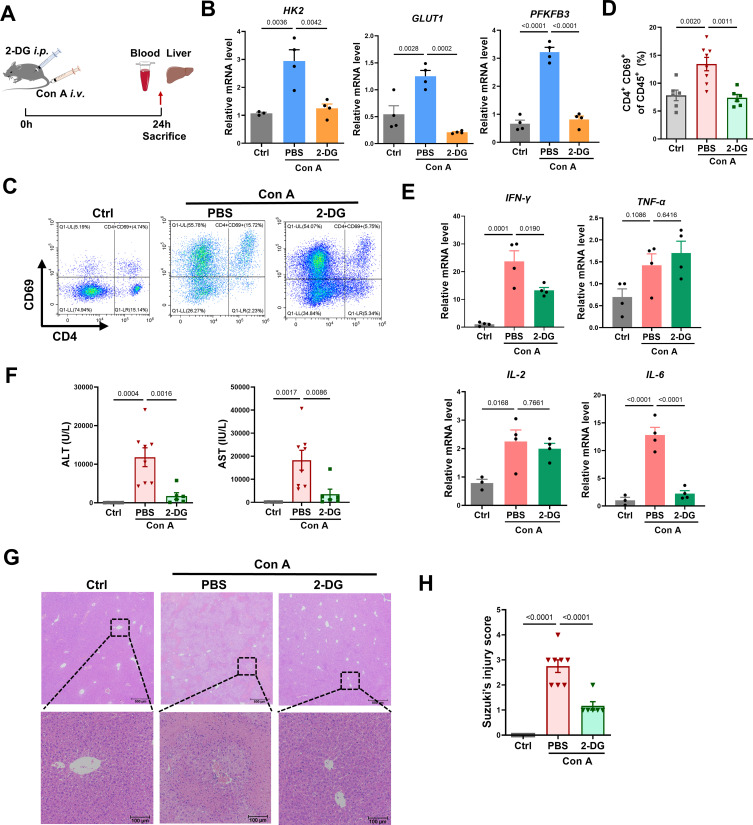
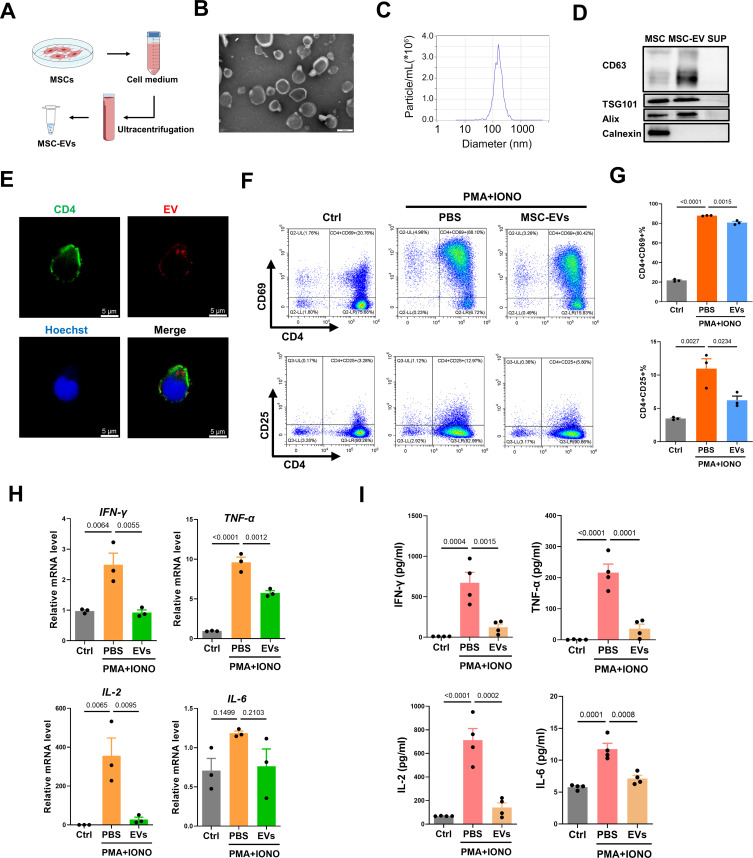
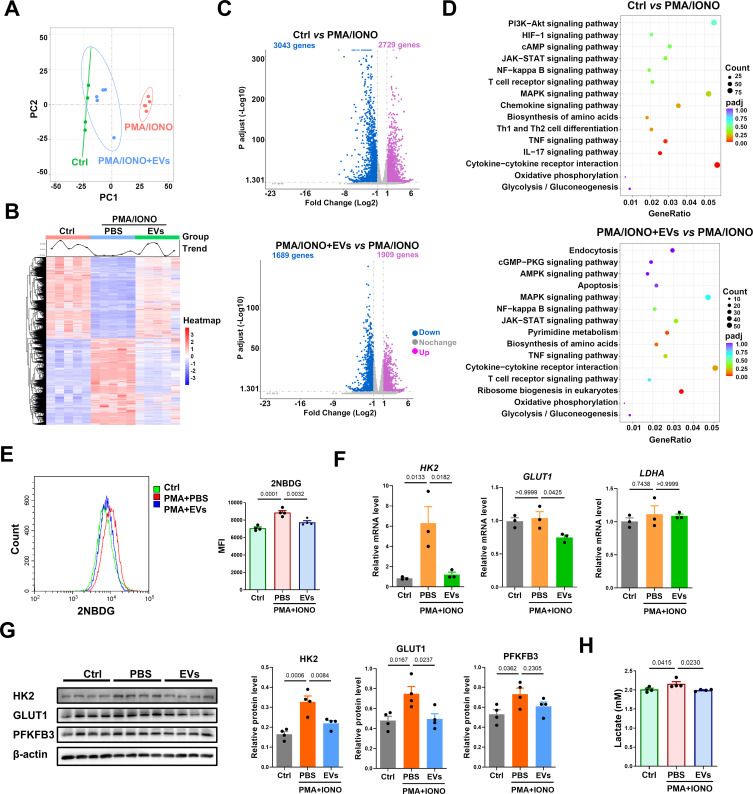
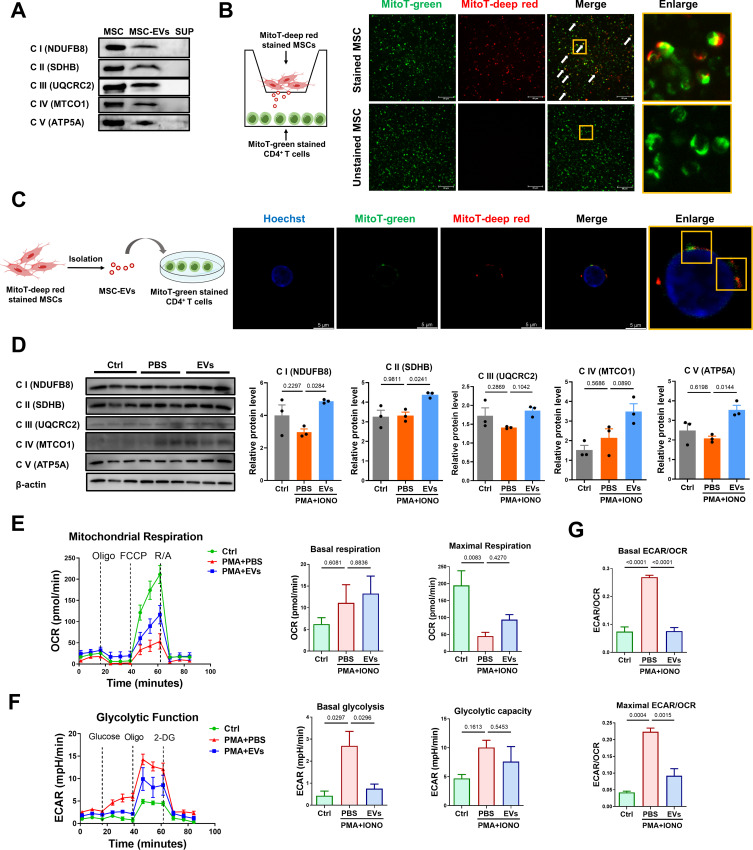
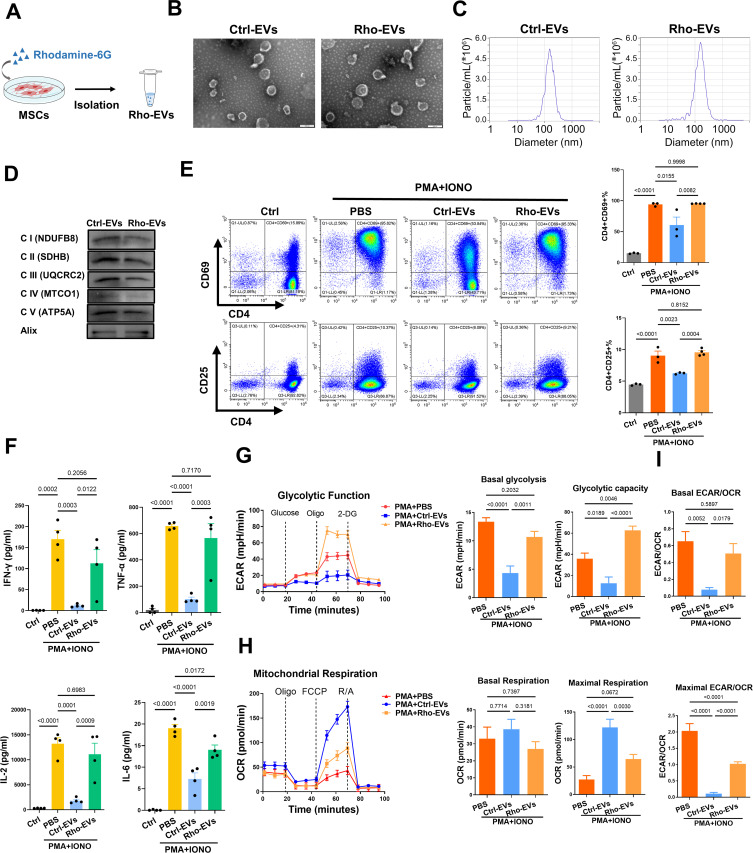
Results: Enhanced glycolysis (eg, ~1.5-fold increase in hexokinase 2 levels) was detected in the CD4+ T cells of AIH patient samples and mouse hepatitis models, whereas the inhibition of glycolysis decreased CD4+ T-cell activation (~1.8-fold decrease in CD69 levels) and AIH liver injury (~6-fold decrease in aminotransferase levels). MSC-EV treatment reduced CD4+ T-cell activation (~1.5-fold decrease in CD69 levels) and cytokine release (~5-fold decrease in IFN-γ levels) by reducing glycolysis (~3-fold decrease) while enhancing mitochondrial oxidative phosphorylation (~2-fold increase in maximal respiration) in such cells. The degree of liver damage in AIH mice was ameliorated after MSC-EV treatment (~5-fold decrease in aminotransferase levels). MSC-EVs carried abundant mitochondrial proteins and might transfer them to metabolically reprogram CD4+ T cells, whereas disrupting mitochondrial transfer impaired the therapeutic potency of MSC-EVs in activated CD4+ T cells.
Conclusion: Disordered glucose metabolism promotes CD4+ T-cell activation and associated inflammatory liver injury in AIH models, which can be reversed by MSC-EV therapy, and this effect is at least partially dependent on EV-mediated mitochondrial protein transfer between cells. This study highlights that MSC-EV therapy may represent a new avenue for treating autoimmune diseases such as AIH.
Keywords: autoimmune hepatitis; extracellular vesicles; inflammation; metabolic reprogramming; mitochondria.
© 2024 Shen et al.
Conflict of interest statement
The authors declare that they have no competing interests in this work.
Figures
Similar articles
-
Mesenchymal Stem Cell-Derived Exosomes: Emerging as a Promising Cell-Free Therapeutic Strategy for Autoimmune Hepatitis.Biomolecules. 2024 Oct 24;14(11):1353. doi: 10.3390/biom14111353. Biomolecules. 2024. PMID: 39595530 Free PMC article. Review.
-
Engaging natural regulatory myeloid cells to restrict T-cell hyperactivation-induced liver inflammation via extracellular vesicle-mediated purine metabolism regulation.Theranostics. 2024 Aug 12;14(12):4874-4893. doi: 10.7150/thno.97427. eCollection 2024. Theranostics. 2024. PMID: 39239508 Free PMC article.
-
Mesenchymal stromal cell-derived extracellular vesicles as nanotherapeutics for concanavalin a-induced hepatitis: modulating the gut‒liver axis.Stem Cell Res Ther. 2025 Jan 7;16(1):4. doi: 10.1186/s13287-024-04013-7. Stem Cell Res Ther. 2025. PMID: 39773662 Free PMC article.
-
Comparison of Concanavalin a-Induced Murine Autoimmune Hepatitis Models.Cell Physiol Biochem. 2018;46(3):1241-1251. doi: 10.1159/000489074. Epub 2018 Apr 16. Cell Physiol Biochem. 2018. PMID: 29672295
-
Therapeutic prospects of MicroRNAs carried by mesenchymal stem cells-derived extracellular vesicles in autoimmune diseases.Life Sci. 2021 Jul 15;277:119458. doi: 10.1016/j.lfs.2021.119458. Epub 2021 Apr 6. Life Sci. 2021. PMID: 33831424 Review.
Cited by
-
Mesenchymal Stem Cell-Derived Exosomes: Emerging as a Promising Cell-Free Therapeutic Strategy for Autoimmune Hepatitis.Biomolecules. 2024 Oct 24;14(11):1353. doi: 10.3390/biom14111353. Biomolecules. 2024. PMID: 39595530 Free PMC article. Review.
-
Extracellular vesicle-mediated bidirectional communication between the liver and other organs: mechanistic exploration and prospects for clinical applications.J Nanobiotechnology. 2025 Mar 8;23(1):190. doi: 10.1186/s12951-025-03259-4. J Nanobiotechnology. 2025. PMID: 40055724 Free PMC article. Review.
-
New insights into T cell metabolism in liver cancer: from mechanism to therapy.Cell Death Discov. 2025 Mar 23;11(1):118. doi: 10.1038/s41420-025-02397-w. Cell Death Discov. 2025. PMID: 40122853 Free PMC article. Review.
-
Recent advances in the role of mesenchymal stem cells as modulators in autoinflammatory diseases.Front Immunol. 2024 Dec 20;15:1525380. doi: 10.3389/fimmu.2024.1525380. eCollection 2024. Front Immunol. 2024. PMID: 39759531 Free PMC article. Review.
-
Therapeutic and diagnostic potential of extracellular vesicle (EV)-mediated intercellular transfer of mitochondria and mitochondrial components.J Cereb Blood Flow Metab. 2025 May 14:271678X251338971. doi: 10.1177/0271678X251338971. Online ahead of print. J Cereb Blood Flow Metab. 2025. PMID: 40367392 Free PMC article. Review.
References
MeSH terms
Substances
LinkOut - more resources
Full Text Sources
Research Materials
