. 2024 Sep 24:12:e18159.
doi: 10.7717/peerj.18159. eCollection 2024.

RNA sequencing identifies lung cancer lineage and facilitates drug repositioning

Affiliations

RNA sequencing identifies lung cancer lineage and facilitates drug repositioning

Longjin Zeng et al. PeerJ. .

Abstract

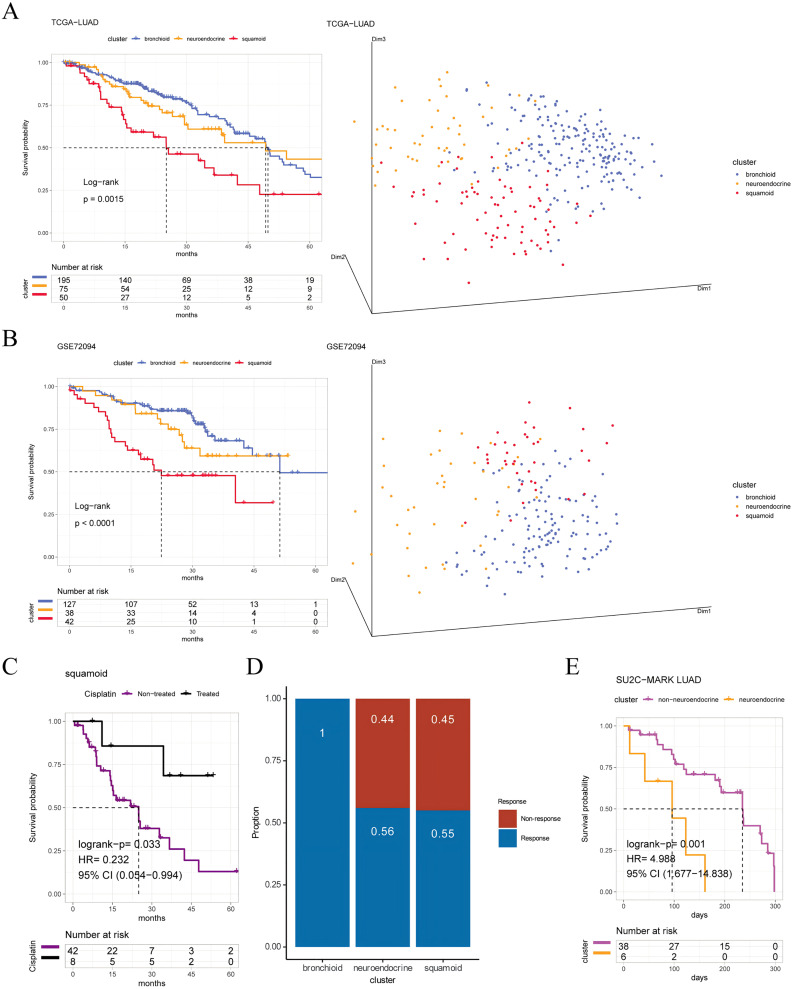
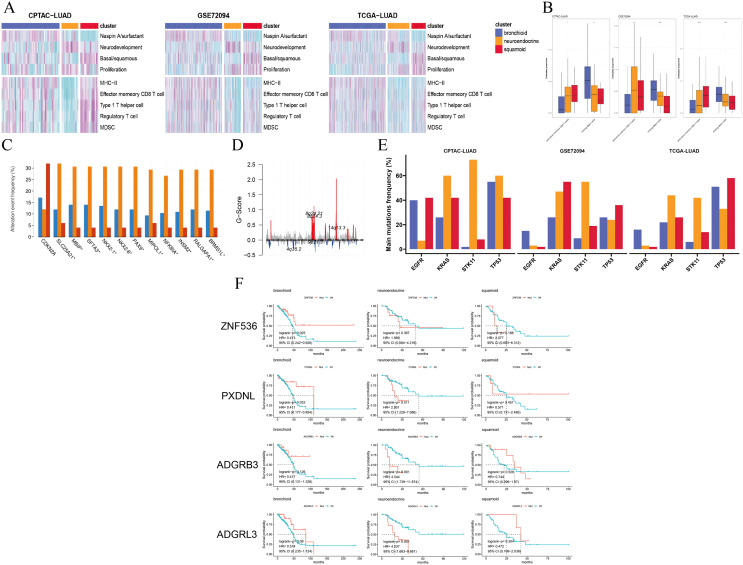
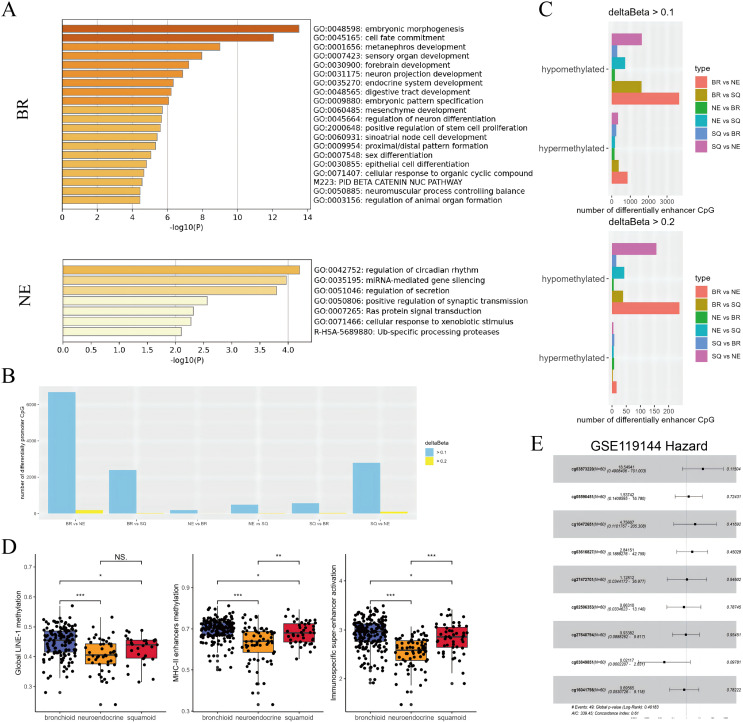
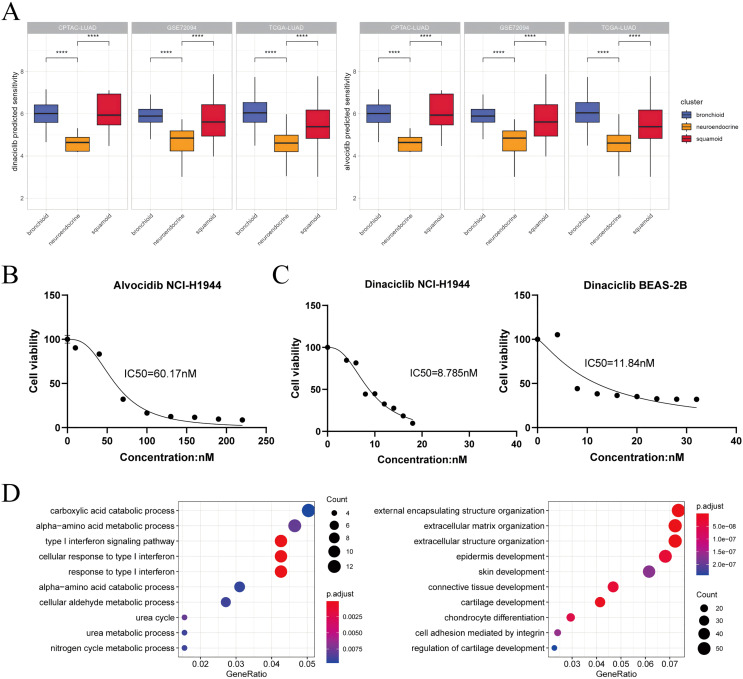
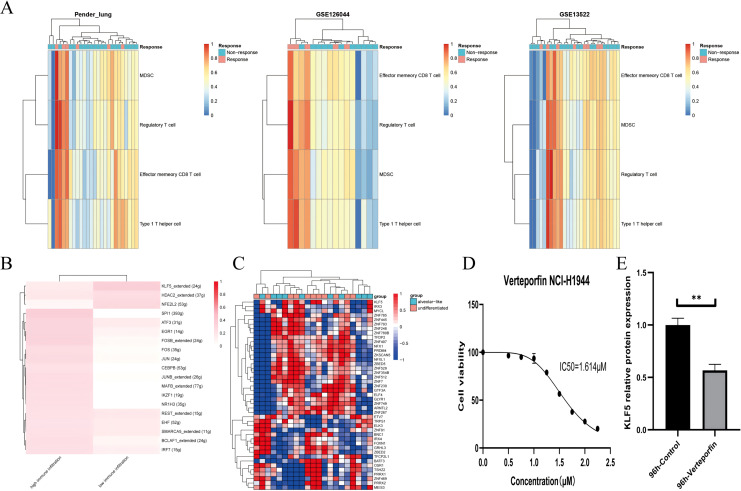
Recent breakthrough therapies have improved survival rates in non-small cell lung cancer (NSCLC), but a paradigm for prospective confirmation is still lacking. Patientdatasets were mainly downloaded from TCGA, CPTAC and GEO. We conducted downstream analysis by collecting metagenes and generated 42-gene subtype classifiers to elucidate biological pathways. Subsequently, scRNA, eRNA, methylation, mutation, and copy number variation were depicted from a phenotype perspective. Enhancing the clinical translatability of molecular subtypes, preclinical models including CMAP, CCLE, and GDSC were utilized for drug repositioning. Importantly, we verified the presence of previously described three phenotypes including bronchioid, neuroendocrine, and squamoid. Poor prognosis was seen in squamoid and neuroendocrine clusters for treatment-naive and immunotherapy populations. The neuroendocrine cluster was dominated by STK11 mutations and 14q13.3 amplifications, whose related methylated loci are predictive of immunotherapy. And the greatest therapeutic potential lies in the bronchioid cluster. We further estimated the relative cell abundance of the tumor microenvironment (TME), specific cell types could be reflected among three clusters. Meanwhile, the higher portion of immune cell infiltration belonged to bronchioid and squamoid, not the neuroendocrine cluster. In drug repositioning, MEK inhibitors resisted bronchioid but were squamoid-sensitive. To conceptually validate compounds/targets, we employed RNA-seq and CCK-8/western blot assays. Our results indicated that dinaciclib and alvocidib exhibited similar activity and sensitivity in the neuroendocrine cluster. Also, a lineage factor named KLF5 recognized by inferred transcriptional factors activity could be suppressed by verteporfin.

Keywords: Drug sensitivity; Lung adenocarcinoma; Metagene; Molecular classification.


Conflict of interest statement

The authors declare that they have no competing interests.

Figures

Figure 1
Figure 1. Prognosis and predictive chemotherapy information of transcriptional clusters.
Kaplan-Meier Survival is showing prognostic significance by Log-rank test and PCA analysis plotting patients were clustered into three distinct clusters for (A) TCGA-LUAD cohort (n = 320), and (B) GSE72094 cohort (n = 207) (left: survival analysis; right: PCA plotting, the X, Y and Z axes represent the three principal components). (C) Squamoid cluster received cisplatin or not receiving cisplatin from TCGA-LUAD (n = 50) (D) GSE19188 (n = 70) predicted for pemetrexed therapy. (E) Neuroendocrine cluster treated with immune checkpoint inhibitors from SU2C-MARK LUAD (n = 44). Inclusion of only samples within 300 days of overall survival. Legend was labeled in blue (bronchioid), yellow (neuroendocrine), red (squamoid), purple (non-treated), black (treated), and fuchsia (non-neuroendocrine).
Figure 2
Figure 2. Pathways, immune cells, copy number aberrations and mutations among three clusters.
(A) Heatmap drawing Gene Set Variance Analysis (GSVA) scores for each patient in the CPTAC-LUAD cohort (n = 77), GSE72094 cohort (n = 207) and TCGA-LUAD cohort (n = 320). Z-value GSVA score projected into (−2;2). (B) Box plots exhibiting proportion of activated memory CD4+ T and resting mast immune cells using Kruskal-Wallis test in the CPTAC-LUAD cohort (n = 77), GSE72094 cohort (n = 207) and TCGA-LUAD cohort (n = 320). Asterisks (*, ** and ****) represent p < 0.05, p < 0.01, p < 0.0001, respectively. (C) CDKN2A homozygous deletion and 14q13 high-level amplifications among three clusters in the TCGA-LUAD cohort. (D) Genome plot showing focal chromosomal alterations of neuroendocrine in the TCGA-LUAD cohort. Given the G-score (x axis) for each focus event (y axis). Note that a high G-score means a high probability of occurring events. (E) Line graph showing the percentage distribution of the four major mutations (EGFR, KRAS, STK11 and TP53) among three clusters in the CPTAC-LUAD, GSE72094 and TCGA-LUAD cohorts. (F) Kaplan-Meier plot showing survival time of ZNF536, PXDNL, ADGRB3 and ADGRL3 mutation status among three clusters in the TCGA-LUAD cohort (left: bronchioid; middle: neuroendocrine; right: squamoid).
Figure 3
Figure 3. Subtypes difference in methylated and eRNA perturbation.
(A) Metascape enrichment (https://metascape.org/gp/) of methylated region-associated genes in bronchioid and neuroendocrine clusters, respectively. (B and C) The number of differentially methylated promoters and enhancers between clusters is shown. The deltaBeta values greater than 0.1 and 0.2 were used as thresholds for differential methylation. (D) Box plots showing the levels of methylation from global LINE-1, MHC-II enhancers and immunospecific super-enhancers in the TCGA-LUAD cohort. Comparison between groups using Wilcoxon test. Asterisks (*, ** and ***) represent p < 0.05, p < 0.01, p < 0.001, p < 0.0001, respectively. (E) Hazard forest plots are generated based on nine enhancer loci that are up-regulated in the neuroendocrine cluster. Note that the abbreviations used in the figure are ‘BR’ for bronchioid, ‘NE’ for neuroendocrine, and ‘SQ’ for squamoid cluster.
Figure 4
Figure 4. Dinaciclib and alvocidib predicted from bioinformatics and validated in vitro.
(A) CCLE predicted sensitivity values in clusters using Wilcoxon test. Asterisks (****) represent p < 0.0001 (left: dinaciclib; right: alvocidib). Higher values mean therapy resistance. (B) Cell viability of the NCI-H1944 cell line treated with alvocidib. (C) Cell viability of the NCI-H1944 and BEAS-2B cell lines treated with dinaciclib (left: NCI-H1944; right: BEAS-2B. The horizontal and vertical axes are the concentration and cell survival ratio, respectively, while the IC50 values have been labeled). (D) GO enrichment analysis of NCI-H1944 after treatment with dinaciclib and alvocidib, respectively (left: down-regulated shared pathways; right: up-regulated shared pathways).
Figure 5
Figure 5. KLF5 as a targetable target inferred from single cells and bulk RNA sequencing.
(A) Heatmap plotting the relative immune infiltration based on Gene Set Variance Analysis (GSVA) scores in Pender’s lung (n = 25), GSE126044 (n = 16) and GSE135222 (n = 27) cohorts (left: Pender’s lung; middle: GSE126044; right: GSE135222, Z-value score projected into (0;1)). (B and C) Transcriptional factors regulation grouped by median signature score in GSE148071 and GSE111907, respectively (GSE148071: 0 means no activity, 1 the opposite; GSE111907: Z-value score projected into (−1;1)). (D) Cell viability of the NCI-H1944 cell line treated with Verteporfin. (E) Verteporfin-induce alterations in the protein level of KLF5 in the NCI-H1944 cell line. The western blot analysis-derived bands were normalized to β-actin. Asterisks (**) represent p < 0.01.

Similar articles

References

    1. Aibar S, González-Blas CB, Moerman T, Huynh-Thu VA, Imrichova H, Hulselmans G, Rambow F, Marine JC, Geurts P, Aerts J, van den Oord J, Atak ZK, Wouters J, Aerts S. SCENIC: single-cell regulatory network inference and clustering. Nature Methods. 2017;14(11):1083–1086. doi: 10.1038/nmeth.4463. - DOI - PMC - PubMed
    1. Bhattacharjee A, Richards WG, Staunton J, Li C, Monti S, Vasa P, Ladd C, Beheshti J, Bueno R, Gillette M, Loda M, Weber G, Mark EJ, Lander ES, Wong W, Johnson BE, Golub TR, Sugarbaker DJ, Meyerson M. Classification of human lung carcinomas by mRNA expression profiling reveals distinct adenocarcinoma subclasses. Proceedings of the National Academy of Sciences of the United States of America. 2001;98(24):13790–13795. doi: 10.1073/pnas.191502998. - DOI - PMC - PubMed
    1. Bischoff P, Trinks A, Obermayer B, Pett JP, Wiederspahn J, Uhlitz F, Liang X, Lehmann A, Jurmeister P, Elsner A, Dziodzio T, Rückert JC, Neudecker J, Falk C, Beule D, Sers C, Morkel M, Horst D, Blüthgen N, Klauschen F. Single-cell RNA sequencing reveals distinct tumor microenvironmental patterns in lung adenocarcinoma. Oncogene. 2021;40(50):6748–6758. doi: 10.1038/s41388-021-02054-3. - DOI - PMC - PubMed
    1. Brunet JP, Tamayo P, Golub TR, Mesirov JP. Metagenes and molecular pattern discovery using matrix factorization. Proceedings of the National Academy of Sciences of the United States of America. 2004;101(12):4164–4169. doi: 10.1073/pnas.0308531101. - DOI - PMC - PubMed
    1. Cai L, Lin S, Girard L, Zhou Y, Yang L, Ci B, Zhou Q, Luo D, Yao B, Tang H, Allen J, Huffman K, Gazdar A, Heymach J, Wistuba I, Xiao G, Minna J, Xie Y. LCE: an open web portal to explore gene expression and clinical associations in lung cancer. Oncogene. 2019;38(14):2551–2564. doi: 10.1038/s41388-018-0588-2. - DOI - PMC - PubMed

MeSH terms

Substances

LinkOut - more resources