. 2024 Sep 26:12:e18114.
doi: 10.7717/peerj.18114. eCollection 2024.

Pulsed sounds caused by internal oxygen transport during photosynthesis in the seagrass Halophila ovalis

Affiliations

Pulsed sounds caused by internal oxygen transport during photosynthesis in the seagrass Halophila ovalis

Hin-Kiu Mok et al. PeerJ. .

Abstract

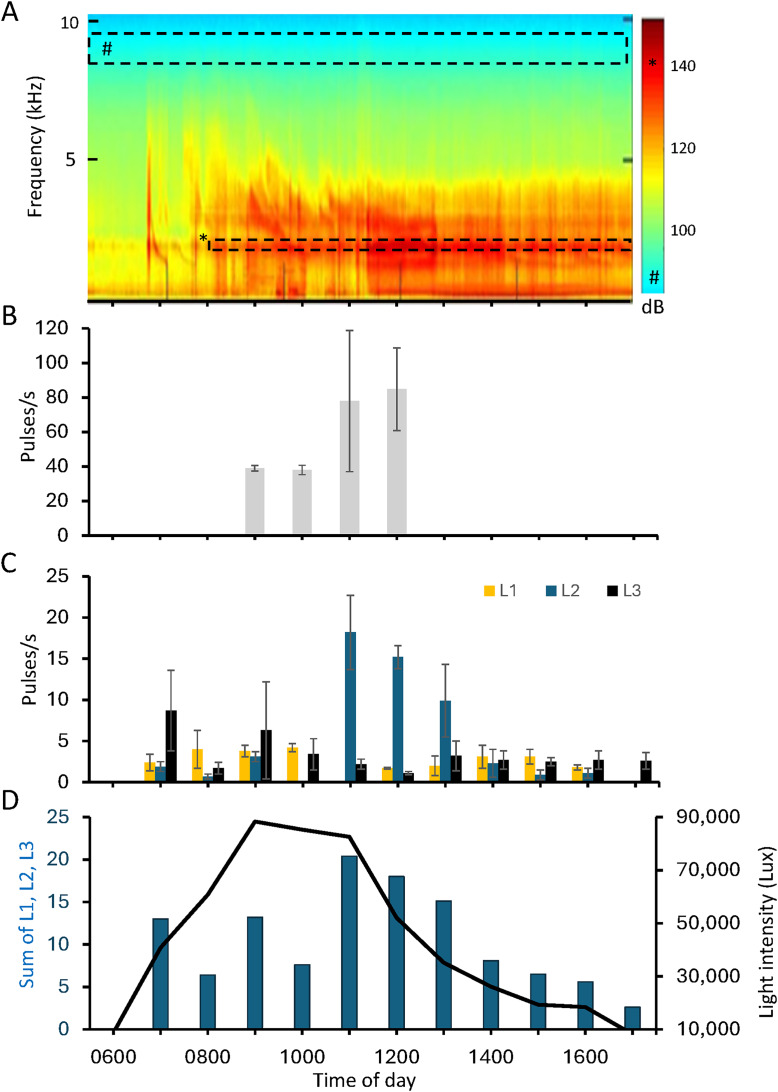
Oxygen bubbles that leak from seagrass blades during photosynthesis have been hypothesized to cause cavitation sounds in aquatic plants. Here we investigate low-amplitude sounds with regular pulse rates produced during photosynthesis in seagrass beds of Halophila ovalis (Qitou Bay, Penghu islands and Cigu Lagoon, Taiwan). Sound pulses appear in the morning when illumination exceeds 10,000 Lux, peak at midday and decrease in midafternoon on a sunny day. Frequencies peak between 1 to 4 kHz, durations range between ca. 1.8 to 4.8 ms, and sound pressure level 1 cm from the bed is 105.4 ± 0.5 dB re 1 μPa (1100 h on a cloudy day). Sounds attenuate rapidly with distance, disappearing beyond 15 cm. Blocking sunlight or administering herbicide stops ongoing sounds. Gas bubbles are not typically seen during sound production ruling out cavitation, and external force (scissor cutting or plant pressed against the substrate) applied to the patch, leaves, petioles, or rhizomes generally increases pulse rate. We suggest sound emission is caused by internal oxygen transport through pores in diaphragms (a whistle mechanism) at the leaf base and nodes of the rhizome.

Keywords: Aerodynamic sounds; Bubble; Halophila ovalis; Internal oxygen transportation; Phytoacoustics; Sound production.


Conflict of interest statement

Richard G. Gilmore, Jr. is employed by Estuarine, Coastal and Ocean Science, Inc., Florida, U.S.A.

Figures

Figure 1
Figure 1. Locality of the study site.
In-situ view of Halophila ovalis patch in Qitou Bay (A), and locality of the study sites in Qitou Bay, Penghu islands and Cigu Lagoon (B). This map was adapted from Map data © 2024 Google (https://www.google.com.tw/maps/).
Figure 2
Figure 2. Two spectrograms of the pulsed sound recorded at 1000 h (A) and 1200 h (B) from the Halophia ovalis patch in Qitou Bay showing arrangement of pulse series with different pulse rates and spectral densities. Arrows point to pulse types of which the expanded waveforms are shown in (C–H).
FFT = 256, frame length 100, overlap 88%. HR: High-rate pulse; Low-rate pulse includes L1: Acoustic energy mainly
Figure 3
Figure 3. Temporal analysis of ambient noise and pulse types at Halophia ovalis.
(A) A median-based spectrogram showing the temporal power spectral on daytime of 25/07/2020 for the ambient noise at Halophia ovalis patch in Qitou Bay with maximum sunlight intensity at around 1100 h, low and high tides at ca. 0830 and 1400 h. Hourly occurrence of the pulse types in the daytime shown in bar charts. (B), Type H; (C), L1, 2, 3; (D), Average pulse rates and average sunlight intensity (line). H: high-pulse rate series; L1: low-pulse rate series, with most energy below 2 kHz; L2: low-pulse rate series, with energy spread adjacent to 2 kHz; L3: low- pulse rate series, energy spread from 0.5 to ca. 5 kHz, with variable power spectral density, or peaks at ca. 2 and 3 kHz. A number sign (#) represents the green color (below 100 dB); an asterisk (*) represents the red color (approximately 140 dB).
Figure 4
Figure 4. Analysis of amplitude attenuation and pulse frequency in relation to brightness levels in Halophila ovalis.
(A) Attenuation of amplitude (mean and SD) of pulsed sounds from the edge of Halophila ovalis patches. Three replicates, each with 30 measurements. (B) A bar chart showing relation between number of pulses/5 s (mean and standard deviation) at five brightness levels in three trials tested in an aquarium set on the bench in the laboratory. Illuminance at 10%, 30%, 50%, 70%, and 100% were 790, 3,970, 7,440, 10,270 and 16,870 Lux, respectively. Notice absence of pulsed sound at the 10% brightness level.

Similar articles

References

    1. Armstrong W. Aeration in higher plants. Advances in Botanical Research. 1979;7:225–332. doi: 10.1016/S0065-2296(08)60089-0. - DOI
    1. Azcón-Bieto J. Inhibition of photosynthesis by carbohydrate end product inhibition of photosynthesis. Plant Physiology. 1983;73(3):681–686. doi: 10.1104/pp.73.3.681. - DOI - PMC - PubMed
    1. Borum J, Sand-Jesen K, Binzer T, Pedersen O, Greve TM. Oxygen movement in seagrasses. In: Larkum AWD, et al., editors. Seagrasses: Biology, Ecology and Conservation. Dordrecht: Springer; 2006. pp. 255–270.
    1. Chang AYY, Chiu L, Mok MHK, Soong K, Huang WJ. Experimental observations of diurnal acoustic propagation effects in seagrass meadows on the Dongsha Atoll. The Journal of the Acoustical Society of America. 2019;146(3):EL279–EL285. doi: 10.1121/1.5126024. - DOI - PubMed
    1. Felisberto P, Jesus SM, Zabel F, Santos R, Silva J, Gobert S, Beer S, Bjork M, Mazzuca S, Procaccini G, Runcie JW, Champenois W, Borges A. Acoustic monitoring of O2 production of a seagrass meadow. Journal of Experimental Marine Biology and Ecology. 2015a;464(1):75–87. doi: 10.1016/j.jembe.2014.12.013. - DOI

LinkOut - more resources