

Clinical characteristics and a diagnostic model for high-altitude pulmonary edema in habitual low altitude dwellers
- PMID: 39346082
- PMCID: PMC11439376
- DOI: 10.7717/peerj.18084
Clinical characteristics and a diagnostic model for high-altitude pulmonary edema in habitual low altitude dwellers
Abstract
Background: The fatal risk of high-altitude pulmonary edema (HAPE) is attributed to the inaccurate diagnosis and delayed treatment. This study aimed to identify the clinical characteristics and to establish an effective diagnostic nomogram for HAPE in habitual low altitude dwellers.
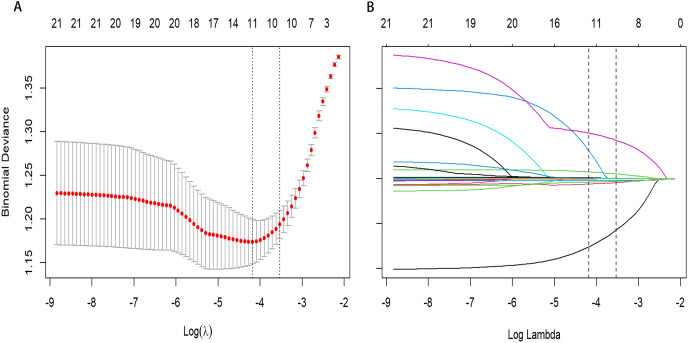
Methods: A total of 1,255 individuals of Han Chinese were included in the study on the Qinghai-Tibet Plateau at altitudes exceeding 3,000 m. LASSO algorithms were utilized to identify significant predictors based on Akaike's information criterion (AIC), and a diagnostic nomogram was developed through multivariable logistic regression analysis. Internal validation was conducted through bootstrap resampling. Model performance was evaluated using ROC curves and the Hosmer-Lemeshow test.
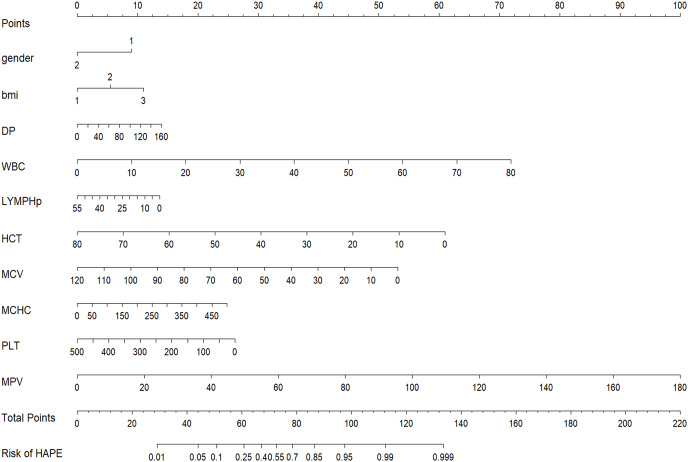
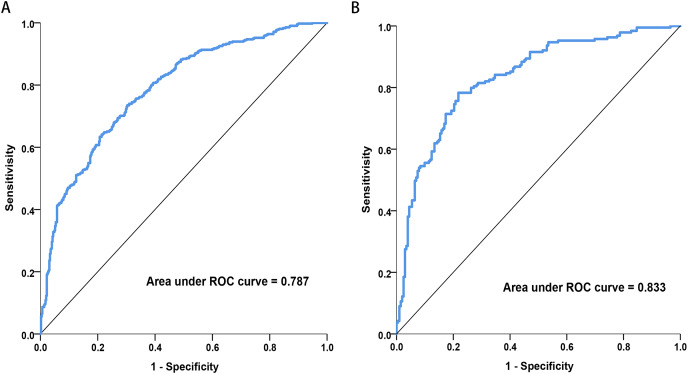
Results: The nomogram included eleven predictive factors and demonstrated high discrimination with an AUC of 0.787 (95% CI [0.757-0.817]) and 0.833 (95% CI [0.793-0.874]) in the training and validation cohorts, respectively. Calibration curves were assessed in both the training (P = 0.793) and validation datasets (P = 0.629). Confusion matrices revealed accuracies of 70.95% and 74.17% for the training and validation groups. Furthermore, decision curve analysis supported the use of the nomogram for patients with HAPE.
Conclusion: We propose clinical features and column charts based on hematological parameters and demographic variables, which can be conveniently used for the diagnosis of HAPE. In high-altitude areas with limited emergency environments, a diagnostic model can provide fast and reliable diagnostic support for medical staff, helping them make better treatment decisions.
Keywords: High-altitude pulmonary edema; Lasso regression; Nomogram; Validation.
© 2024 Li et al.
Conflict of interest statement
The authors declare that they have no competing interests.
Figures


Similar articles
-
Predictive model for estimating the risk of high-altitude pulmonary edema: a single-centre retrospective outcome-reporting study.BMJ Open. 2023 Nov 3;13(11):e074161. doi: 10.1136/bmjopen-2023-074161. BMJ Open. 2023. PMID: 37923352 Free PMC article.
-
Derivation and internal validation of prediction models for pulmonary hypertension risk assessment in a cohort inhabiting Tibet, China.Elife. 2024 Nov 11;13:RP98169. doi: 10.7554/eLife.98169. Elife. 2024. PMID: 39526735 Free PMC article.
-
A machine learning-based severity stratification tool for high altitude pulmonary edema.BMC Med Inform Decis Mak. 2025 Apr 18;25(1):171. doi: 10.1186/s12911-025-02992-y. BMC Med Inform Decis Mak. 2025. PMID: 40251543 Free PMC article.
-
High-altitude pulmonary edema: diagnosis, prevention, and treatment.Curr Sports Med Rep. 2013 Mar-Apr;12(2):115-9. doi: 10.1249/JSR.0b013e318287713b. Curr Sports Med Rep. 2013. PMID: 23478563 Review.
-
The Complexity of Diagnosing High-Altitude Pulmonary Edema: A Case Report and Review of the Differential Diagnosis of Greater Than Expected Hypoxemia at Altitude.High Alt Med Biol. 2019 Jun;20(2):181-186. doi: 10.1089/ham.2018.0109. High Alt Med Biol. 2019. PMID: 31233382 Review.
References
-
- Burnham KP, Anderson DR. Multimodel inference-understanding AIC and BIC in model selection. Sociological Methods & Research. 2004;33(2):261–304. doi: 10.1177/0049124104268644. - DOI
MeSH terms
Supplementary concepts
LinkOut - more resources
Full Text Sources
