. 2024 Sep 26:12:e18155.
doi: 10.7717/peerj.18155. eCollection 2024.

Spatio-temporal modeling of co-dynamics of smallpox, measles, and pertussis in pre-healthcare Finland

Affiliations

Spatio-temporal modeling of co-dynamics of smallpox, measles, and pertussis in pre-healthcare Finland

Tiia-Maria Pasanen et al. PeerJ. .

Abstract

Infections are known to interact as previous infections may have an effect on risk of succumbing to a new infection. The co-dynamics can be mediated by immunosuppression or modulation, shared environmental or climatic drivers, or competition for susceptible hosts. Research and statistical methods in epidemiology often concentrate on large pooled datasets, or high quality data from cities, leaving rural areas underrepresented in literature. Data considering rural populations are typically sparse and scarce, especially in the case of historical data sources, which may introduce considerable methodological challenges. In order to overcome many obstacles due to such data, we present a general Bayesian spatio-temporal model for disease co-dynamics. Applying the proposed model on historical (1820-1850) Finnish parish register data, we study the spread of infectious diseases in pre-healthcare Finland. We observe that measles, pertussis, and smallpox exhibit positively correlated dynamics, which could be attributed to immunosuppressive effects or, for example, the general weakening of the population due to recurring infections or poor nutritional conditions.

Keywords: Bayesian analysis; Infection co-dynamics; Measles; Pertussis; Smallpox; Spatio-temporal.


Conflict of interest statement

The authors declare there are no competing interests.

Figures
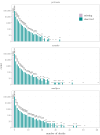
Figure 1
Figure 1. The counts of the observed numbers of deaths over all towns and months plotted by disease.
The first bar indicates the number of missing observations. The numbers above the bars are the counts. Note that the vertical axis is on a logarithmic scale.
Figure 2
Figure 2. The prevalence of the diseases is illustrated with the dark lines depicting the proportions of the towns where at least one death was observed.
The lighter turquoise lines show the posterior means of the corresponding estimates and the shaded areas their 95% posterior intervals. Note that the data line is calculated over the towns with observations, whereas the estimate line averages all the towns.
Figure 3
Figure 3. The left panels show the proportions of the months when deaths were recorded over the study period of 31 years.
The gray areas indicate the towns where all data are missing. The right panels present the regional averages of the predicted conditional probabilities to observe at least one death caused by each disease in each month given the actual observations from the previous month. Note that the data are averaged over the observed towns and months, whereas the model covers all the towns and months.
Figure 4
Figure 4. Posterior means and 95% posterior intervals for the unobserved incidence factors τtd for pertussis, measles, and smallpox over the time period under study.
The curves are on a probability scale.
Figure 5
Figure 5. Posterior means (black), 50% (dark turquoise) and 95% (light turquoise) posterior intervals of monthly seasonal effects std for pertussis, measles, and smallpox over a year.
Figure 6
Figure 6. The left panels show the posterior means of the local loadings λi, adjusting the national incidence factors τt.
Since the factors are negative, the smaller the loading is, the greater the probability of at least one death is. The right panels illustrate the posterior means of the regional constants ai.
Figure 7
Figure 7. The dark gray lines depict the proportions of the towns where at least one death was observed.
The turquoise lines show the posterior means of the corresponding estimates and the shaded areas their 95% posterior intervals in the case of the Bernoulli model, whereas the pink lines and areas represent the same values for the negative binomial model. The dotted vertical line indicates the time point after which the model estimates are predicted by the models estimated without the data of the last two years.

Similar articles

References

    1. Bai J, Wang P. Identification and Bayesian estimation of dynamic factor models. Journal of Business & Economic Statistics. 2015;33(2):221–240. doi: 10.1080/07350015.2014.941467. - DOI
    1. Bakaletz LO. Viral—bacterial co-infections in the respiratory tract. Current Opinion in Microbiology. 2017;35:30–35. doi: 10.1016/j.mib.2016.11.003. - DOI - PMC - PubMed
    1. Ball F, Britton T, House T, Isham V, Mollison D, Pellis L, Tomba GS. Seven challenges for metapopulation models of epidemics, including households models. Epidemics. 2015;10:63–67. doi: 10.1016/j.epidem.2014.08.001. - DOI - PubMed
    1. Banner KM, Irvine KM, Rodhouse TJ. The use of Bayesian priors in ecology: the good, the bad and the not great. Methods in Ecology and Evolution. 2020;11(8):882–889. doi: 10.1111/2041-210X.13407. - DOI
    1. Betancourt M. A conceptual introduction to hamiltonian Monte Carlo. 20181701.02434

Publication types

LinkOut - more resources