. 2024 Sep 13:6:1434096.
doi: 10.3389/fspor.2024.1434096. eCollection 2024.

Quantification in shooting precision for preferred and non-preferred foot in college soccer players using the 95% equal confidence ellipse

Affiliations

Quantification in shooting precision for preferred and non-preferred foot in college soccer players using the 95% equal confidence ellipse

Yusuke Shimotashiro et al. Front Sports Act Living. .

Abstract

Shooting precision is a fundamental characteristic in soccer, yet the probabilistic structure and magnitude of precision in soccer shooting remain quantitatively unexplored. This study aimed to quantify shooting precision using measures derived from the bivariate normal distribution for both preferred and non-preferred feet. Sixteen right-footed collegiate soccer players participated by performing instep kicks aiming at targets which are placed close to the left and right top corners of the soccer goal. We used bivariate normal distribution modeled the ball positions, revealing an ellipsoidal distribution, and the area of the 95% confidence ellipses served as an index of precision. Repeated measures ANOVAs revealed a significant main effect of the kicking foot. For shots aimed at the same side as the kicking foot, the area of the 95% confidence ellipse was 6.17 ± 1.93 m2 (mean ± SD) for the preferred foot and 10.22 ± 3.53 m2 for the non-preferred foot. Similar results were observed for shots aimed at the opposite side of the kicking foot. These quantitative findings hold promise for advancing soccer research and enhancing practical applications in soccer skill assessment.

Keywords: accuracy; bivariate normal distribution; football; kick; motor control; variability.


Conflict of interest statement

The authors declare that the research was conducted in the absence of any commercial or financial relationships that could be construed as a potential conflict of interest.

Figures

Figure 1
Figure 1
Quantification of shooting precision using the 95% equal confidence ellipses. (A) Comparison between a conventional point-based method and the analytical method using 95% equal confidence ellipse. For a point-based method, discrete points are assigned for specific areas in the goal: grey areas at the top corners [e.g., (8)]. In the present study, we quantified the variability in the ball position using the 95% equal confidence ellipse. Schematic examples of ball position of 4 shots are illustrated in sub panels a1–a4. Black circles indicate balls that hit the target, while the white circles indicate balls that missed the target based on the conventional method. (B) Ball positions of shots of one participant and 95% equal confidence ellipses for each condition were illustrated. (C) Based on the 95% equal confidence ellipse, the long axis, short axis, and the area were calculated as the indices of the size of the shooting precision. The orientation of the ellipse was calculated as the angle of the long axis from the horizontal line. Note that the sign of the orientation was flipped to compare between the right and left kicking foot conditions.
Figure 2
Figure 2
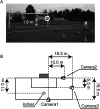
Experimental setup. (A) Experimental setup. A photo is shown when the kicker aimed at the target on the right side with his left foot. (B) Camera placement. The figure shows the camera placement when the kicker aimed at the target on the right side. In the condition of aiming at the target on the left side, the camera placement was symmetrical with the center of the goal as the axis Measurements.
Figure 3
Figure 3
Area of the 95% confidence ellipse. Dots connected with a line represent data from the same participant. The distribution of the data is depicted using box plots, showing minimum, maximum, median, and first and third quantiles. Although statistical analyses were conducted on the logarithms of the variable, the figure presents the raw values. A significant main effect of kicking foot was identified by a two-way repeated ANOVA (* in the figure, p < 0.05), while the main effect of shoot direction and the interaction were not statistically significant.
Figure 4
Figure 4
Long and short axes of 95% equal confidence ellipse. The figure displays long axis (A) and short axis (B) Dots connected with a line represent data from the same participant. The distribution of the data is depicted using box plots, showing minimum, maximum, median, and first and third quantiles. Although statistical analyses were conducted on the logarithms of the variable, the figure presents the raw values. A significant main effect of kicking foot was identified by a two-way repeated ANOVA (* in the figure, p < 0.05), while the main effect of shoot direction and the interaction were not statistically significant.
Figure 5
Figure 5
Angle of 95% equal confidence ellipse. Dots connected with a line represent data from the same participant. The distribution of the data is depicted using box plots, showing minimum, maximum, median, and first and third quantiles. No significant differences were observed between all the conditions.
Figure 6
Figure 6
Correlation between ball long and short axis coordinates and ball velocity. The figure displays correlation between long axis of 95% equal confidence ellipse coordinates and ball velocity (A) and the correlation between short axis of 95% equal confidence ellipse coordinates and ball velocity (B). The distribution of the data is depicted using box plots, showing minimum, maximum, median, and first and third quantiles. A significant difference between kicking foot and shoot direction was identified by post-hoc test (* in the figure, p < 0.05).

Similar articles

References

    1. Reilly T, Korkusuz F. The biomechanics of football. In: Science and Football II. London: Routledge; (2003). p. 333–40. 10.4324/9780203893685 - DOI
    1. Njororai WWS. Analysis of goals scored in the 2010 world cup soccer tournament held in South Africa. J Phys Ed Sport. (2013) 13(1):6–13. 10.7752/jpes.2013.01002 - DOI
    1. Almeida CH, Volossovitch A, Duarte R. Penalty kick outcomes in UEFA club competitions (2010–2015): the roles of situational, individual and performance factors. Int J Perf Anal Sport. (2016) 16(2):508–22. 10.1080/24748668.2016.11868905 - DOI
    1. Carey DP, Smith G, Smith DT, Shepherd JW, Skriver J, Ord L, et al. Footedness in world soccer: an analysis of France ‘98. J Sports Sci. (2001) 19(11):855–64. 10.1080/026404101753113804 - DOI - PubMed
    1. Marcori AJ, Giovanini B, Monteiro PHM, Nascimento VB, de Souza D, Okazaki VHA. How positional constraints affect footedness in football: a notational analysis of five leagues in Europe. J Mot Behav. (2022) 54(3):382–90. 10.1080/00222895.2021.1980367 - DOI - PubMed

LinkOut - more resources