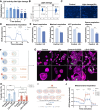
. 2024 Sep 9;14(15):5762-5777.
doi: 10.7150/thno.96508. eCollection 2024.

ROCK inhibitor enhances mitochondrial transfer via tunneling nanotubes in retinal pigment epithelium

Affiliations

ROCK inhibitor enhances mitochondrial transfer via tunneling nanotubes in retinal pigment epithelium

Jing Yuan et al. Theranostics. .

Abstract

Rationale: Tunnel nanotube (TNT)-mediated mitochondrial transport is crucial for the development and maintenance of multicellular organisms. Despite numerous studies highlighting the significance of this process in both physiological and pathological contexts, knowledge of the underlying mechanisms is still limited. This research focused on the role of the ROCK inhibitor Y-27632 in modulating TNT formation and mitochondrial transport in retinal pigment epithelial (RPE) cells. Methods: Two types of ARPE19 cells (a retinal pigment epithelial cell line) with distinct mitochondrial fluorescently labeled, were co-cultured and treated with ROCK inhibitor Y-27632. The formation of nanotubes and transport of mitochondria were assessed through cytoskeletal staining and live cell imaging. Mitochondrial dysfunction was induced by light damage to establish a model, while mitochondrial function was evaluated through measurement of oxygen consumption rate. The effects of Y-27632 on cytoskeletal and mitochondrial dynamics were further elucidated through detailed analysis. Results: Y-27632 treatment led to an increase in nanotube formation and enhanced mitochondrial transfer among ARPE19 cells, even following exposure to light-induced damage. Our analysis of cytoskeletal and mitochondrial distribution changes suggests that Y-27632 promotes nanotube-mediated mitochondrial transport by influencing cytoskeletal remodeling and mitochondrial movement. Conclusions: These results suggest that Y-27632 has the ability to enhance mitochondrial transfer via tunneling nanotubes in retinal pigment epithelium, and similarly predict that ROCK inhibitor can fulfill its therapeutic potential through promoting mitochondrial transport in the retinal pigment epithelium in the future.

Keywords: ARPE19; Y-27632; cytoskeletal remodeling; light damage; mitochondrial transfer; nanotubes.


Conflict of interest statement

Competing Interests: The authors have declared that no competing interest exists.

Figures

Figure 1
Figure 1
Y-27632-induced intercellular nanotube formation and mitochondrial transfer are dose-dependent. (A) Images captured under bright-field microscopy of nanotubes in ARPE19 cells treated with the ROCK inhibitor Y-27632 (10µM) for 24 hours are shown, with nanotubes indicated by white triangles. Scale bar: 200µm. (B) A diagram illustrating the co-culture program. ARPE19 cells expressing mito-GFP (green) were co-cultured as donor cells in direct contact with ARPE19 cells stained with cytoplasmic membrane (CM, blue) as recipient cells at a ratio of 1:1 for 24 hours. Mito-GFP in CM+ cells marked mitochondrial transfer. (C) ARPE19-mito-GFP (green) and ARPE19 cells (CM, blue) were co-cultured and treated with varying concentrations of Y-27632 for 24 hours to induce nanotube formation. Nanotube formation and mitochondrial transfer were imaged by confocal microscopy. Scale bar: 50µm. (D, E) The number of nanotubes each cell formed and mitochondrial transfer rate were quantified. n=5, one-way ANOVA with Dunnett's T3 multiple comparisons post hoc tests, mean±SEM; *p<0.05, **p<0.01, ***p<0.001. (F-I) Representative flow cytometry images of Annexin V-FITC/PI analysis for ARPE19 cells with treatment of varying concentrations of Y-27632 for 24 hours (F). The percentage of living cells (Annexin V-FITC-/PI-) (G), early apoptotic cells (Annexin V-FITC+/PI-) (H) and late apoptotic cells (Annexin V-FITC+/PI+) (I) were quantified. n=4, Kruskal-Wallis test, median ± interquartile range; *p<0.05, **p<0.01.
Figure 2
Figure 2
Characterization of Y-27632-induced nanotubes. (A) A diagram illustrating the co-culture experiments. ARPE19-mito-GFP cells (green) and ARPE19-mito-RFP cells (red, CM, blue) co-culture at 1:1 ratio for 24 hours. Mito-GFP in CM+ cells marked mitochondrial transfer from ARPE19-mito-GFP cells to ARPE19-mito-RFP cells while mito-RFP in CM- cells marked mitochondrial transfer from ARPE19-mito-RFP cells to ARPE19-mito-GFP cells. (B) ARPE19-mito-RFP cells (blue) were co-cultured with ARPE19-mito-GFP cells (green) for 24 hours. All cells were stained with phalloidin (magenta) followed by fluorescent confocal microscopy. White triangles indicate nanotubes with or without mitochondria. Scale bar: 50µm. (C) Mitochondrial transfer rate including transfer in and transfer out of ARPE19 cells were quantified in control and Y-27632 groups. n=8, two-way ANOVA test, mean±SEM; ns, not significant, ***p<0.001. (D) A diagram showing that ARPE19-mito-GFP cells (green) were co-cultured as donor cells with ARPE19 as recipient cells at 1:1 ratio, with the two types of cells separated by filters in transwell. (E) Representative images of ARPE19 cells (phalloidin, magenta) in the bottom of a transwell plate. Scale bar:50 µm. (F) F-actin (phalloidin, magenta) and microtubules (α-tubulin, red) of nanotubes were detected in ARPE19 cells in control and Y-27632 groups. White solid triangles indicate nanotubes containing both F-actin and microtubules, while hollow triangles indicate nanotubes containing F-actin, lacking microtubules. Scale bar: 50 µm. (G) The percentage of nanotubes containing F-actin (actin+) and microtubules (tubulin+) were quantified.n (control)=42, n (Y-27632)=218. (H) Quantification of the length of intercellular nanotubes in control and Y-27632 groups. n (control)=91, n (Y-27632)=453. Mann-Whitney test, median ± interquartile range; ***p<0.001. (I) Intercellular nanotubes of different lengths are formed between ARPE19-mito-GFP and ARPE19-mito-RFP cells following treatment with Y-27632. The white dotted line marks the nanotube with their length measured. Scale bar: 25 µm. (J) Nanotubes shown by CM staining (blue) were adherent to the substrate (X-Z axes). Scale bar: 25 µm. (K) Representative images of scanning electron microscope (SEM) show different kinds of Y-27632-induced intercellular nanotubes. (L) Time-lapse microscopic images taken from Movie 1, 2 and 3 showing that intercellular nanotube formation between ARPE19-mito-GFP (green) and ARPE19-mito-RFP cells (red) (white arrows indicate the direction of cell movement) (L1), mitochondrial transfer from ARPE19-mito-GFP cells (green) to ARPE19 cells (blue) (L2), and some other cargoes (blue) are transported between ARPE19 cells (magenta) (L3). Scale bar: 25 µm.
Figure 3
Figure 3
Cytoskeletal inhibition eliminates Y-NTs mediated mitochondrial transfer. (A) ARPE19-mito-GFP cells (green) co-cultured with ARPE19 cells (blue) in control and Y-27632 groups were treated with Cytochalasin B (CytoB) (10µM, 24h), Nocodazole (Noco) (50µM, 24h) and stained with phalloidin (magenta) and anti-α-tubulin antibody (red). Scale bar: 50µm. (B, C) Intercellular nanotube formation and mitochondrial transfer rate were quantified in each group. n=6, Comparison of the effects of different inhibitor treatments on the control and Y-27632 groups was performed using t-tests, and comparison of the effects of different inhibitor treatments within the control or Y-27632 groups was performed using one-way ANOVA. mean±SEM; *p<0.05, **p<0.01, ***p<0.001. Here, we have unified the results into a single graph for ease of presentation.
Figure 4
Figure 4
Y-NTs mediated mitochondrial transfer rescues light-damaged ARPE19 cells. (A) Cell activity shown as the ratio of red/green by JC-1 test with light exposure of different durations. n=5, one-way ANOVA test, mean±SEM; *p<0.05. (B) Representative flow cytometry plot of the result of the JC-1 test for ARPE19 cells after light damage for 0 hours and 2 hours. (C) Representative images of Hoechst 33342 staining (blue) of ARPE19 cells after light damage for 0 hours and 2 hours. Scale bar: 200µm. (D) Extracellular oxygen consumption rate (OCR) analysis of ARPE19 cells after 2 hours of light damage by seahorse. (E) Quantification of oxygen consumption rate (OCR) in mitochondrial basal respiration, maximal respiration, ATP production, and spare respiratory capacity. n=3, t-test, mean±SEM; ns, not significant,**p<0.01. (F) A diagram showing that CM+ ARPE19-mito-RFP cells with or without light damage were co-cultured with healthy ARPE19-mito GFP cells at a 1:1 ratio in the absence or presence of Y-27632. (G) Representative images of co-cultured light-damaged ARPE19-mito-RFP cells (blue) with healthy ARPE19-mito GFP cells (green), all cells were stained with phalloidin (magenta). Enlarged box area displaying the donor-derived mitochondria (green) in recipient CM+ cells (blue). Yellow triangles indicate mitochondrial transfer. Scale bar: 50µm. (H) Mitochondrial transfer rates including transfer in and transfer out of light-damaged ARPE19 cells were quantified in different groups. Scale bar: 50µm. n=6, Comparison of the effects of different treatments on the mitochondrial transfer rate between ARPE19 cells was performed by one-way ANOVA, and t-test was used to compare the mitochondrial transfer rate into and out of ARPE19 cells under the same treatment., mean±SEM; ns,not significant,*p<0.05,**p<0.01, ***p<0.001. Here, we have unified the results into a single graph for ease of presentation. (I) A diagram showing that CM+ ARPE19 cells with or without light damage were further cultured or co-cultured with healthy ARPE19 cells at a 1:1 ratio in the absence or presence of Y-27632 and analyzed by seahorse. (J) Extracellular oxygen consumption rate (OCR) analysis of ARPE19 cells in different groups normalized to control.
Figure 5
Figure 5
Y-27632 regulates cytoskeleton remodeling. (A) Time-lapse microscopic images taken from Movie 2 showing the morphological change in an ARPE19 cell (phalloidin, magenta) treated with 40µM Y-27632. Scale bar: 50µm. (B-C) Quantitative statistics of cell area (B) and outline length (C) of ARPE19 cells in control and Y-27632 groups. n (control)=256, n (Y-27632)=228.Mann-Whitney test, median ± interquartile range; ***p<0.001. (D) Representative images of scanning electron microscope (SEM) show morphological differences between ARPE19 cells in control and Y-27632 groups. (E) Super-resolution confocal imaging reveals changes in the alignment of microfilaments at the edge of the contour of Y-27632-treated ARPE19 cells. Scale bar: 5µm. (F) Heatmap showing differences in the expression of some cytoskeletal molecules in ARPE19 cells after Y-27632 treatment, but not statistically significant. (G) Microfilament (F-actin) and microtubule (α-tubulin) protein levels were detected in control and Y-27632 groups by western blotting.
Figure 6
Figure 6
Y-27632 promotes mitochondrial movement in response to cytoskeletal changes. (A) Four mitochondrial distribution patterns identified by confocal microscopy. ARPE19-mito-GFP cells (green) were stained with phalloidin (red) and DAPI (blue). Images displaying different distribution patterns of mitochondrial (polarized, perinuclear, axon-like, and infiltrating). Scale bar: 25 µm. (B) Quantifying the proportion of cells exhibiting various patterns of mitochondrial distribution (polarized, perinuclear, axon-like, and infiltrating). n (control)=107, n (Y-27632) =97. (C) Time-lapse microscopic images taken from Movie 3 showing the movement of mitochondria (green) in an ARPE19 cell treated with 40µM Y-27632. Scale bar: 25 µm. (D) Quantitative RT-PCR was performed to detect miro1 mRNA levels. n=6, Mann-Whitney test, median ± interquartile range; **p<0.01. (E) Intact mitochondria of an ARPE19-mito-GFP cell (green, left) and its mitochondrial network skeleton extracted by image J software (right). Scale bar: 20µm. (F-G) The number and average length of individual mitochondria in control and Y-27632 groups were quantified. n (control)=88, n (Y-27632)=95. Mann-Whitney test, median ± interquartile range; *p<0.05, **p<0.01.

References

    1. Jiang D, Chen FX, Zhou H, Lu YY, Tan H, Yu SJ. et al. Bioenergetic Crosstalk between Mesenchymal Stem Cells and various Ocular Cells through the intercellular trafficking of Mitochondria. Theranostics. 2020;10:7260–72. - PMC - PubMed
    1. Yin P, Li Y, Lv H, Deng Y, Meng Y, Zhang L. et al. Exchange of genetic material: a new paradigm in bone cell communications. Cell Mol Life Sci. 2018;75:1989–98. - PMC - PubMed
    1. Li Q, Wang M, Liu L. The role of exosomes in the stemness maintenance and progression of acute myeloid leukemia. Biochem Pharmacol. 2023;212:115539. - PubMed
    1. Mittelbrunn M, Sánchez-Madrid F. Intercellular communication: diverse structures for exchange of genetic information. Nat Rev Mol Cell Biol. 2012;13:328–35. - PMC - PubMed
    1. Shanmughapriya S, Langford D, Natarajaseenivasan K. Inter and Intracellular mitochondrial trafficking in health and disease. Ageing Res Rev. 2020;62:101128. - PMC - PubMed

Publication types

MeSH terms

LinkOut - more resources