. 2024 Sep 9;14(15):5778-5792.
doi: 10.7150/thno.95141. eCollection 2024.

Hypoxia-induced TGFBI maintains glioma stem cells by stabilizing EphA2

Affiliations

Hypoxia-induced TGFBI maintains glioma stem cells by stabilizing EphA2

Zirong Chen et al. Theranostics. .

Abstract

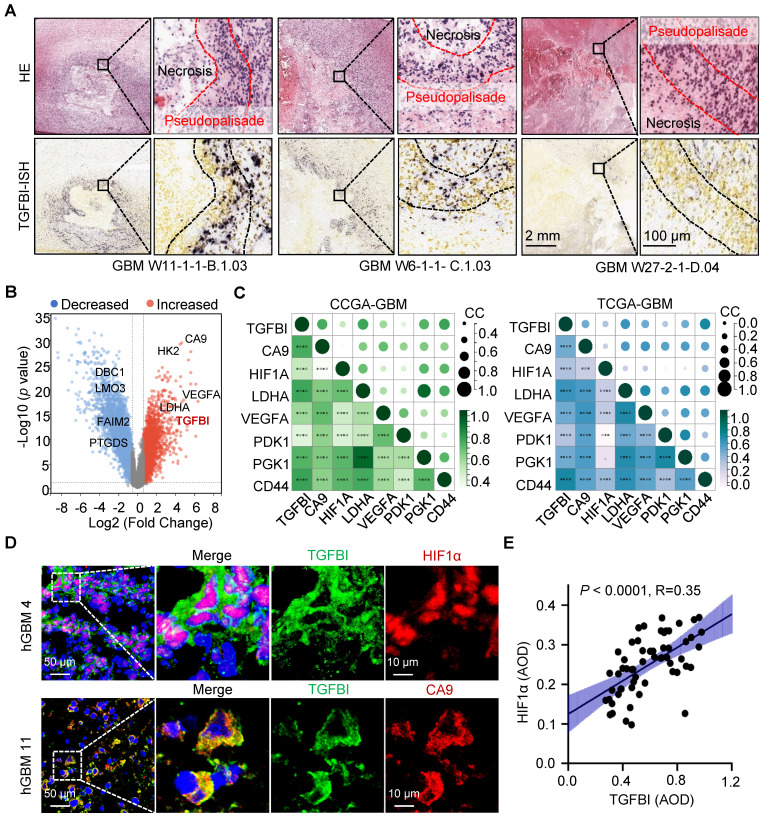
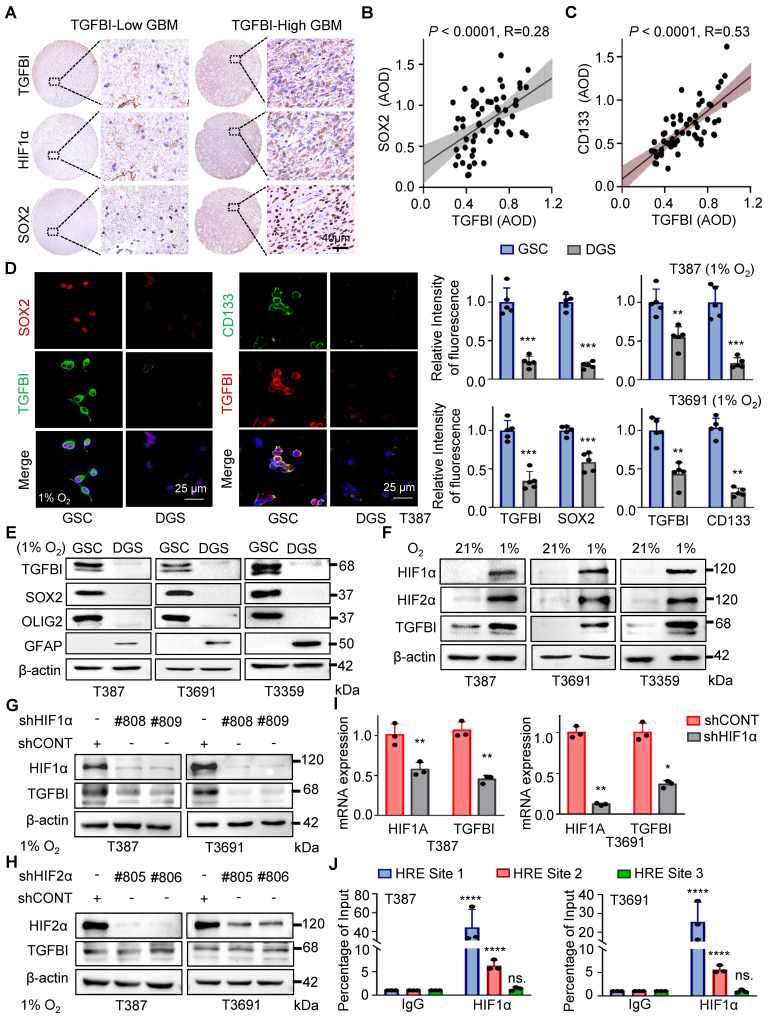
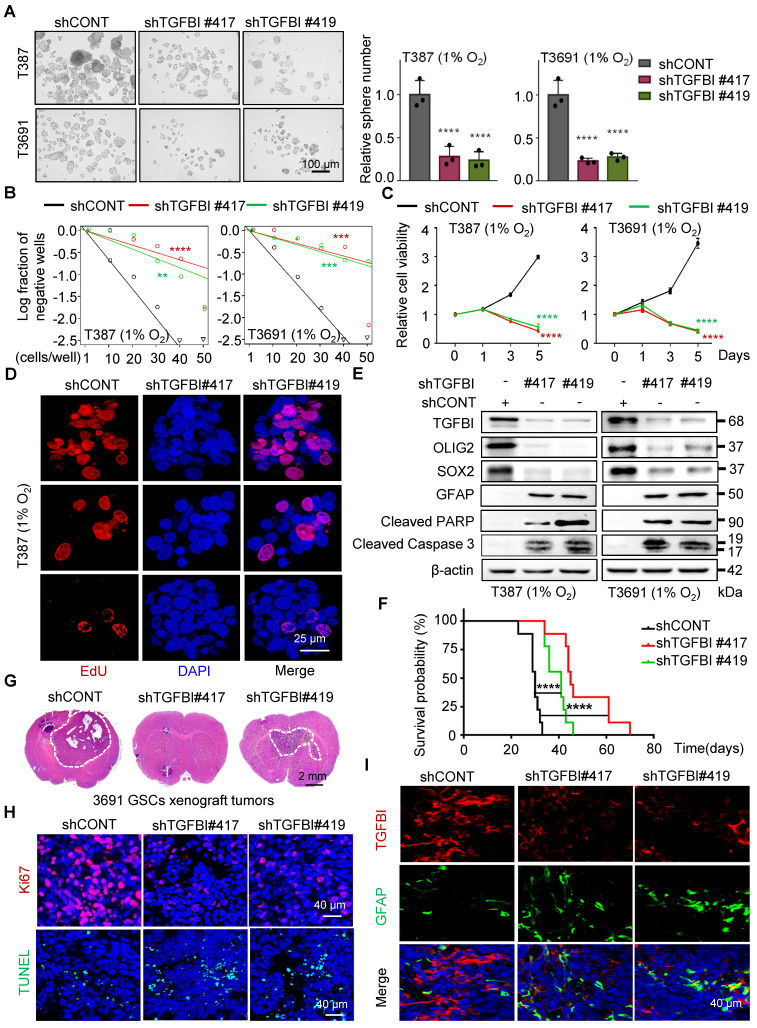
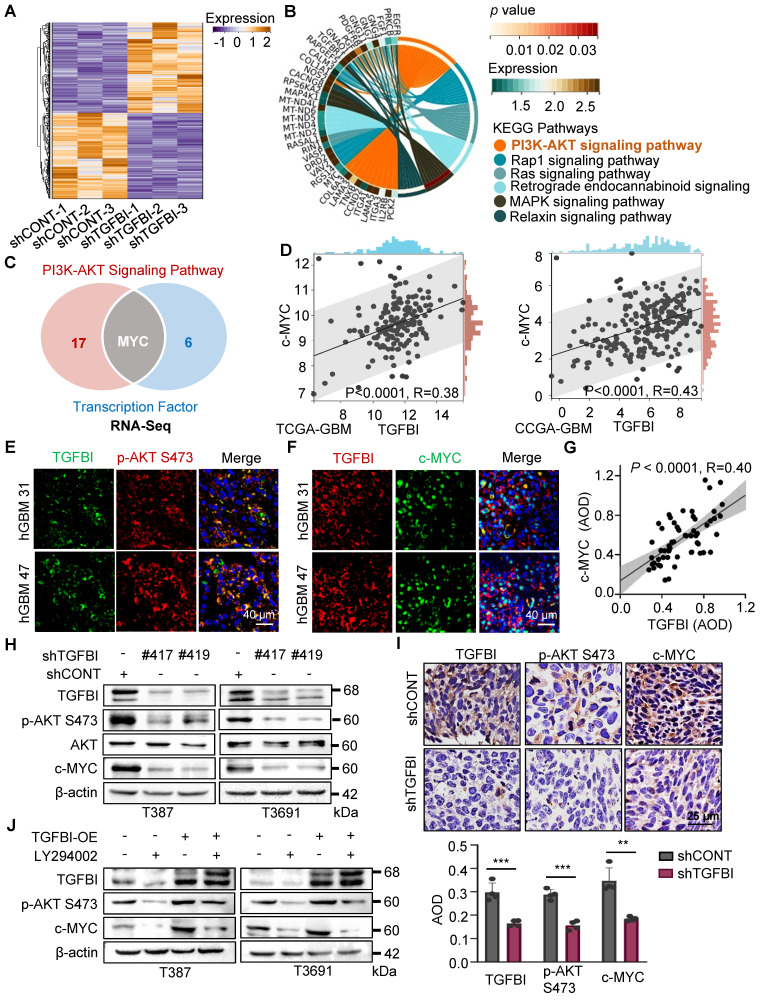
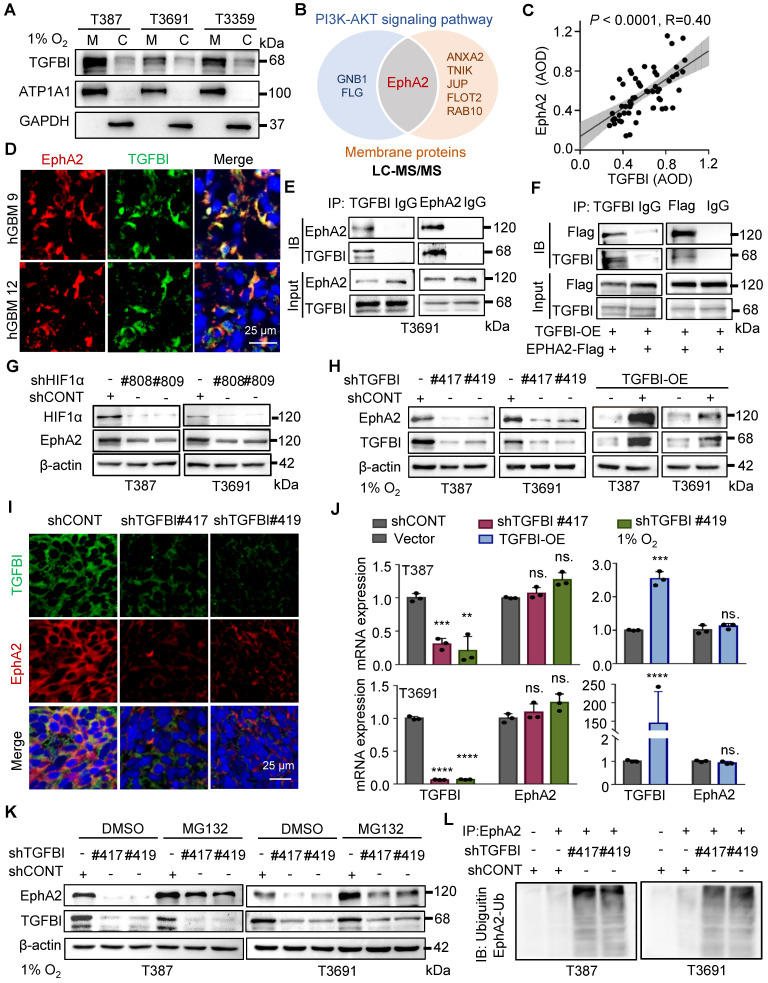
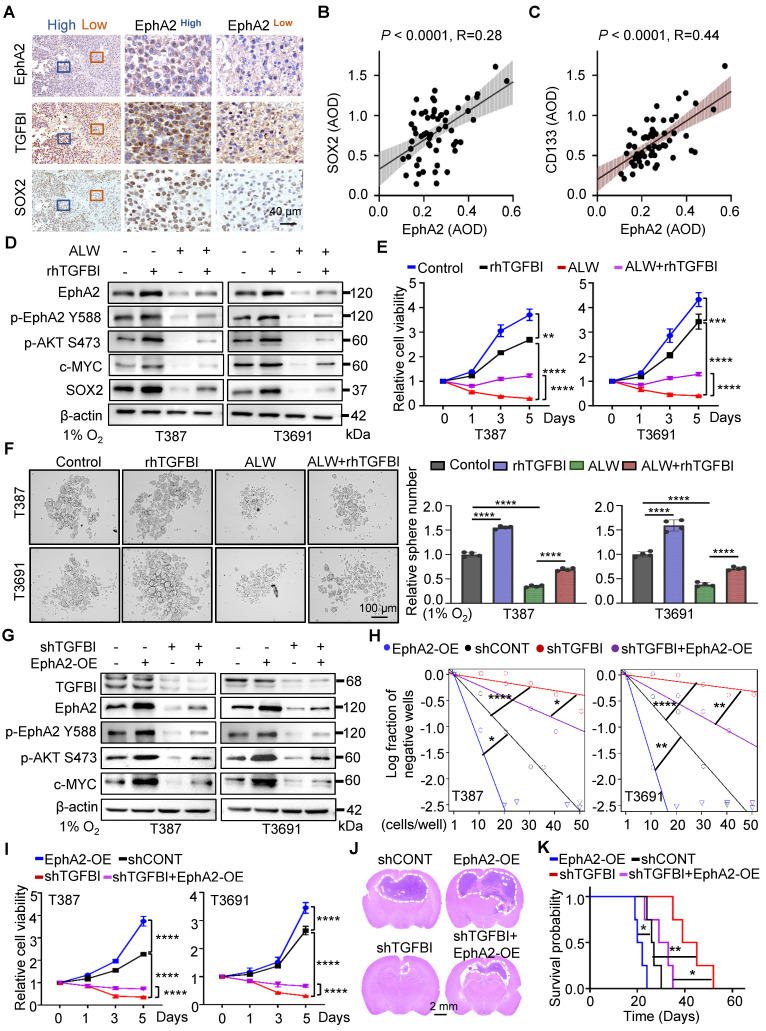
Rationale: Glioma stem cells (GSCs) have emerged as pivotal drivers of tumor malignancy, sustained by various microenvironmental factors, including immune molecules and hypoxia. In our previous study, we elucidated the significant role of transforming growth factor beta-induced protein (TGFBI), a protein secreted by M2-like tumor-associated macrophages, in promoting the malignant behavior of glioblastoma (GBM) under normoxic conditions. Building upon these findings, the objective of this study was to comprehensively explore the crucial role and underlying mechanisms of autocrine TGFBI in GSCs under hypoxic conditions. Methods: We quantified TGFBI expression in glioma specimens and datasets. In vitro and in vivo assays were employed to investigate the effects of TGFBI on sustaining self-renewal and tumorigenesis of GSCs under hypoxia. RNA-seq and LC-MS/MS were conducted to explore TGFBI signaling mechanisms. Results: TGFBI is preferentially expressed in GSCs under hypoxic conditions. Targeting TGFBI impair GSCs self-renewal and tumorigenesis. Mechanistically, TGFBI was upregulated by HIF1α in GSCs and predominantly activates the AKT-c-MYC signaling pathway in GSCs by stabilizing the EphA2 protein through preventing its degradation. Conclusion: TGFBI plays a crucial role in maintaining the stem cell properties of GSCs in the hypoxic microenvironment. Targeting the TGFBI/EphA2 axis emerges as a promising and innovative strategy for GBM treatment, with the potential to improve the clinical outcomes of patients.

Keywords: EphA2; GSC; Hypoxia; Microenvironment; TGFBI.


Conflict of interest statement

Competing Interests: The authors have declared that no competing interest exists.

Figures

Figure 1
Figure 1
TGFBI is associated with the hypoxic microenvironment in human gliomas. (A) FISH staining of TGFBI in human GBM specimens (Ivy gap datasets). Scale bars: 2 mm; enlarged image: 100 μm. (B) Volcano map showing genes highly expressed in hypoxia region (pseudopalisade and microvascular proliferation regions). Each dot represents a gene. (C) Correlation between TGFBI and mRNA expression of hypoxia-related gene in the CCGA-GBM and TGGA-GBM datasets. CC, correlation coefficient; Dot size and color represent the correlation coefficient. (D) IF staining of TGFBI (green) and two hypoxia-associated markers, HIF1α (above, red) and CA9 (bottom, red), in human GBM specimens. Scale bars: 50 μm; enlarged image: 10 μm. (E) IHC staining demonstrating the association between TGFBI and HIF1α proteins in human gliomas. AOD, Average of density; n = 58.
Figure 2
Figure 2
TGFBI induction by HIF1α in GSCs under hypoxia. (A) IHC staining of TGFBI, HIF1α, and SOX2 in the same human high- and low-expression GBM tissues. Scale bars: 40 μm (B) IHC staining demonstrating the association between TGFBI and SOX2 proteins in human gliomas. n = 58 (C) IHC staining demonstrating the association between TGFBI and CD133 proteins in human gliomas. n = 58 (D) IF staining of TGFBI and two stem cell-associated markers (SOX2, CD133) in T387 GSCs. Also shown is the quantification of the relative intensity of fluorescence of T387 and T3691 GSCs (right, n = 5). (E) IB of TGFBI, SOX2, OLIG2, and GFAP proteins in the indicated GSCs and differentiated GSCs (DGS). (F) IB of TGFBI, HIF1α, and HIF2α in matched GSCs cultured under standard (21% O2) or hypoxic (1% O2) conditions for 24 hours. (G) IB of TGFBI protein expression in the GSCs transduced with shCONT or shHIF1α and (H) shHIF2α under hypoxia. (I) qRT-PCR analysis showing mRNA expression of TGFBI and HIF1α in GSCs transduced with shCONT or shHIF1α. (J) ChIP analyses showing HIF1α binding to the TGFBI promoter in GSCs under hypoxia. Data are presented as the mean ± SD. **P <0.01; ***P < 0.001; ****P < 0.0001.
Figure 3
Figure 3
TGFBI plays essential role in maintaining self-renewal and tumorigenesis of GSCs. (A) Bright-field microscopy (left) showing the tumorsphere formation of GSCs transduced with shCONT or shTGFBI. Quantification of relative tumorsphere numbers is depicted (right, n = 3). Scale bars: 100 μm. (B) Limiting dilution assays of indicated GSCs. (C) Cell titer assay of indiated GSCs. n = 6 (D) Confocal image of EdU incorporation in T387 GSC tumorspheres. n = 4; EdU is represented in red. The image of T3691 and quantification of the fraction of EdU+ cells is avaliable in Figure S3A. Scale bars: 25 μm (E) IB of stem-related (SOX2, OLIG2, and GFAP) and apoptosis-related (cleaved PARP and cleaved caspase3) proteins in the GSCs transduced with shCONT or shTGFBI. (F) Kaplan-Meier survival curve of mice bearing T3691 GSCs expressing shCONT or shTGFBI. n = 10 (G) H&E staining of brain sections from xenograft mice. Scale bars: 2 mm. (H) IF image in mouse xenografts injected with shCONT and shTGFBI GSCs. Ki67 is shown in red, TUNEL in green. Scale bars: 40 μm. Quantification of the fraction of Ki67+ and TUNEL+ cells in mouse xenografts are shown in Figure S3B. n = 5 (I) IF image of TGFBI and GFAP in mouse xenografts. Scale bars: 40 μm. Quantification of the relative intensity of fluorescence is shown in Figure S3C. n = 4; Data are presented as the mean ± SD. **P < 0.01; ***P <0.001; ****P < 0.0001.
Figure 4
Figure 4
TGFBI sustains GSCs through AKT-c-MYC pathway. (A) Heatmap illustrating the transcriptional profile of T3691 GSCs transduced with shCONT or shTGFBI. (B) KEGG pathway analysis of downregulated differentially expressed genes in shTGFBI T3691 GSCs (compared to the shCONT group). (C) Venn diagram depicting the differentially expressed genes highly active in the PI3K-AKT signaling pathway and serving as transcription factors. (D) Scatter plot displaying the correlation between TGFBI and c-MYC mRNA expression in the TCGA-GBM and CGGA-GBM datasets. (E) IF image of TGFBI and p-AKT S473 and (F) c-MYC in human GBM specimens. Scale bars: 40 μm. (G) IHC stain demonstrating the association between TGFBI and c-MYC proteins in human gliomas. n = 58 (H) IB of p-AKT S473 and c-MYC proteins in the GSCs transduced with shCONT or shTGFBI under hypoxia. (I) IHC stain of TGFBI, p-AKT S473, and c-MYC proteins in the mouse xenografts. Also shown is the quantification of the average density of mouse xenografts (bottom, n = 4). (J) IB of p-AKT S473 and c-MYC proteins in the indicated cells. LY294002, an AKT pathway inhibitor.
Figure 5
Figure 5
TGFBI binds to EphA2 and stabilizes it by inhibiting its proteasomal degradation. (A) Analysis of membrane and cytosol protein extraction in GSCs under hypoxia. M, membrane; C, cytosol (B) Venn diagram displaying TGFBI-binding proteins of T3691GSCs under hypoxia highly expressed in the PI3K-AKT signaling pathway and located in membrane according to LC-MS/MS. (C) IHC staining demonstrating the correlation between TGFBI and EphA2 proteins in human gliomas. n = 58 (D) IF image of TGFBI and EphA2 in human GBM specimens. Scale bars: 25 μm. (E) Co-IP of endogenous TGFBI and EphA2 in T3691 GSCs under hypoxia. IgG served as a control. (F) Co-IP of exogenous TGFBI and EphA2 in 293T. (G) IB of EphA2 protein in the GSCs transduced with shCONT or shHIF1α under hypoxia. (H) IB of EphA2 protein in the GSCs with TGFBI knockdown or overexpression. (I) IF image of TGFBI and EphA2 in the indicated mouse xenografts. The quantification of the relative intensity of fluorescence is shown in Figure S4F (n = 8). Scale bars: 25 μm. (J) qRT-PCR analysis of TGFBI and EphA2 mRNA expression in the indicated GSCs. (K) IB of EphA2 proteins in the indicated cells. MG132, a proteasome inhibitor. (L) Co-IP of ubiquitin-EphA2 in the indicated GSCs. The input is shown in Figure S4H. Data are presented as the mean ± SD. ns., no significance; **P < 0.01; ***P < 0.001; ****P < 0.0001.
Figure 6
Figure 6
The binding of TGFBI to EphA2 promotes self-renewal and tumorigenesis of GSCs both in vitro and in vivo. (A) IHC staining showing TGFBI, EphA2, and SOX2 expression in the same human high- and low-expression GBM tissues. Scale bars: 40 μm. (B) IHC staining demonstrating the association between EphA2 and SOX2 and (C) CD133proteins in human gliomas. n = 58 (D) IB of AKT-c-MYC pathway and stem-associated proteins in the indicated GSCs. ALW, ALW-Ⅱ-41-27, an EphA2 inhibitor; rhTGFBI, recombinant human TGFBI protein. (E) Cell titer assay result of indicated GSCs. n = 6 (F) Bright-field microscopy (left) showing the tumorsphere formation of indicated GSCs under hypoxia. The quantification of relative tumorsphere number is shown on the right. n = 4; Scale bars: 100 μm. (G) IB of AKT-c-MYC pathway proteins in the indicated GSCs. OE, overexpression (H) Limiting dilution assays of the indicated GSCs. (I) Cell titer assay results of indicated GSC (n = 6). (J) H&E staining of brain sections from mouse xenograft. Scale bars: 2 mm (K) Kaplan-Meier survival curve of mice bearing indicated GSCs. n = 5; Data are presented as the mean ± SD. *P < 0.05; **P < 0.01; ****P < 0.0001.

References

    1. Ostrom QT, Cioffi G, Gittleman H, Patil N, Waite K, Kruchko C. et al. CBTRUS statistical report: primary brain and other central nervous system tumors diagnosed in the United States in 2012-2016. Neuro Oncol. 2019;21(Suppl 5):v1–v100. - PMC - PubMed
    1. Boyd NH, Tran AN, Bernstock JD, Etminan T, Jones AB, Gillespie GY. et al. Glioma stem cells and their roles within the hypoxic tumor microenvironment. Theranostics. 2021;11:665–83. - PMC - PubMed
    1. Kim H, Lin Q, Glazer PM, Yun Z. The hypoxic tumor microenvironment in vivo selects the cancer stem cell fate of breast cancer cells. Breast Cancer Res. 2018;20(1):16. - PMC - PubMed
    1. Najafi M, Farhood B, Mortezaee K, Kharazinejad E, Majidpoor J, Ahadi R. Hypoxia in solid tumors: a key promoter of cancer stem cell (CSC) resistance. J Cancer Res Clin Oncol. 2020;146(1):19–31. - PMC - PubMed
    1. Li H, Song C, Zhang Y, Liu G, Mi H, Li Y. et al. Transgelin Promotes Glioblastoma stem cell hypoxic responses and maintenance through p53 acetylation. Adv Sci (Weinh) 2024;11(7):e2305620. - PMC - PubMed

Publication types

MeSH terms

Substances