. 2024 Sep 9;14(15):5745-5761.
doi: 10.7150/thno.100116. eCollection 2024.

Collagen type I PET/MRI enables evaluation of treatment response in pancreatic cancer in pre-clinical and first-in-human translational studies

Affiliations

Collagen type I PET/MRI enables evaluation of treatment response in pancreatic cancer in pre-clinical and first-in-human translational studies

Shadi A Esfahani et al. Theranostics. .

Abstract

Pancreatic ductal adenocarcinoma (PDAC) is an invasive and rapidly progressive malignancy. A major challenge in patient management is the lack of a reliable imaging tool to monitor tumor response to treatment. Tumor-associated fibrosis characterized by high type I collagen is a hallmark of PDAC, and fibrosis further increases in response to neoadjuvant chemoradiotherapy (CRT). We hypothesized that molecular positron emission tomography (PET) using a type I collagen-specific imaging probe, 68Ga-CBP8 can detect and measure changes in tumor fibrosis in response to standard treatment in mouse models and patients with PDAC. Methods: We evaluated the specificity of 68Ga-CBP8 PET to tumor collagen and its ability to differentiate responders from non-responders based on the dynamic changes of fibrosis in nude mouse models of human PDAC including FOLFIRNOX-sensitive (PANC-1 and PDAC6) and FOLFIRINOX-resistant (SU.86.86). Next, we demonstrated the specificity and sensitivity of 68Ga-CBP8 to the deposited collagen in resected human PDAC and pancreas tissues. Eight male participant (49-65 y) with newly diagnosed PDAC underwent dynamic 68Ga-CBP8 PET/MRI, and five underwent follow up 68Ga-CBP8 PET/MRI after completing standard CRT. PET parameters were correlated with tumor collagen content and markers of response on histology. Results: 68Ga-CBP8 showed specific binding to PDAC compared to non-binding 68Ga-CNBP probe in two mouse models of PDAC using PET imaging and to resected human PDAC using autoradiography (P < 0.05 for all comparisons). 68Ga-CBP8 PET showed 2-fold higher tumor signal in mouse models following FOLFIRINOX treatment in PANC-1 and PDAC6 models (P < 0.01), but no significant increase after treatment in FOLFIRINOX resistant SU.86.86 model. 68Ga-CBP8 binding to resected human PDAC was significantly higher (P < 0.0001) in treated versus untreated tissue. PET/MRI of PDAC patients prior to CRT showed significantly higher 68Ga-CBP8 uptake in tumor compared to pancreas (SUVmean: 2.35 ± 0.36 vs. 1.99 ± 0.25, P = 0.036, n = 8). PET tumor values significantly increased following CRT compared to untreated tumors (SUVmean: 2.83 ± 0.30 vs. 2.25 ± 0.41, P = 0.01, n = 5). Collagen deposition significantly increased in response to CRT (59 ± 9% vs. 30 ± 9%, P=0.0005 in treated vs. untreated tumors). Tumor and pancreas collagen content showed a positive direct correlation with SUVmean (R2 = 0.54, P = 0.0007). Conclusions: This study demonstrates the specificity of 68Ga-CBP8 PET to tumor type I collagen and its ability to differentiate responders from non-responders based on the dynamic changes of fibrosis in PDAC. The results highlight the potential use of collagen PET as a non-invasive tool for monitoring response to treatment in patients with PDAC.

Keywords: PET imaging; fibrosis; pancreatic cancer; treatment response; type I collagen.


Conflict of interest statement

Competing Interests: PC has equity in and is a consultant to Collagen Medical LLC, has equity in Reveal Pharmaceuticals Inc., and has research support from Transcode Therapeutics and Pliant Therapeutics. PC is a co-inventor of US Patent 10,471,162 which covers 68Ga-CBP8 and is assigned to the General Hospital Corporation. SE has research support from Sofie Biosciences, Telix, and Novartis Pharmaceuticals. ARP has held Equity in C2i Genomics, XGenomes, Cadex, Vionix and Parithera. In the last 36 months, she has served as an advisor/consultant for Eli Lilly, Mirati, Pfizer, Inivata, Biofidelity, Checkmate Pharmaceuticals, FMI, Guardant, Abbvie, Bayer, Delcath, Taiho, CVS, Value Analytics Lab, Seagen, Saga, AZ, Scare Inc, Illumina, Taiho, Hookipa, Kahar Medical, Xilio Therapeutics, Sirtex, Takeda, and Science For America. She receives fees from Up to Date. She has received travel fees from Karkinos Healthcare. She has been on the DSMC for a Roche study and on the Steering Committee for Exilixis. She has received research funding to the Institution from PureTech, PMV Pharmaceuticals, Plexxicon, Takeda, BMS, Mirati, Novartis, Erasca, Genentech, Daiichi Sankyo, Syndax, Revolution Medicine and Parthenon. UM is a co-founder, shareholder, and consultant (Scientific Advisory Board) of CytoSite BioPharma. TSH is a consultant for Synthetic Biologics, Novocure, Boston Scientific, Neogenomics, Merck, GSK, NextCure, serves on the advisory board of PanTher Therapeutics (Equity), and Lustgarten Foundation, and has received research funding from Taiho, Astra-Zeneca, BMS, GSK, ItraOp and Ipsen. GMB has sponsored research agreements through her institution with: Olink Proteomics, Teiko Bio, InterVenn Biosciences, Palleon Pharmaceuticals. She served on advisory boards for Iovance, Merck, Nektar Therapeutics, Novartis, and Ankyra Therapeutics. She consults for Merck, InterVenn Biosciences, Iovance, and Ankyra Therapeutics. She holds equity in Ankyra Therapeutics. Other authors declare that they have no competing interests.

Figures

Figure 1
Figure 1
Collagen increases in the tumor extracellular matrix in response to chemotherapy in mouse models of human PDAC. (A) Cell viability assay at various concentrations of FOLFIRINOX chemotherapy demonstrating the sensitivity of PDAC6 and PANC-1 cells at 24- and 48-h post-treatment and the relative resistance of SU.86.86 cells under the same conditions (n = 3-6 wells/condition). (B) Representative histological evaluation of pancreas and subcutaneously grown tumor tissues in the nude mice extracted before and at multiple days after treatment with FOLFIRINOX (administered every 3 days) and stained with hematoxylin and eosin (H&E), Masson Trichrome and Picro-Sirius Red (PSR) for collagen, immunohistochemical staining for type I collagen, and cleaved caspase-3 for apoptosis (Scale bar: 200 µm). (C) Quantitative analysis of collagen from PSR stained tissue reported as collagen proportional area (CPA). (D) Measure of collagen on the extracted tumors reported as hydroxyproline-to-proline (Hyp/Pro) ratio. (E) Quantitative immunohistochemical staining of apoptosis marker cleaved caspase-3 in the tumors at multiple time points. Each data point represents one mouse. Data are shown in mean ± SD. P values are the result of one-way ANOVA with multiple comparisons and post hoc Tukey test.
Figure 2
Figure 2
68Ga-CBP8 specifically binds to collagen type 1 in mouse models of PDAC. (A) Structure of the type I collagen binding 68Ga-CBP8 and control nonbinding 68Ga-CNBP probes. There are 3 NODAGA moieties for potential Ga-68 labeling and the radiolabeled product is a mixture of these three isomers with a representative isomer shown here. (B) Schematic illustration of the study design for testing the specificity of 68Ga-CBP8 and control 68Ga-CNBP probes in untreated PDAC models based on dynamic PET over two consecutive days. (C) Tumor uptake curves from dynamic PET acquired 0-60 min after intravenous injection of each probe (68Ga-CBP8 in blue line and 68Ga-CNBP in black line) quantified as the percentage of injected dosage per cc (%ID/cc) (n = 4-7 male nude mice, Data are shown in mean ± SD). (D) Clearance of the 68Ga-CBP8 from the blood (red line) over 60 min and tumor-to-blood uptake ratio (green line) reaching above 1 at 30-60 min post-injection (n = 5-6, Data are shown in mean ± SD). (E) Representative Picro-Sirius Red stained tissue of extracted tumors and correlation of collagen proportional area (CPA) with the mean tumor PET uptake values at 30-60 min of imaging with the specific 68Ga-CBP8 (R2 = 0.67, P = 0.001) and linear control 68Ga-CNBP (R2 = 0.015, P = 0.72) (each data point represents one mouse). PANC-1 data is shown in orange and PDAC6 in blue color.
Figure 3
Figure 3
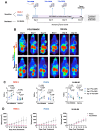
68Ga-CBP8 shows specific changes in type I collagen in response to chemotherapy in mouse models of PDAC. (A) Schematic illustration of study design to demonstrate the specificity of 68Ga-CBP8 compared to control 68Ga-CNBP PET over multiple days of treatment with FOLFIRINOX (administered every 3 days) in PANC-1 tumor-bearing mice (male nude mice, n = 4-6/group). (B-C) Representative coronal PET images (tumors shown in yellow circle) and quantitative analyses demonstrating a significantly higher uptake of 68Ga-CBP8 in the tumors at all time points compared to the control 68Ga-CNBP (paired t-test, two-tailed), highlighting the specificity of the probe for collagen I. Data also show an increase in tumor 68Ga-CBP8 following FOLFIRINOX treatment but no increase in 68Ga-CNBP tumor uptake with treatment. Data are shown in mean ± SD.
Figure 4
Figure 4
68Ga-CBP8 enables monitoring of the response to chemotherapy in mouse models of human PDAC and differentiates responders from non-responders. (A) Schematic study design. (B) Representative coronal PET images of the nude mice with PANC-1 and SU.86.86 tumors imaged from 30-60 min after injection of 68Ga-CBP8 at days 0, 9, and 15 after treatment with intravenous FOLFIRINOX or vehicle (tumors shown in yellow circle). (C) Quantitative analyses of 68Ga-CBP PET tumor uptake at days 0, 9, and 15 of treatment with FOLFIRINOX or vehicle (n = 4-8/group, ANOVA with multiple comparisons and post hoc Tukey test). (D) Tumor volume curves over 24 days of treatment with FOLFIRINOX or vehicle. Data are shown in mean ± SD.
Figure 5
Figure 5
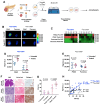
68Ga-CBP8 detects fibrosis and measures response to neoadjuvant chemoradiotherapy in resected human pancreatic tumor tissues. (A) Schematic illustration of human pancreatic ductal adenocarcinoma (PDAC) and pancreas tissue preparation, incubation with collagen-specific 68Ga-CBP8 and control 68Ga-CNBP probes, and autoradiography. (B) Representative autoradiography images of fresh resected human tissues and (C) heatmap of the autoradiography signal. (D-E) Quantitative comparison of autoradiography signal in the treated and untreated PDAC tissues and the patients' matched adjacent uninvolved pancreas (P) for 68Ga-CBP8 (D) and 68Ga-CNBP (E) (n = 8/group, unpaired t-test, two-tailed). (F) Representative H&E, Picro-Sirius Red (PSR), and type I collagen immunohistochemical staining of human tissues (scale bar: 200 µm). (G) Quantitative comparison of collagen proportional area (CPA) from PSR stained slides of human tumor and pancreas tissues (n = 8/group, unpaired t-test, two-tailed). (H) Correlation of the 68Ga-CBP8 or 68Ga-CNBP autoradiography signal with CPA. Each data point represents one tissue. RT: room temperature, a.u: arbitrary unit.
Figure 6
Figure 6
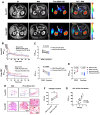
First-in-human evaluation of type I collagen PET in patients with PDAC. (A) Representative axial images of standard-of-care iodinated contrast-enhanced computed tomography (CT) on late arterial phase, gadolinium-enhanced magnetic resonance image (MRI) on portal venous phase, 68Ga-CBP8 PET at 30-45 min post-injection, and fused PET and T1-weighted MR images in the axial plane are shown for a subject before and after standard chemoradiotherapy (CRT). PDAC tumor is shown with a white arrow. (B) Evaluation of dynamic PET from 0-90 min after injection of the 68Ga-CBP8 shows rapid clearance of the probe from the blood (dashed red line), with blood SUVmean reaching that of the uninvolved pancreas SUVmean (blue line) at 15-30 min post-injection. Uptake to untreated PDAC is shown with black and to treated PDAC with dark red line. Data is shown in mean ± SEM. (C) The tumor SUVmean is significantly higher than the pancreas at both pre-CRT and post-CRT scans (paired t-test). (D) PET uptake values at 30-60 min post-injection for the five patients who underwent PET scans at both time points show increased tumor SUVmean in response to neoadjuvant CRT paired t-test). (E) Representative H&E and Picro-Sirius Red staining of the diagnostic core of tumor (T), and resected treated tumor and adjacent pancreas (P) tissues. (F) Quantitative analyses of histology show higher CPA in the treated compared to untreated tumors (** P = 0.0005 for all available tissues using unpaired t-test; P = 0.005 for 4 patients with available pre- and post-CRT tissues using paired t-test). (G) Significant positive correlation between the tissue collagen on histology (CPA) and SUVmean.

References

    1. Siegel RL, Miller KD, Jemal A. Cancer Statistics, 2017. CA Cancer J Clin. 2017;67:7–30. - PubMed
    1. Rawla P, Sunkara T, Gaduputi V. Epidemiology of Pancreatic Cancer: Global Trends, Etiology and Risk Factors. World J Oncol. 2019;10:10–27. - PMC - PubMed
    1. Rahib L, Smith BD, Aizenberg R, Rosenzweig AB, Fleshman JM, Matrisian LM. Projecting cancer incidence and deaths to 2030: the unexpected burden of thyroid, liver, and pancreas cancers in the United States. Cancer Res. 2014;74:2913–21. - PubMed
    1. Arvold ND, Niemierko A, Mamon HJ, Fernandez-del Castillo C, Hong TS. Pancreatic cancer tumor size on CT scan versus pathologic specimen: implications for radiation treatment planning. Int J Radiat Oncol Biol Phys. 2011;80:1383–90. - PMC - PubMed
    1. Seufferlein T, Bachet JB, Van Cutsem E, Rougier P, Group EGW. Pancreatic adenocarcinoma: ESMO-ESDO Clinical Practice Guidelines for diagnosis, treatment and follow-up. Ann Oncol. 2012;23(Suppl 7):vii33–40. - PubMed

Publication types

MeSH terms