

Relationship between Neighborhood-Level Social Risk Factor Measures and Presenting Glaucoma Severity Utilizing Multilevel Modeling
- PMID: 39346573
- PMCID: PMC11437858
- DOI: 10.1016/j.xops.2024.100598
Relationship between Neighborhood-Level Social Risk Factor Measures and Presenting Glaucoma Severity Utilizing Multilevel Modeling
Abstract
Purpose: The neighborhood and built environment social determinant of health domain has several social risk factors (SRFs) that are modifiable through policy efforts. We investigated the impact of neighborhood-level SRFs on presenting glaucoma severity at a tertiary eye care center.
Design: A cross-sectional study from August 2012 to May 2022 in the University of Michigan electronic health record (EHR).
Participants: Patients with a diagnosis of any open-angle glaucoma with ≥1 eye care visit at the University of Michigan Kellogg Eye Center and ≥1 reliable visual field (VF).
Methods: Participants who met inclusion criteria were identified by International Classification of Diseases ninth and tenth revision codes (365.x/H40.x). Data extracted from the EHR included patient demographics, address, presenting mean deviation (MD), and VF reliability. Addresses were mapped to SRF measures at the census tract, block group, and county levels. Multilevel linear regression models were used to estimate the fixed effects of each SRF on MD, after adjusting for patient-level demographic factors and a random effect for neighborhood. Interactions between each SRF measure with patient-level race and Medicaid status were tested for an additive effect on MD.
Main outcome measures: The main outcome measure was the effect of SRF on presenting MD.
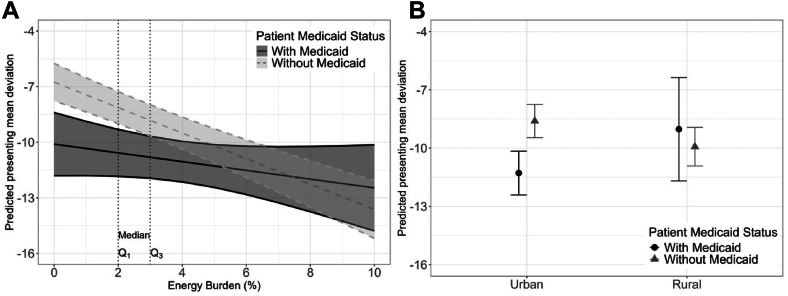
Results: In total, 4428 patients were included in the analysis who were, on average, 70.3 years old (standard deviation = 11.9), 52.6% self-identified as female, 75.8% self-identified as White race, and 8.9% had Medicaid. The median value of presenting MD was -4.94 decibels (dB) (interquartile range = -11.45 to -2.07 dB). Neighborhood differences accounted for 4.4% of the variability in presenting MD. Neighborhood-level measures, including worse area deprivation (estimate, β = -0.31 per 1-unit increase; P < 0.001), increased segregation (β = -0.92 per 0.1-unit increase in Theil's H index; P < 0.001), and increased neighborhood Medicaid (β = -0.68; P < 0.001) were associated with worse presenting MD. Significant interaction effects with race and Medicaid status were found in several neighborhood-level SRF measures.
Conclusions: Although patients' neighborhood SRF measures accounted for a minority of the variability in presenting MD, most neighborhood-level SRFs are modifiable and were associated with clinically meaningful differences in presenting MD. Policies that aim to reduce neighborhood inequities by addressing allocation of resources could have lasting impacts on vision outcomes.
Financial disclosures: Proprietary or commercial disclosure may be found in the Footnotes and Disclosures at the end of this article.
Keywords: Glaucoma; Multilevel modeling; Neighborhood and built environment; Social determinants of health; Social risk factors.
© 2024 by the American Academy of Ophthalmology.
Figures


References
-
- Su N.H., Moxon N.R., Wang A., French D.D. Associations of social determinants of health and self-reported visual difficulty: analysis of the 2016 national health interview survey. Ophthalmic Epidemiol. 2020;27(2):93–97. - PubMed
-
- Social determinants of health, health equity, and vision loss. Centers for disease control and prevention. 2023. https://www.cdc.gov/visionhealth/determinants/index.html#:∼:text=million...
Grants and funding
LinkOut - more resources
Full Text Sources
Miscellaneous
