

Inflammatory Manifestations Associated With Gut Dysbiosis in Alzheimer's Disease
- PMID: 39346576
- PMCID: PMC11436273
- DOI: 10.1155/2024/9741811
Inflammatory Manifestations Associated With Gut Dysbiosis in Alzheimer's Disease
Abstract
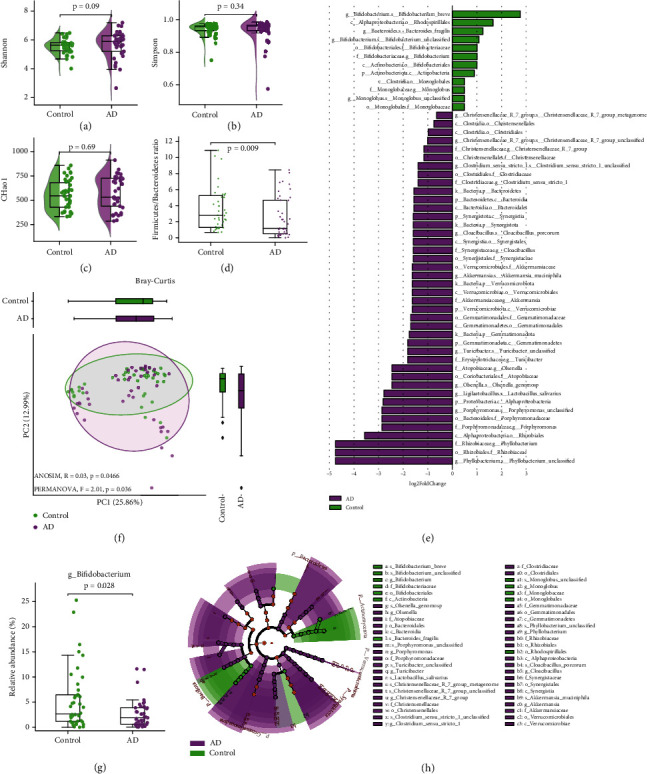
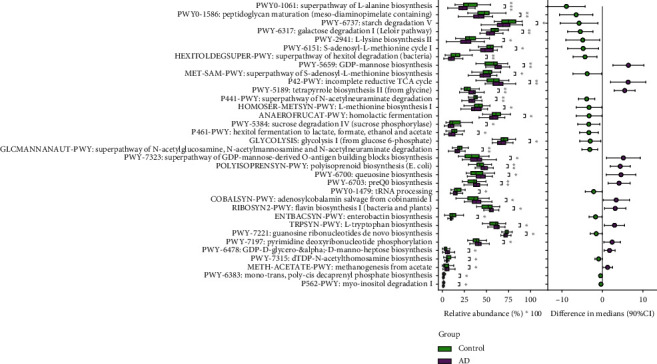
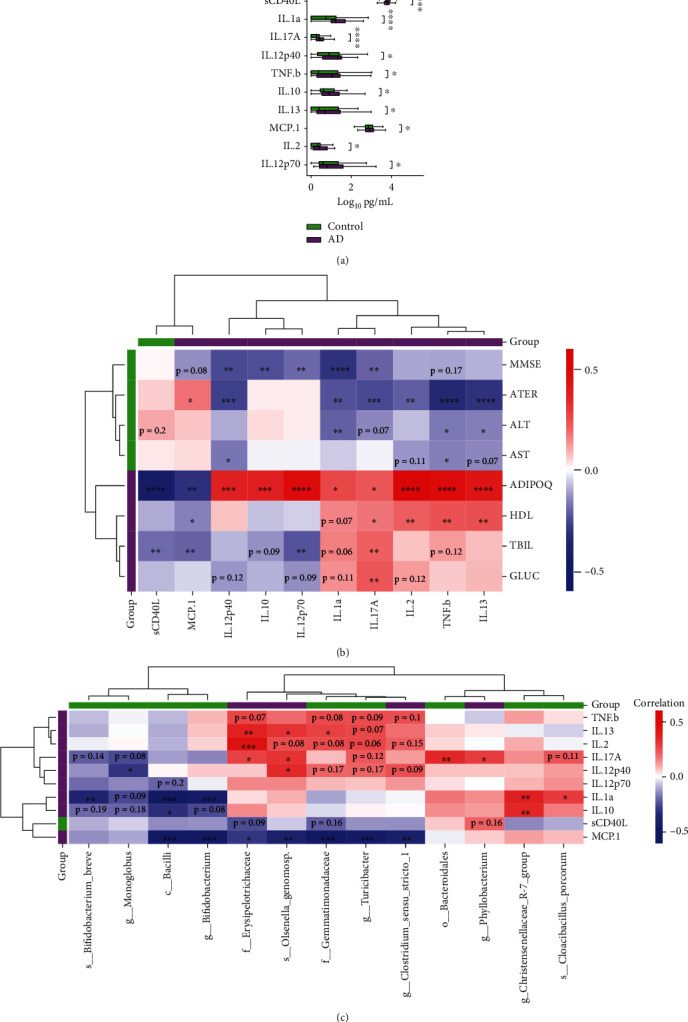
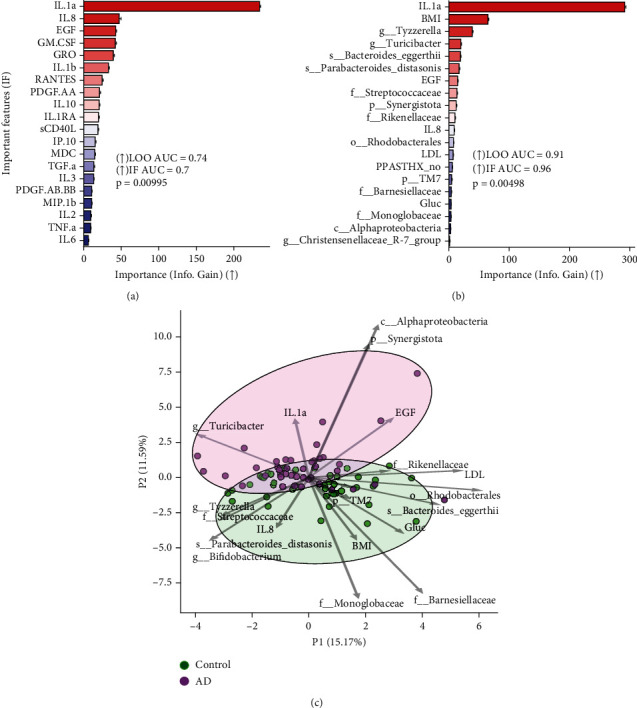
Recent studies strongly suggest that gut microbiome can influence brain functions and contribute to the development of Alzheimer's disease (AD). However, reported changes in the gut microbiomes in AD patients from different countries are not similar, and more research is needed to reveal the relationships between human microbiomes and AD in diverse ethnic populations. There is also an assumption that microbiome-associated peripheral inflammation might drive the development of sporadic AD. This cross-sectional study is aimed at analyzing the gut microbial profile and exploring potential associations with blood cytokines and some clinical parameters among individuals diagnosed with Alzheimer's in Kazakhstan. Consistent with previous studies, we have found that the microbial landscape in AD reveals specific alterations in the gut microbiome. Specifically, the AD patient group showed a decreased Firmicutes/Bacteroidetes ratio. The differential abundance analysis highlighted a dysbiosis in the gut microbiota of AD patients, marked by a reduced presence of Bifidobacterium, particularly B. breve. In our study, AD patients' altered gut microbiota composition notably features an increased presence of Pseudomonadota like Phyllobacterium and inflammatory bacteria such as Synergistetes and the Christensenellaceae family. The metabolic profiling of the AD microbiome reveals a predominant presence of pathways related to sugar, carrier molecules, tetrapyrrole, pyrimidine biosynthesis, and nucleic acid processing. This analysis also highlighted a marked reduction in SCFA, carbohydrate, polysaccharide, polyamine, and myo-inositol degradation pathways. The increases in the proinflammatory cytokines IL-1a, IL-8, IL-17A, IL-12p40, TNF-β, MCP-1, IL-2, and IL-12p70 and the anti-inflammatory cytokines IL-10 and IL-13 were observed in AD patients. Key variables driving the separation of AD and controls include inflammatory markers (IL-1a and IL-8), growth factors (EGF), lipids (LDL), BMI, and gut microbes, like genus Tyzzerella and Turicibacter and species Parabacteroides distasonis and Bacteroides eggerthii. We have also demonstrated that almost all cytokines strongly correlate with serum adiponectin levels and specific microbial taxa in AD patients. Thus, our findings identify potential microbial and inflammatory signatures in an ethnically distinct cohort of AD patients. These could serve as AD biomarkers and microbiota-based therapeutic targets for treating AD.
Keywords: Alzheimer's disease; cytokines; dysbiosis; gut microbiome; serum adiponectin.
Copyright © 2024 Samat Kozhakhmetov et al.
Conflict of interest statement
The authors declare no conflicts of interest.
Figures
Similar articles
-
Interplay of Neuroinflammation and Gut Microbiota Dysbiosis in Alzheimer's Disease Using Diffusion Kurtosis Imaging Biomarker in 3 × Tg-AD Mouse Models.ACS Chem Neurosci. 2025 Apr 16;16(8):1511-1528. doi: 10.1021/acschemneuro.5c00063. Epub 2025 Apr 7. ACS Chem Neurosci. 2025. PMID: 40195658 Free PMC article.
-
Study of gut microbiota alterations in Alzheimer's dementia patients from Kazakhstan.Sci Rep. 2022 Sep 6;12(1):15115. doi: 10.1038/s41598-022-19393-0. Sci Rep. 2022. PMID: 36068280 Free PMC article.
-
Altered microbiomes distinguish Alzheimer's disease from amnestic mild cognitive impairment and health in a Chinese cohort.Brain Behav Immun. 2019 Aug;80:633-643. doi: 10.1016/j.bbi.2019.05.008. Epub 2019 May 4. Brain Behav Immun. 2019. PMID: 31063846
-
The Microbiota-Gut-Brain Axis in Alzheimer's Disease: A Review of Taxonomic Alterations and Potential Avenues for Interventions.Arch Clin Neuropsychol. 2022 Feb 22;37(3):595-607. doi: 10.1093/arclin/acac008. Arch Clin Neuropsychol. 2022. PMID: 35202456 Free PMC article. Review.
-
Gut microbiome dysbiosis in Alzheimer's disease and mild cognitive impairment: A systematic review and meta-analysis.PLoS One. 2023 May 24;18(5):e0285346. doi: 10.1371/journal.pone.0285346. eCollection 2023. PLoS One. 2023. PMID: 37224131 Free PMC article.
Cited by
-
Evaluating the Effects of Sugar Shift® Symbiotic on Microbiome Composition and LPS Regulation: A Double-Blind, Placebo-Controlled Study.Microorganisms. 2024 Dec 7;12(12):2525. doi: 10.3390/microorganisms12122525. Microorganisms. 2024. PMID: 39770729 Free PMC article.
-
AdipoRon's Impact on Alzheimer's Disease-A Systematic Review and Meta-Analysis.Int J Mol Sci. 2025 Jan 8;26(2):484. doi: 10.3390/ijms26020484. Int J Mol Sci. 2025. PMID: 39859201 Free PMC article.
-
Therapeutic Horizons: Gut Microbiome, Neuroinflammation, and Epigenetics in Neuropsychiatric Disorders.Cells. 2025 Jul 4;14(13):1027. doi: 10.3390/cells14131027. Cells. 2025. PMID: 40643545 Free PMC article. Review.
-
Interplay of Neuroinflammation and Gut Microbiota Dysbiosis in Alzheimer's Disease Using Diffusion Kurtosis Imaging Biomarker in 3 × Tg-AD Mouse Models.ACS Chem Neurosci. 2025 Apr 16;16(8):1511-1528. doi: 10.1021/acschemneuro.5c00063. Epub 2025 Apr 7. ACS Chem Neurosci. 2025. PMID: 40195658 Free PMC article.
-
Distinctive Effects of Fullerene C60 and Fullerenol C60(OH)24 Nanoparticles on Histological, Molecular and Behavioral Hallmarks of Alzheimer's Disease in APPswe/PS1E9 Mice.Antioxidants (Basel). 2025 Jul 8;14(7):834. doi: 10.3390/antiox14070834. Antioxidants (Basel). 2025. PMID: 40722938 Free PMC article.
References
-
- Prince M., Wimo A., Guerchet M., Ali G.-C., Wu Y.-T., Prina M. World Alzheimer Report 2015. The Global Impact of Dementia: An analysis of prevalence, incidence, cost and trends . Alzheimer's Disease International; 2015.
LinkOut - more resources
Full Text Sources
Miscellaneous
