. 2024 Sep 5;27(10):110884.
doi: 10.1016/j.isci.2024.110884. eCollection 2024 Oct 18.

Spike transmission failures in axons from cortical neurons in vivo

Affiliations

Spike transmission failures in axons from cortical neurons in vivo

Netanel Ofer et al. iScience. .

Abstract

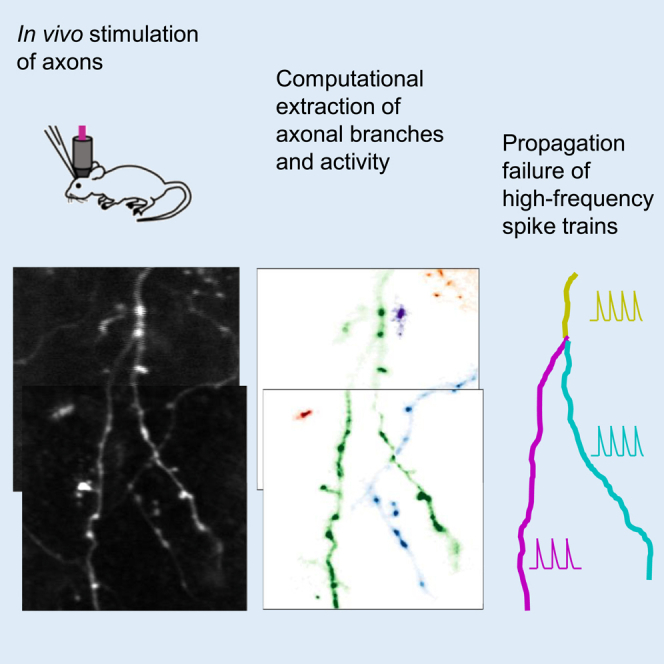
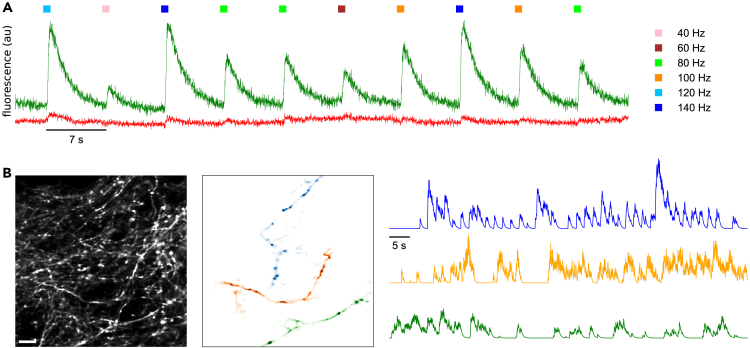
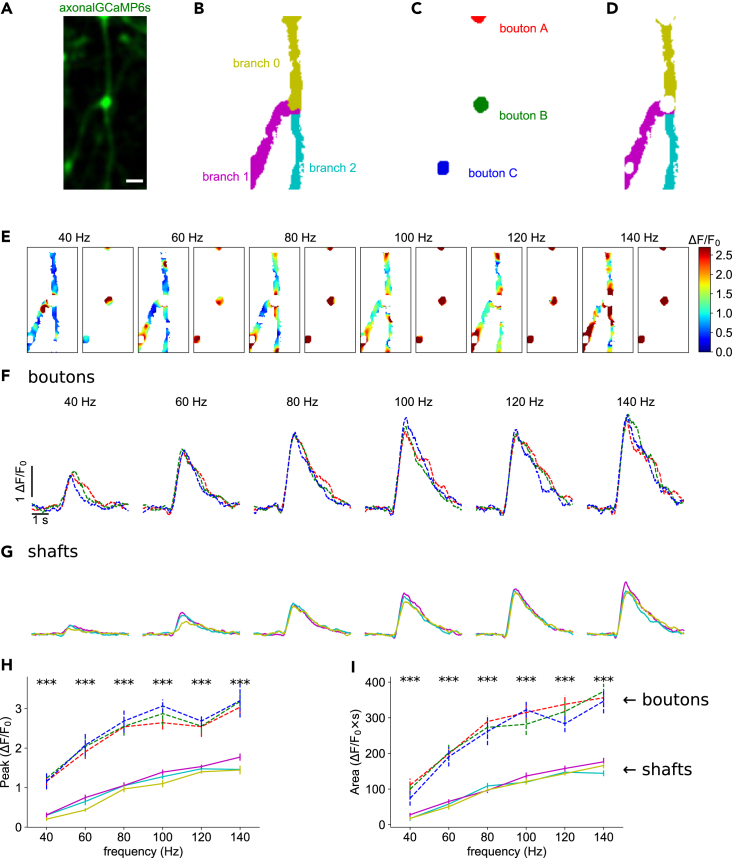
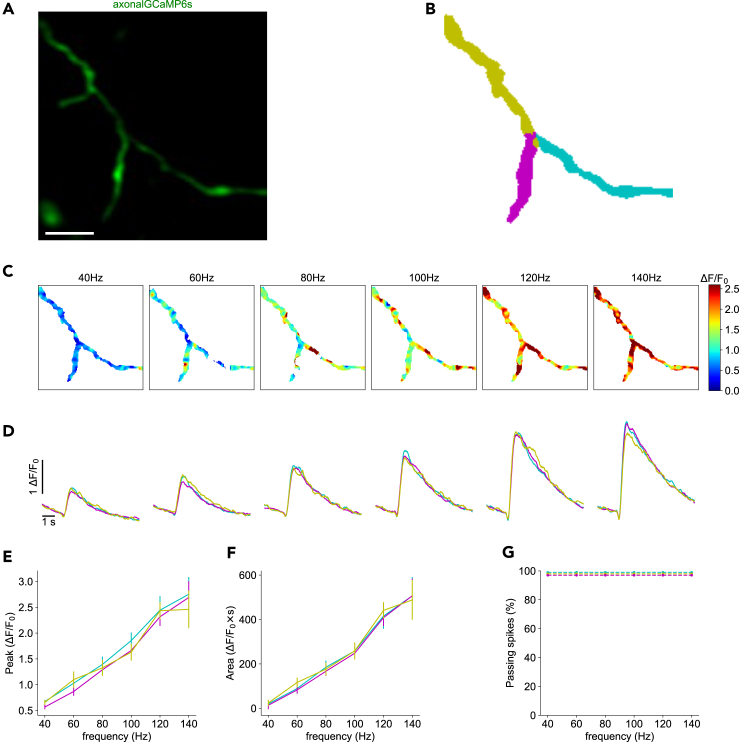
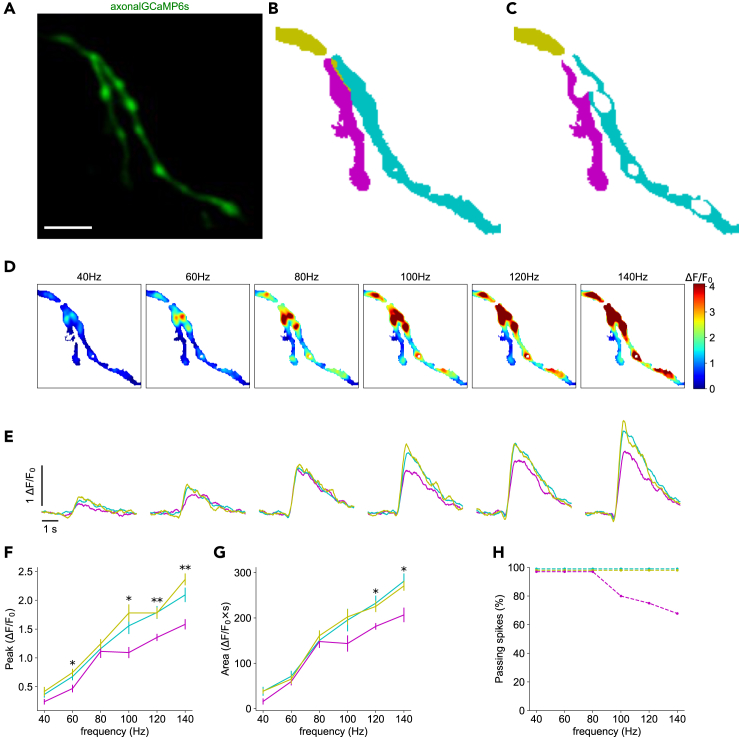
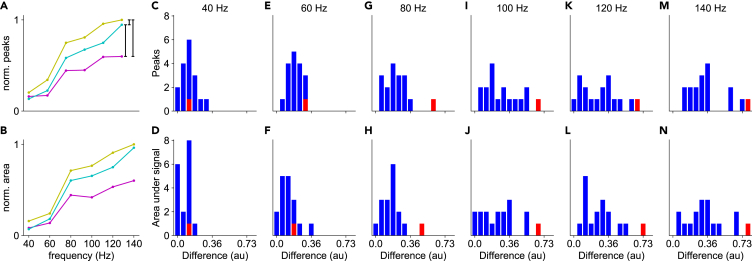
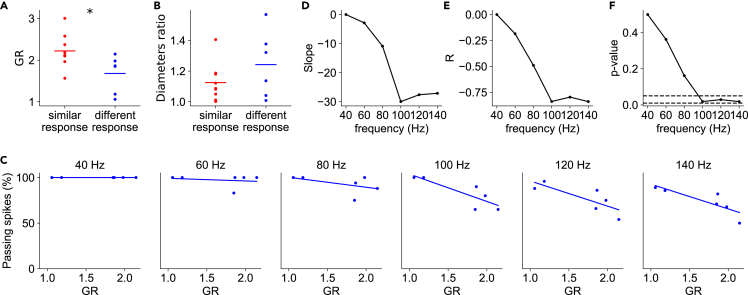
The propagation of action potentials along axons is traditionally considered reliable due to the high safety factor for axonal spike transmission. However, numerical simulations suggest that high-frequency spikes could fail to invade distal axonal branches. To explore this experimentally in vivo, we used an axonal-targeted calcium indicator to image action potentials at axonal terminal branches in the superficial layers of mouse somatosensory cortical neurons. We activated axons with an extracellular electrode, varying stimulation frequencies, and analyzed the images to computationally extract axonal morphologies and associated calcium responses. We found that axonal boutons have higher calcium accumulations than their axonal shafts, as was reported in vitro. However, contrary to previous in vitro results, our data reveal spike failures at high spike frequencies in a significant subset of branches as a function of branching geometry. These findings suggest that axonal morphologies could contribute to signal processing in the cortex.

Keywords: Cell biology; Neuroscience; Sensory neuroscience.


Conflict of interest statement

The authors declare no competing interests.

Figures

None
Graphical abstract
Figure 1
Figure 1
Experimental design and spatiotemporal analysis of axonal branches (A) Axonal calcium fluorescence responses to electrical stimulation of neuropil at different stimulation frequencies; axon-GCaMP6s, green trace and mRuby3, red trace. (B) Computational segmentation and signal extraction process for axonal branches, automatically localizing individual axons and separating neuropil background based on calcium activity. Scale bar: 10 μm.
Figure 2
Figure 2
Increased calcium responses of axonal boutons (A) Time-averaged image of axon-GCaMP6s activity during electrical stimulation. Scale bar: 2 μm. (B) Color map of the automatically identified parent (0) and the two secondary axonal branches (1 and 2). (C) Masks of three axonal boutons (A, B, and C). (D) Masks of axonal branches after removal of the boutons. (E) Representative color maps depicting normalized calcium peak amplitudes for axonal branches and boutons at different firing frequencies. (F) Normalized axon-GCaMP6s/mRuby3 signal for each bouton at different frequencies. Average of 7 trials per frequency. Traces are colored according to the boutons shown in C. (G) Normalized axon-GCaMP6s/mRuby3 signal for each branch at different frequencies. Average of 7 trials per frequency. Traces are colored according to branches shown in D. (H) Calcium peak amplitudes of signals from F and G as a function of firing frequency. (I) Area under the curve of signals from F and G as a function of firing frequency. Data are represented as mean ± SEM. Asterisks indicate statistical significance difference between signals; Kruskal-Wallis H-test.
Figure 3
Figure 3
Reliable propagation of action potentials at an axonal branching point (A) Time-averaged image of axon-GCaMP6s activity during electrical stimulation. Scale bar: 5 μm. (B) Color map showing the automatic segmentation of the parent branch and two secondary axonal branches. (C) Representative color maps of normalized calcium peak amplitudes at the indicated firing frequencies. (D) Normalized axon-GCaMP6s/mRuby3 signal for each branch at different firing frequencies. Average of 5 trials per frequency. Traces are colored according to the branches segmented in B. (E) Peak amplitudes of calcium signals from D as a function of firing frequency. (F) Area under the curve of signals from D as a function of firing frequency. Data are represented as mean ± SEM. (G) Percentage of signals that propagate at each branch, as a function of firing frequency. See also Figure S1.
Figure 4
Figure 4
Differential spike propagation in axonal branches (A) Time-averaged image of axon-GCaMP6s activity during electrical stimulation. Scale bar: 5 μm. (B) Color map showing the automatic segmentation of the parent branch and two secondary axonal branches. (C) Color map of the parent and two secondary branches after removing the axonal boutons. (D) Representative color maps of normalized calcium peak amplitudes at the indicated firing frequencies. (E) Normalized axon-GCaMP6s/mRuby3 signal for each branch at different firing frequencies. Average of 7 trials per frequency. Traces are colored according to the branches segmented in C. (F) Peak amplitudes of calcium signals from E as a function of firing frequency. (G) Area under the curve of signals from E as a function of firing frequency. Data are represented as mean ± SEM. Asterisks indicate statistical significance differences between signals; Kruskal-Wallis H-test. (H) Percentage of signals that propagate at each branch, as a function of frequency. See also Figure S2.
Figure 5
Figure 5
Comparison of calcium signal between axonal branches (A) Example of the normalized calcium peak fluorescence as a function of stimulus frequency at a branch point; parent branch (yellow), and two secondary branches (cyan and magenta). (B) Normalized integrated calcium fluorescence as a function of stimulus frequency. (C–N) Pooled differences between normalized signals (black vertical lines in A), for peak (upper row) and area under the curve (bottom row) across different spike train frequencies (n = 17). Red bars indicate the difference values from the example shown in A and B.
Figure 6
Figure 6
Spike filtering correlates with axonal branch point geometrical ratio (GR) (A) GR values of “similar” (n = 9) and “different” (n = 6) response branch points; t test two-sided. (B) Ratio between diameters of the two secondary branches, “similar” in red and “different” in blue; t test two-sided. The horizontal lines represent the means. (C) Percentage of propagating spikes as a function of GR for each spike train frequency. Lines represent linear fits to the data. (D) Slope of the regression line as a function of action potential frequency. (E) Pearson correlation coefficient (R) between the percentage of passing spikes and GR, as a function of action potential frequency. (F) p value of the linear regression fitting as a function of the action potential frequency. Dashed lines indicate p values of 0.05 and 0.01.

Update of

References

    1. Rockland K.S. What we can learn from the complex architecture of single axons. Brain Struct. Funct. 2020;225:1327–1347. doi: 10.1007/s00429-019-02023-3. - DOI - PubMed
    1. Raastad M., Shepherd G.M.G. Single-axon action potentials in the rat hippocampal cortex. J. Physiol. 2003;548:745–752. doi: 10.1113/jphysiol.2002.032706. - DOI - PMC - PubMed
    1. Cox C.L., Denk W., Tank D.W., Svoboda K. Action potentials reliably invade axonal arbors of rat neocortical neurons. Proc. Natl. Acad. Sci. USA. 2000;97:9724–9728. doi: 10.1073/pnas.170278697. - DOI - PMC - PubMed
    1. Koester H.J., Sakmann B. Calcium dynamics associated with action potentials in single nerve terminals of pyramidal cells in layer 2/3 of the young rat neocortex. J. Physiol. 2000;529 Pt 3:625–646. doi: 10.1111/j.1469-7793.2000.00625.x. - DOI - PMC - PubMed
    1. Popovic M.A., Foust A.J., Mccormick D.A., Zecevic D. The spatio-temporal characteristics of action potential initiation in layer 5 pyramidal neurons: A voltage imaging study. J. Physiol. 2011;589:4167–4187. doi: 10.1113/JPHYSIOL.2011.209015. - DOI - PMC - PubMed

LinkOut - more resources