. 2024 Sep 2;32(4):200870.
doi: 10.1016/j.omton.2024.200870. eCollection 2024 Dec 19.

Bulk and single-cell transcriptomics identify gene signatures of stem cell-derived NK cell donors with superior cytolytic activity

Affiliations

Bulk and single-cell transcriptomics identify gene signatures of stem cell-derived NK cell donors with superior cytolytic activity

Amanda A van Vliet et al. Mol Ther Oncol. .

Abstract

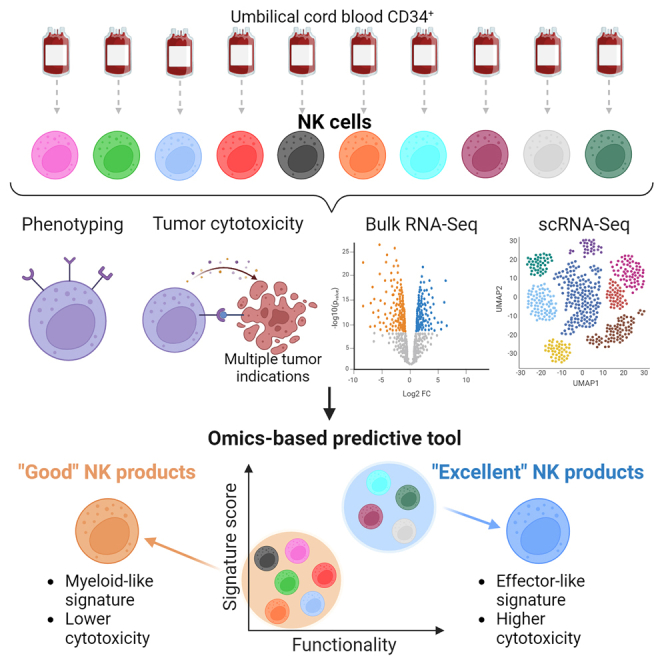
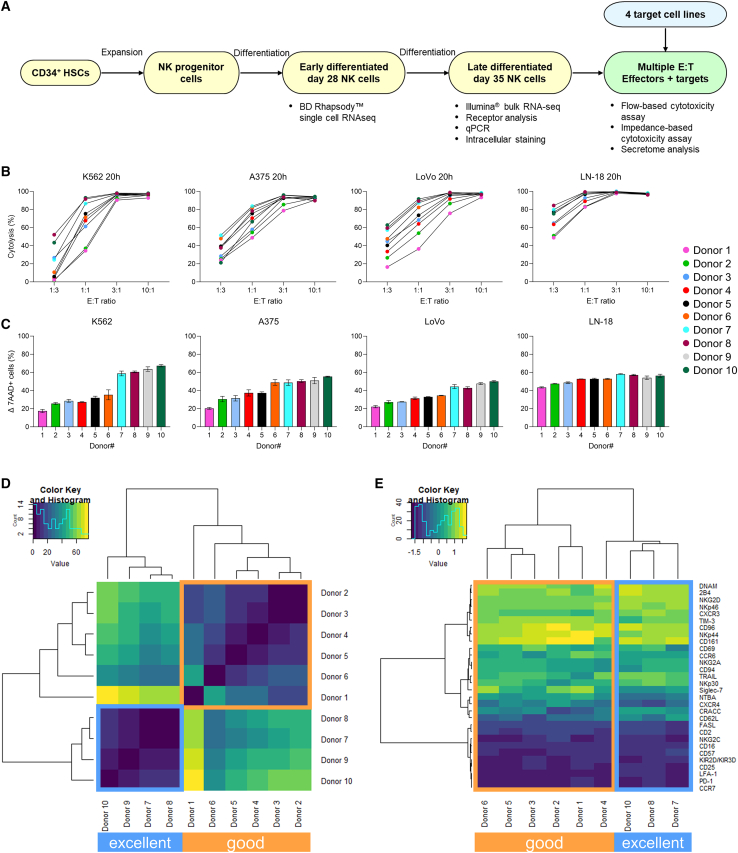
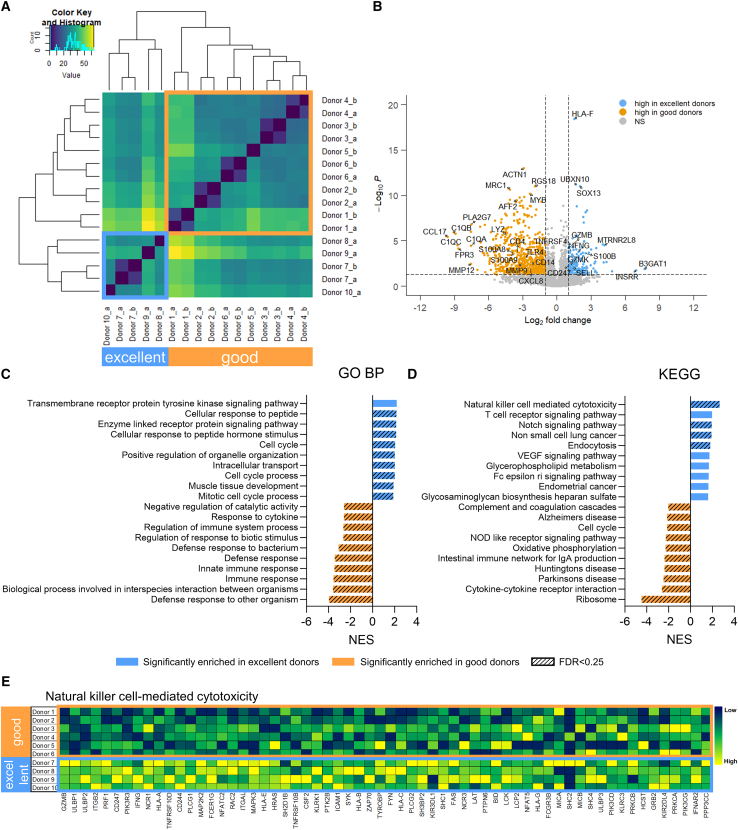
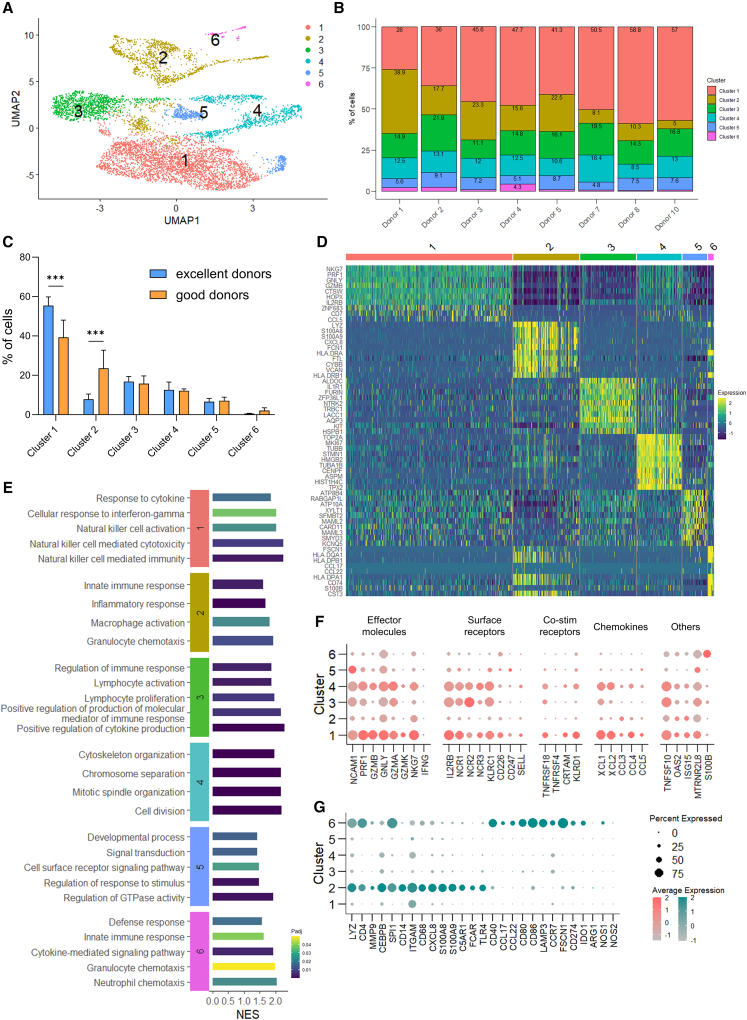
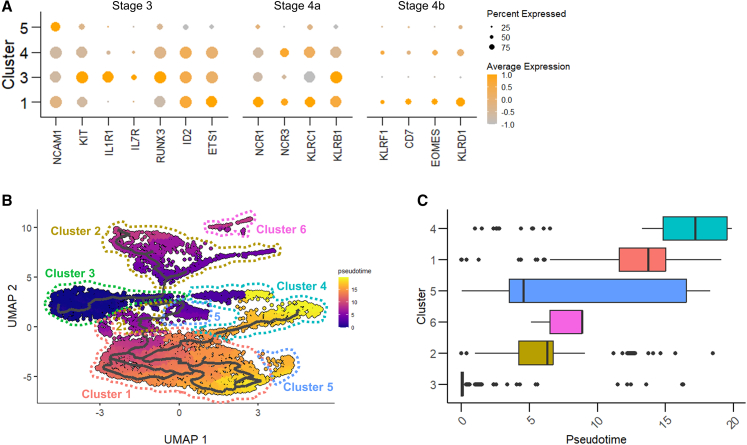
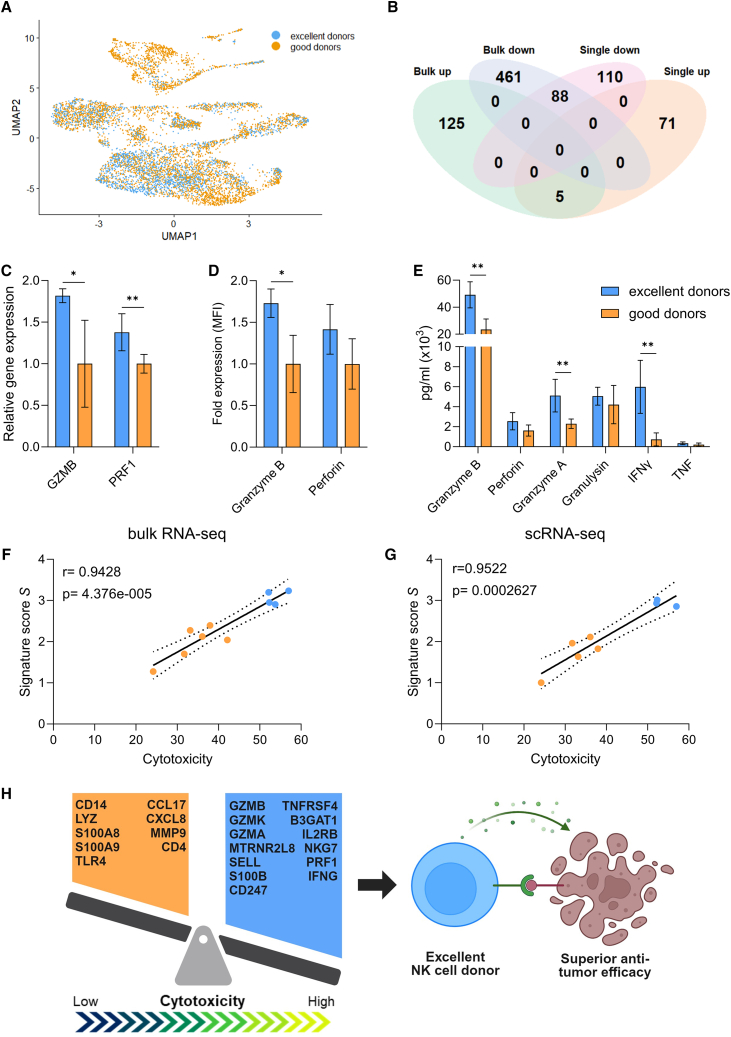
Allogeneic natural killer (NK) cell therapies are a valuable treatment option for cancer, given their remarkable safety and favorable efficacy profile. Although the use of allogeneic donors allows for off-the-shelf and timely patient treatment, intrinsic interindividual differences put clinical efficacy at risk. The identification of donors with superior anti-tumor activity is essential to ensure the success of adoptive NK cell therapies. Here, we investigated the heterogeneity of 10 umbilical cord blood stem cell-derived NK cell batches. First, we evaluated the donors' cytotoxic potential against tumor cell lines from solid and hematological cancer indications, to distinguish a group of superior, "excellent" killers (4/10), compared with "good" killers (6/10). Next, bulk and single-cell RNA sequencing, performed at different stages of NK differentiation, revealed distinct transcriptomic features of the two groups. Excellent donors showed an enrichment in cytotoxicity pathways and a depletion of myeloid traits, linked to the presence of a larger population of effector-like NK cells early on during differentiation. Consequently, we defined a multi-factorial gene expression signature able to predict the donors' cytotoxic potential. Our study contributes to the identification of key traits of superior NK cell batches, supporting the development of efficacious NK therapeutics and the achievement of durable anti-tumor responses.

Keywords: MT: Regular Issue; NK cells; NK cytotoxicity; NK functionality; allogeneic NK cells; cell therapy; donor selection; hematopoietic stem cells; omics; scRNA-seq; umbilical cord blood.


Conflict of interest statement

A.A.v.V., D.S., A.D.D., A.-M.G., J.S., and M.R. are employees of Glycostem Therapeutics. All authors declare no competing interests. Data and results generated, shared, and reported in conjunction with this publication have been filed in a patent application by Glycostem Therapeutics.

Figures

None
Graphical abstract
Figure 1
Figure 1
Cytotoxicity analysis of 10 stem cell-derived NK batches against multiple tumor cell lines distinguishes donors with superior anti-tumor efficacy (A) Overview of the experimental setup. (B) NK cytotoxicity, expressed as percentage of tumor cell cytolysis, analyzed after 20 h of co-culture with different cell lines at multiple E:T ratios (from 1:3 to 10:1). Cytolysis was assessed via flow cytometry for K562, and on the impedance-based platform xCELLigence for A375, LoVo, and LN-18. Each dot represents a donor and is the average of a technical triplicate. (C) Flow cytometry-based overnight cytotoxicity assay at a 1:1 E:T ratio; cytolysis was assessed as percentage of 7AAD+ cells. Data are shown as mean ± SD of technical triplicates. Donors are ordered from low to high cytotoxic capacity based on the mean cytotoxicity value across the four cell lines. (D–E) Heatmaps showing the hierarchical clustering of donors based on the mean cytotoxicity value across the four cell lines (D) or the expression of 30 surface antigens (E). Excellent and good donors are labeled with different colors. E:T, effector-to-target; 7AAD, 7-aminoactinomycin D; SD, standard deviation.
Figure 2
Figure 2
Bulk RNA-seq identifies the enrichment of cytotoxic pathways and the absence of myeloid traits in excellent donors (A) Heatmap showing the hierarchical clustering based on the 1,000 most variable genes, analyzed from 10 donors on day 35. For each donor, single or two biological replicates were used (a and b). (B) Volcano plot of differentially expressed genes in excellent vs. good donors. (C and D) Ten most enriched pathways in excellent and good donors, using in (C) the differentially expressed genes and the GO Biological Process database and in (D) the normalized gene counts and the KEGG database. Significant enrichment threshold was considered as NES p < 0.05 (colored bars) and FDR < 0.25 (bars with diagonal pattern). (E) Heatmap showing the genes from the NK cell-mediated cytotoxicity KEGG pathway that contribute to pathway enrichment in excellent donors. Excellent and good donors are labeled with different colors. DE, differentially expressed; GO BP, Gene Ontology Biological Process; KEGG, Kyoto Encyclopedia of Genes and Genomes; NES, normalized enrichment score; FDR, false discovery rate.
Figure 3
Figure 3
scRNA-seq reveals early enrichment of NK effector-like cells and lack of myeloid lineage cells during differentiation of excellent donors (A) UMAP of cluster distribution of cells, analyzed with Leiden algorithm on day 28 from 8 donors. (B) Relative distribution of clusters per donor, expressed as percentage of total. (C) Distribution of clusters across excellent and good donors (n = 3 and 5, respectively), expressed as percentage of total. Clusters are ranked by overall size. Data are shown as mean ± SD. Statistical analysis was performed using two-way ANOVA with Šídák correction for multiple comparisons. Significance is shown as ∗∗∗p <0.001. (D) Heatmap showing the top 10 markers of each cluster identified by differential expression analysis. (E) Selected GO Biological Process pathways enriched in each cluster. (F and G) Dot plots of (F) selected NK cell-related genes and (G) selected myeloid-related genes. The size of the dot is proportional to the percentage of cells expressing the gene, while the color scale indicates the average scaled gene expression. Excellent and good donors are labeled with different colors. UMAP, Uniform Manifold Approximation and Projection; GO, Gene Ontology; NES, normalized enrichment score; Padj, adjusted p value.
Figure 4
Figure 4
NK sub-populations show differences consistent with developmental stages, while myeloid cells derive from a separate trajectory (A) Dot plot of selected NK development genes. The size of the dot is proportional to the percentage of cells expressing the gene, while the color scale indicates the average scaled gene expression. (B) UMAP of pseudotime inference, computed selecting cluster 3 as the root. Each cluster is profiled in a different color. (C) Boxplots of cluster ordering and cell distribution based on pseudotime. UMAP, Uniform Manifold Approximation and Projection.
Figure 5
Figure 5
Identification of a multi-factorial gene expression signature predicting donor cytotoxic potential (A) UMAP of excellent and good donor distribution. No major separation is distinguishable. (B) Overlap of differentially expressed genes between excellent and good donors identified with bulk and scRNA-seq. (C) Relative mRNA expression of GZMB and PRF1 of day 35 cells, analyzed by qPCR on the 10 donors. The good group is used as control. (D) Intracellular protein levels of granzyme B and perforin of day 35 cells, analyzed via flow cytometry on 9 donors. The good group is used as control. (E) Detection of effector molecules in the supernatant after 5 h co-culture with K562 target cells, analyzed via flow cytometry on 9 donors. In (C)–(E), data are shown as mean ± SD and statistical analysis was performed using unpaired t test, with Holm-Šídák correction for multiple comparisons. Significance is shown as ∗p < 0.05, ∗∗p < 0.01. (F and G) Linear correlation analysis between the mean cytotoxicity value, calculated across 4 target cell lines, and the signature score S, from (F) bulk RNA-seq (10 donors) and (G) scRNA-seq (8 donors). (H) Summary of the main findings from this study. Excellent and good NK cell-related genes, contributing to the predictive signature, are listed in the blue and orange regions, respectively. MFI, mean fluorescence intensity.

Similar articles

Cited by

References

    1. Vivier E., Raulet D.H., Moretta A., Caligiuri M.A., Zitvogel L., Lanier L.L., Yokoyama W.M., Ugolini S. Innate or adaptive immunity? The example of natural killer cells. Science. 2011;331:44–49. doi: 10.1126/science.1198687. - DOI - PMC - PubMed
    1. Binstadt B.A., Billadeau D.D., Jevremović D., Williams B.L., Fang N., Yi T., Koretzky G.A., Abraham R.T., Leibson P.J. SLP-76 is a direct substrate of SHP-1 recruited to killer cell inhibitory receptors. J. Biol. Chem. 1998;273:27518–27523. doi: 10.1074/jbc.273.42.27518. - DOI - PubMed
    1. Stebbins C.C., Watzl C., Billadeau D.D., Leibson P.J., Burshtyn D.N., Long E.O. Vav1 dephosphorylation by the tyrosine phosphatase SHP-1 as a mechanism for inhibition of cellular cytotoxicity. Mol. Cell Biol. 2003;23:6291–6299. doi: 10.1128/mcb.23.17.6291-6299.2003. - DOI - PMC - PubMed
    1. Pegram H.J., Andrews D.M., Smyth M.J., Darcy P.K., Kershaw M.H. Activating and inhibitory receptors of natural killer cells. Immunol. Cell Biol. 2011;89:216–224. doi: 10.1038/icb.2010.78. - DOI - PubMed
    1. Pende D., Parolini S., Pessino A., Sivori S., Augugliaro R., Morelli L., Marcenaro E., Accame L., Malaspina A., Biassoni R., et al. Identification and molecular characterization of NKp30, a novel triggering receptor involved in natural cytotoxicity mediated by human natural killer cells. J. Exp. Med. 1999;190:1505–1516. doi: 10.1084/jem.190.10.1505. - DOI - PMC - PubMed