. 2024 Sep 13;9(38):39804-39816.
doi: 10.1021/acsomega.4c05039. eCollection 2024 Sep 24.

Unraveling the Molecular Landscape of SCN1A Gene Knockout in Cerebral Organoids: A Multiomics Approach Utilizing Proteomics, Lipidomics, and Transcriptomics

Affiliations

Unraveling the Molecular Landscape of SCN1A Gene Knockout in Cerebral Organoids: A Multiomics Approach Utilizing Proteomics, Lipidomics, and Transcriptomics

Byumseok Koh et al. ACS Omega. .

Abstract

This study investigates the impact of sodium channel protein type 1 subunit alpha (SCN1A) gene knockout (SCN1A KO) on brain development and function using cerebral organoids coupled with a multiomics approach. From comprehensive omics analyses, we found that SCN1A KO organoids exhibit decreased growth, dysregulated neurotransmitter levels, and altered lipidomic, proteomic, and transcriptomic profiles compared to controls under matrix-free differentiation conditions. Neurochemical analysis reveals reduced levels of key neurotransmitters, and lipidomic analysis highlights changes in ether phospholipids and sphingomyelin. Furthermore, quantitative profiling of the SCN1A KO organoid proteome shows perturbations in cholesterol metabolism and sodium ion transportation, potentially affecting synaptic transmission. These findings suggest dysregulation of cholesterol metabolism and sodium ion transport, with implications for synaptic transmission. Overall, these insights shed light on the molecular mechanisms underlying SCN1A-associated disorders, such as Dravet syndrome, and offer potential avenues for therapeutic intervention.


Conflict of interest statement

The authors declare no competing financial interest.

Figures

Figure 1
Figure 1
Morphological differences between control (Con) and SCN1A KO (KO) cerebral organoids. (A) Diameter (from 24 individual organoids for each group) (B) 120 days cultured control and SCN1A KO cerebral organoids (from 5 individual organoids for each group) SCN1A protein expression with Western blot and (C) Stem cell and neuronal marker expression of Con vs KO cerebral organoids with immunofluorescence imaging. Error bars represent the standard error of the mean of three independent experiments.
Figure 2
Figure 2
Quantitative analysis of neurotransmitter production by control (Con) and SCN1A KO (KO) cerebral organoids. (A) Heatmap of 18 neurotransmitter production levels. (B) ACHO (C) 5-HT (D) DA (E) GABA and (F) GLU production levels from Con and KO cerebral organoids. Error bars represent the standard error of the mean of three independent experiments.
Figure 3
Figure 3
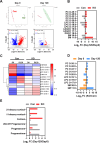
Lipidomics profiling and differential analysis in control (Con) and SCN1A KO (KO) cerebral organoids at Day 0 and after 120 days. (A) Showcases the multivariate and univariate analysis at two time points: PLS-DA plots of day 0 (top-left) and day 120 (top-right) post-SCN1A gene knockout. (B) Log2 fold change (FC) of identified lipid species, comprising day 120 and day 0 for both Con and KO cerebral organoids. (C) Heatmap of the relative abundance of identified lipid species in control and SCN1A gene knockout cerebral organoids at the start (Day 0) and after 120 days (D120) of cultivation. (D) Log2 fold changes of the sample lipid species between the KO and Con cerebral organoids as D0 and D120. (E) Log2 fold change of neurosteroids detected by targeted analysis from Con and KO cerebral organoids at two time points, 0 day and 120 days.
Figure 4
Figure 4
Total RNA sequencing analysis of control (Con) vs SCN1A KO (KO) cerebral organoids. (A) Heatmap, (B) volcano plot, and (C) smear plot of differentially expressed genes (DEGs). Panels (D), (E), and (F) depict gene set enrichment analysis for biological process, molecular function, and cellular component, respectively.
Figure 5
Figure 5
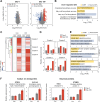
Quantitative proteomic analysis of control (Con) and SCN1A KO (KO) cerebral organoids. (A) Volcano plots displaying log2 fold change (KO/Con) against the –log10 (adjusted p-value) at day 0 (left) and day 120 (right). Red dots represent upregulated proteins, and blue dots represent downregulated proteins. (B) GO annotation and reactome pathway enrichment of downregulated proteins in KO compared with Con cerebral organoids at day 0. (C) Heatmap and hierarchical clustering analysis of differentially expressed proteins between KO and Con cerebral organoids at day 120 (red, high expression; blue, low expression). (D) Average expression levels of proteins in each cluster (Cluster 1, 2, 3, and 4). Gray and red colors indicate day 0 and day 120, respectively. Protein expression levels were normalized to Con cerebral organoids (day 0). (E) GO annotation and reactome pathway enrichment of proteins in Cluster 1, 3, and 4. (F) Relative expression levels of sodium ion transporters (SCN2A and SLC1A3) and neuronal proteins (SYN1 and STXBP1) in Clusters 3 and 4. Error bars represent the standard error of the mean of three independent experiments.
Figure 6
Figure 6
Regulation of synaptic proteins and neurotransmitters in SCN1A KO cerebral organoids. Red and blue colors represent up- and downregulation in SCN1A KO organoids compared to control at day 120, respectively. Dots indicate neurotransmitters, and squares indicate proteins.

References

    1. Miller I. O.; Sotero de Menezes M. A.. SCN1A Seizure Disorders. In GeneReviews; Adam M. P.; Feldman J.; Mirzaa G. M.; Pagon R. A.; Wallace S. E.; Bean L. J.; Gripp K. W.; Amemiya A., Eds.; University of Washington: Seattle: Seattle (WA), 1993. - PubMed
    1. Bender A. C.; Morse R. P.; Scott R. C.; Holmes G. L.; Lenck-Santini P.-P. SCN1A Mutations in Dravet Syndrome: Impact of Interneuron Dysfunction on Neural Networks and Cognitive Outcome. Epilepsy Behav. 2012, 23 (3), 177–186. 10.1016/j.yebeh.2011.11.022. - DOI - PMC - PubMed
    1. Valassina N.; Brusco S.; Salamone A.; Serra L.; Luoni M.; Giannelli S.; Bido S.; Massimino L.; Ungaro F.; Mazzara P. G.; D’Adamo P.; Lignani G.; Broccoli V.; Colasante G. Scn1a Gene Reactivation after Symptom Onset Rescues Pathological Phenotypes in a Mouse Model of Dravet Syndrome. Nat. Commun. 2022, 13 (1), 16110.1038/s41467-021-27837-w. - DOI - PMC - PubMed
    1. Tahara M.; Higurashi N.; Hata J.; Nishikawa M.; Ito K.; Hirose S.; Kaneko T.; Mshimo T.; Sakuma T.; Yamamoto T.; Okano H. J. Developmental changes in brain activity of heterozygous SCN1A knockout rats. Front. Neurol. 2023, 14 (14), 112508910.3389/fneur.2023.1125089. - DOI - PMC - PubMed
    1. Das A.; Zhu B.; Xie Y.; Zeng L.; Pham A. T.; Neumann J. C.; Safrina O.; Benavides D. R.; MacGregor G. R.; Schutte S. S.; Hunt R. F.; O’Dowd D. K. Interneuron Dysfunction in a New Mouse Model of SCN1A GEFS+. eNeuro 2021, 8 (2), ENEURO.0394–20.202110.1523/ENEURO.0394-20.2021. - DOI - PMC - PubMed

LinkOut - more resources