Observational Study
. 2024 Sep 13:15:1438044.
doi: 10.3389/fimmu.2024.1438044. eCollection 2024.

Radiation immunodynamics in patients with glioblastoma receiving chemoradiation

Affiliations
Observational Study

Radiation immunodynamics in patients with glioblastoma receiving chemoradiation

Lindsey Sloan et al. Front Immunol. .

Abstract

Introduction: This is a prospective, rigorous inquiry into the systemic immune effects of standard adjuvant chemoradiotherapy, for WHO grade 4, glioblastoma. The purpose is to identify peripheral immunologic effects never yet reported in key immune populations, including myeloid-derived suppressor cells, which are critical to the immune suppressive environment of glioblastoma. We hypothesize that harmful immune-supportive white blood cells, myeloid derived suppressor cells, expand in response to conventionally fractionated radiotherapy with concurrent temozolomide, essentially promoting systemic immunity similar what is seen in chronic diseases like diabetes and heart disease.

Methods: 16 patients were enrolled in a single-institution, observational, immune surveillance study where peripheral blood was collected and interrogated by flow cytometry and RNAseq. Tumor tissue from baseline assessment was analyzed with spatial proteomics to link peripheral blood findings to baseline tissue characteristics.

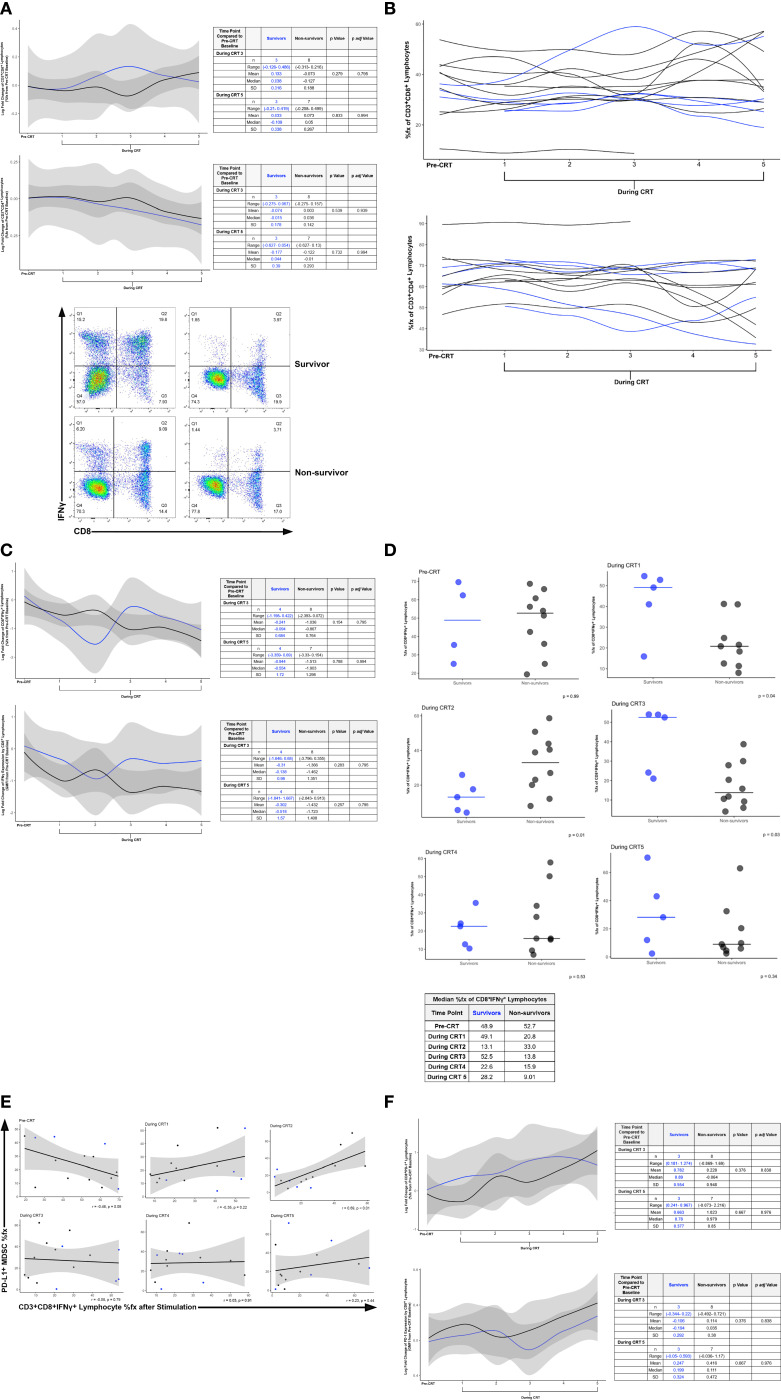
Results: We identified an increase in myeloid-derived suppressor cells during the final week of a six-week treatment of chemoradiotherapy in peripheral blood of patients that were not alive at two years after diagnosis compared to those who were living. This was also associated with a decrease in CD8+ T lymphocytes that produced IFNγ, the potent anti-tumor cytokine.

Discussion: These data suggest that, as in chronic inflammatory disease, systemic immunity is impaired following delivery of adjuvant chemoradiotherapy. Finally, baseline investigation of myeloid cells within tumor tissue did not differ between survival groups, indicating immune surveillance of peripheral blood during adjuvant therapy may be a critical missing link to educate our understanding of the immune effects of standard of care therapy for glioblastoma.

Keywords: brain tumor; chemoradiotherapy; glioblastoma; immune system; radiotherapy.


Conflict of interest statement

LS: Research Support- GT Medical Technologies. MH: Data Safety Monitoring Board- Parexel and Advarra; Advisory Board- Servier; Speaking Engagement- Novartis. KR: Research Grant- Elekta AB, Accuray; Honoraria- AstraZeneca, Accuray, NCCN; Travel Expenses- Elekta AB, Accuray, Brainlab, Icotec. ASTRO; Unpaid volunteer for the University of Maryland branch of Camp Kesem- Camp Kesem. ML: Research Support- Arbor, BMS, Accuray, Biohaven, Urogen; Consultant-VBI, InCephalo Therapeutics, Merck, Pyramid Bio, Insightec, Biohaven, Sanianoia, Hemispherian, Novocure, Noxxon, InCando, Century Therapeutics, CraniUs, MediFlix, XSense, Stryker; Shareholder- Egret Therapeutics; Patent- Focused radiation + checkpoint inhibitors, local chemotherapy + checkpoint inhibitors, checkpoints for neuro-inflammation; DSMB – Cellularity. LaK: Research support- BMS, Incyte, Novartis, and Novocure; Study steering committee for Novocure. The remaining authors declare that the research was conducted in the absence of any commercial or financial relationships that could be construed as a potential conflict of interest.

Figures

Figure 1
Figure 1
(A) Log Fold Change of Percent Frequency of MDSC before and during CRT. The line graph shows modeled log fold change data from survivors (blue line) and non-survivors (black line) over the course of CRT (top). Example Flow Cytometry Scatter Plots of MDSC Percent Frequency (bottom). MDSC were defined using the gating strategy described within the Supplementary Materials . Dot plots are shown from survivors (top row) and non-survivors (bottom row) at pre-CRT (left) and CRT TP 5 (right). CD33 and HLA-DR expression were used to identify MDSC within Q3. Scatterplot arrows indicate increasing expression of CD33 or HLA-DR. (B) Percent Frequency (%fx) of PD-L1+ MDSC in Survivors (blue) and Non-survivors (black) during CRT. (C) Log Fold Change of the Percent Frequency of PD-L1+ MDSC, PD-L1+ CD33+HLA-DR+ Cells, and PD-L1+ CD14+ Cells before and during CRT in Survivors and Non-survivors. The line graphs show modeled log fold change data from survivors (blue line) and non-survivors (black line) over the course of CRT (top). Correlation was performed between normalized PD-L1 RNA expression (y-axis) and PD-L1%fx by flow cytometry in CD14+ cells (x-axis) (bottom). (D) Log Fold Change of the Geometric Mean Fluorescence Intensity of PD-L1 Expression by MDSC, CD33+ HLA-DR+ Cells, and CD14+ before and during CRT in Survivors and Non-survivors. The line graphs show modeled log fold change data from survivors (blue line) and non-survivors (black line) over the course of CRT (top). Correlation between PD-L1 RNA expression and PD-L1 %fx by flow cytometry in CD14+ cells (bottom). (E) Log Fold Change of the Percent Frequency of TGF-β1+ MDSC, TGF-β1+ CD33+ HLA-DR+ Cells, and TGF-β1+ CD14+ Cells before and during CRT in Survivors and Non-survivors. The line graphs show modeled log fold change data from survivors (blue line) and non-survivors (black line) over the course of CRT (top). Correlation between TGF-β1 RNA expression and TGF-β1%fx by flow cytometry in CD14+ cells (bottom). (F) Log Fold Change of the Percent Frequency of CD163+ MDSC, CD163+CD33+HLA-DR+ Cells, and CD163+ CD14+ Cells before and during CRT in Survivors and Non-survivors. The line graphs show modeled log fold change data from survivors (blue line) and non-survivors (black line) over the course of CRT. The line graphs show modeled log fold change data from survivors (blue line) and non-survivors (black line) over the course of CRT (top). Correlation between CD163 RNA Expression and CD163% fx by flow cytometry in CD14+ cells (bottom).
Figure 2
Figure 2
(A) Log Fold Change of CD8 (top line graph) and CD4 (bottom line graph) Percent Frequency (%fx) by CD3+ Lymphocytes before and during CRT in Survivors and Non-survivors. The line graphs show modeled log fold change data from survivors (blue line) and non-survivors (black line) over the course of CRT (top). Example Flow Cytometry Scatter Plots of CD8+IFNγ+ Percent Frequency (bottom). IFNγ expressing CD8+ lymphocytes were defined using the gating strategy described within the Supplementary Materials . Dot plots are shown from survivors (top row) and non-survivors (bottom row) at pre-CRT (left) and CRT TP 5. Q2 identifies CD8+IFNγ+ lymphocytes. (B) Percent Frequency of Lymphocyte Populations over the Course of CRT: CD3+CD8+ Lymphocyte %fx (top), CD3+CD4+ Lymphocyte %fx (bottom). (C) Log Fold Change of IFNγ Expression by Stimulated Lymphocytes before and during CRT in Survivors and Non-survivors. The line graphs show modeled log fold change data from survivors (blue line) and non-survivors (black line) over the course of CRT. The log fold change of the %fx (top) and expression per CD3+CD8+ lymphocyte (bottom) of IFNγ are displayed. (D) Percent Frequency of CD8+IFNγ+ Lymphocytes in Survivors and Non-survivors during CRT. (E) Correlation between PDL1+ MDSC %fx by Flow Cytometry and CD3+CD8+IFNγ+ Lymphocyte %fx after Stimulation. (F) Log Fold Change of PD-1 Expression by Stimulated CD8+ Lymphocytes before and during CRT in Survivors and Non-survivors. Freshly isolated peripheral blood mononuclear cells were stained and %fx (top) and GMFI (bottom) of PD-1 expression by CD8+ lymphocytes was identified. The line graphs show modeled log fold change data from survivors (blue line) and non-survivors (black line) over the course of CRT.
Figure 3
Figure 3
(A) RNA Expression by CD14+ Monocytes by Bulk RNAseq at CRT 5. (B) Normalized RNA Expression during CRT of CCL20, AREG, CXCR4, Ets2, HBEGF, IER3, IL1RL2, THBS1, and TNFAIP3 by Bulk RNAseq in CD14+ Cells. The line graph show modeled data from survivors (blue line) and non-survivors (black line) over the course of CRT.
Figure 4
Figure 4
(A) Digital Spatial Profiling (DSP) Example of Glioblastoma Tumor Tissue. Full slide example of one of ten glioblastoma cases analyzed by DSP. (B) Example regions of interest (ROIs) Spatial Profiling. Magnified views (600 x 600 μm) of example regions of interest (ROIs).Visualization markers were used to identify ROIs by immunofluorescence. (C) Normalized Expression of CD163 in CD163+ ROIs in Glioblastoma Tumor Tissue. (D) Enriched Proteins in Glioblastoma Tissue by DSP at the Time of Resection.

Similar articles

Cited by

References

    1. Stupp R, Mason WP, van den Bent MJ, Weller M, Fisher B, Taphoorn MJ, et al. . Radiotherapy plus concomitant and adjuvant temozolomide for glioblastoma. N Engl J Med. (2005) 352:987–96. doi: 10.1056/NEJMoa043330 - DOI - PubMed
    1. Stupp R, Hegi ME, Mason WP, van den Bent MJ, Taphoorn MJ, Janzer RC, et al. . Effects of radiotherapy with concomitant and adjuvant temozolomide versus radiotherapy alone on survival in glioblastoma in a randomised phase III study: 5-year analysis of the EORTC-NCIC trial. Lancet Oncol. (2009) 10:459–66. doi: 10.1016/S1470-2045(09)70025-7 - DOI - PubMed
    1. Kleinberg L, Grossman SA, Piantadosi S, Zeltzman M, Wharam M. The effects of sequential versus concurrent chemotherapy and radiotherapy on survival and toxicity in patients with newly diagnosed high-grade astrocytoma. Int J Radiat Oncol Biol Phys. (1999) 44:535–43. doi: 10.1016/S0360-3016(99)00060-7 - DOI - PubMed
    1. Yovino S, Kleinberg L, Grossman SA, Narayanan M, Ford E. The etiology of treatment-related lymphopenia in patients with Malignant gliomas: modeling radiation dose to circulating lymphocytes explains clinical observations and suggests methods of modifying the impact of radiation on immune cells. Cancer Invest. (2013) 31:140–4. doi: 10.3109/07357907.2012.762780 - DOI - PMC - PubMed
    1. Kleinberg L, Sloan L, Grossman S, Lim M. Radiotherapy, lymphopenia, and host immune capacity in glioblastoma: A potentially actionable toxicity associated with reduced efficacy of radiotherapy. Neurosurgery. (2019) 85:441–53. doi: 10.1093/neuros/nyz198 - DOI - PubMed

Publication types