. 2024 Sep 13:15:1462853.
doi: 10.3389/fimmu.2024.1462853. eCollection 2024.

Neu1 deficiency and fibrotic lymph node microenvironment lead to imbalance in M1/M2 macrophage polarization

Affiliations

Neu1 deficiency and fibrotic lymph node microenvironment lead to imbalance in M1/M2 macrophage polarization

Emilia Escalona et al. Front Immunol. .

Abstract

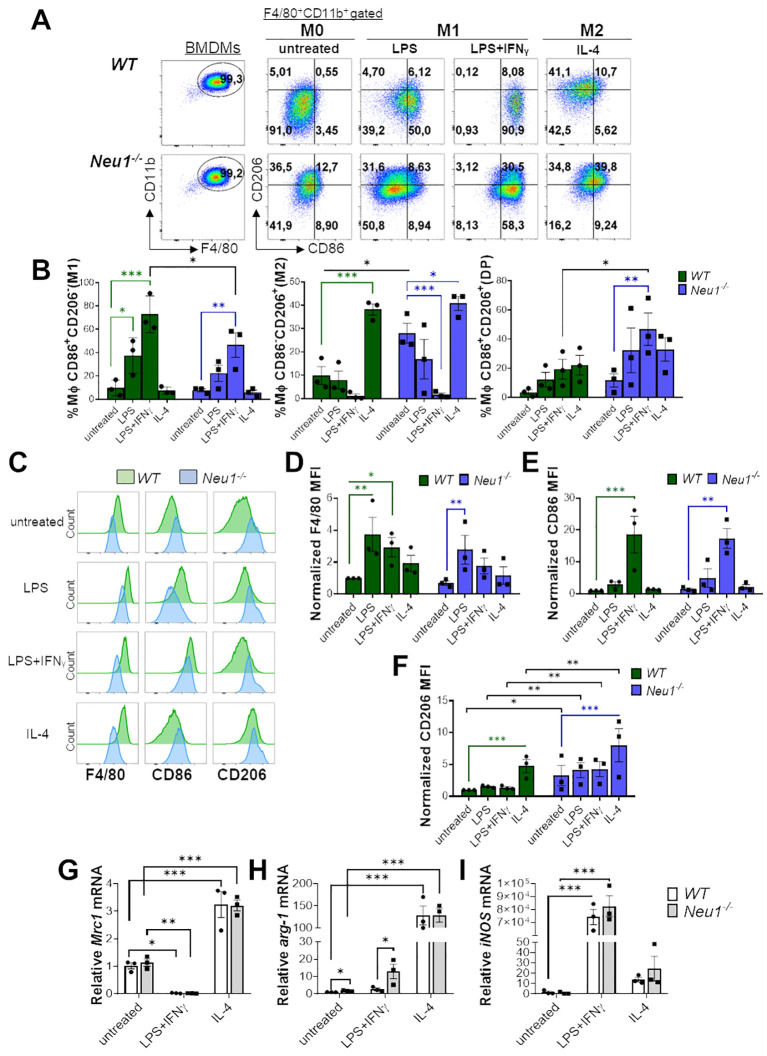
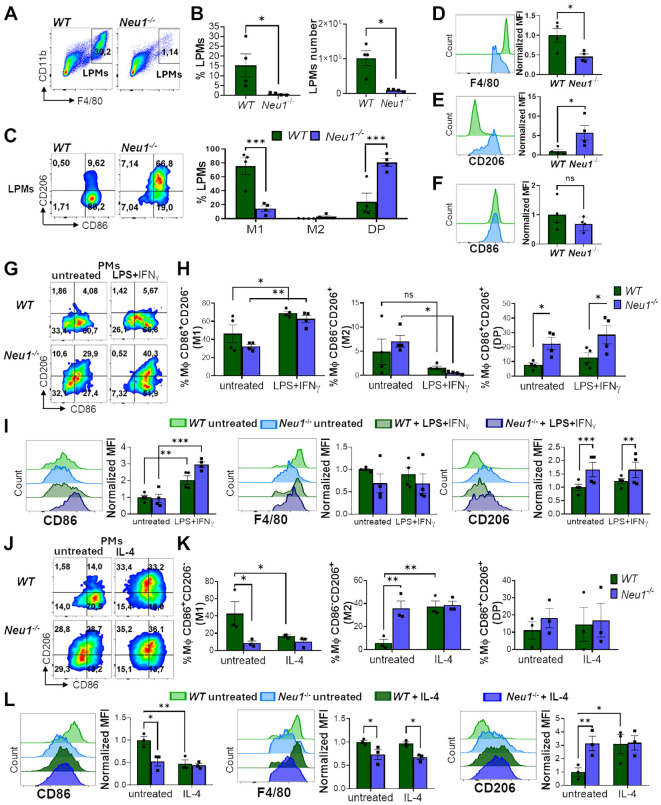
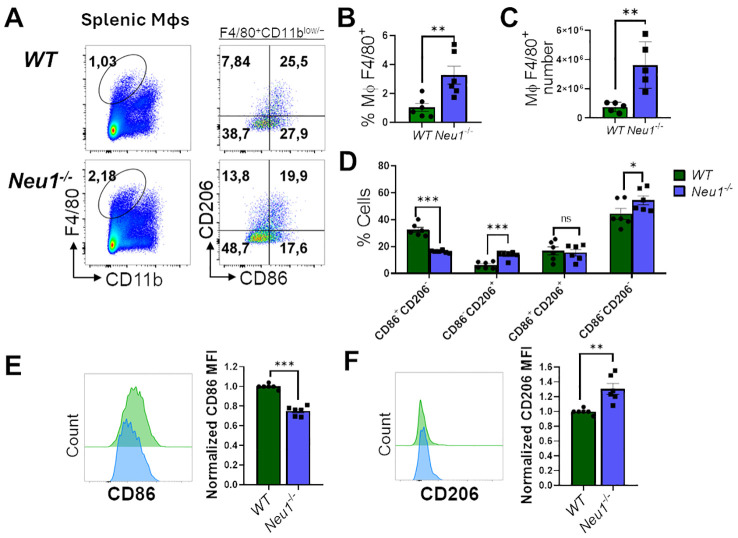
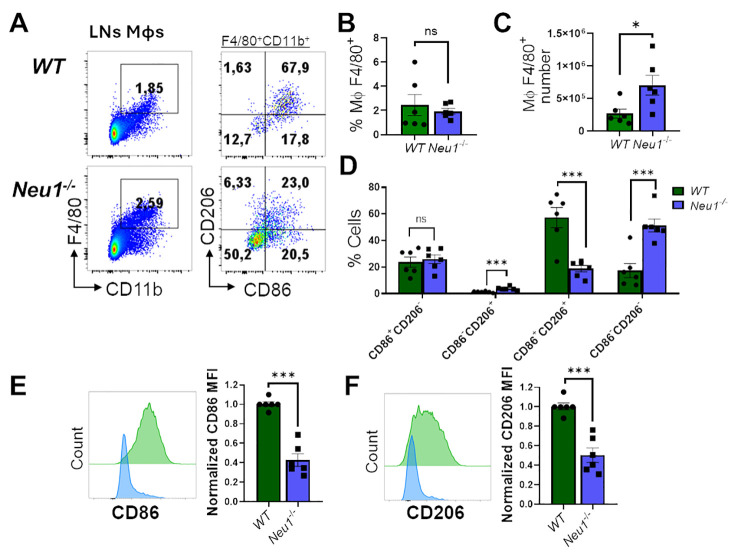
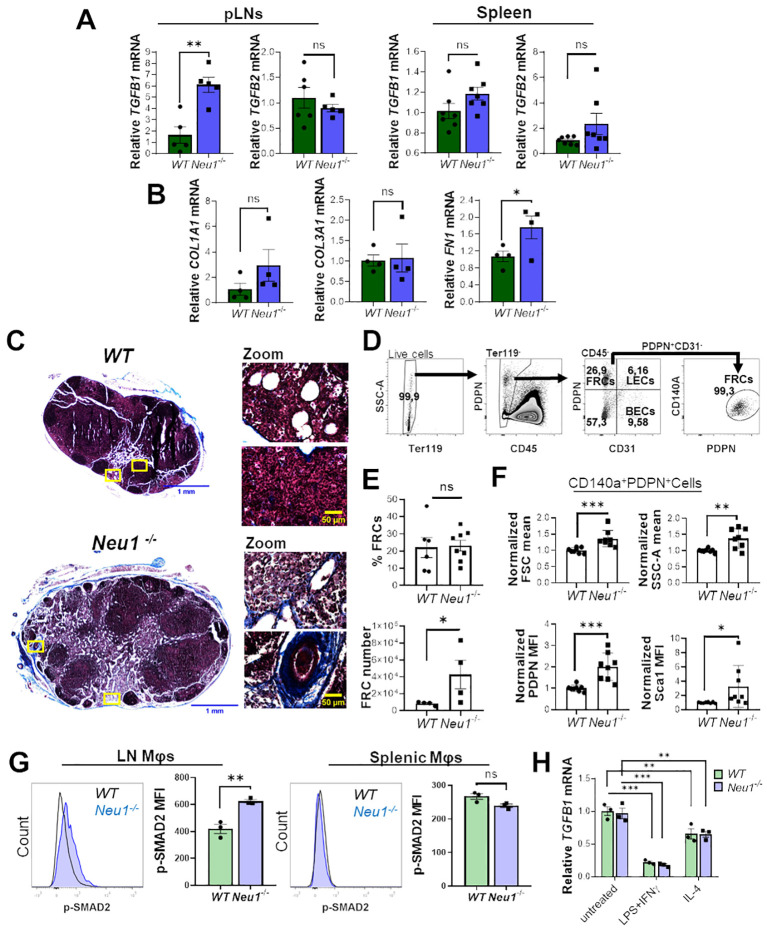
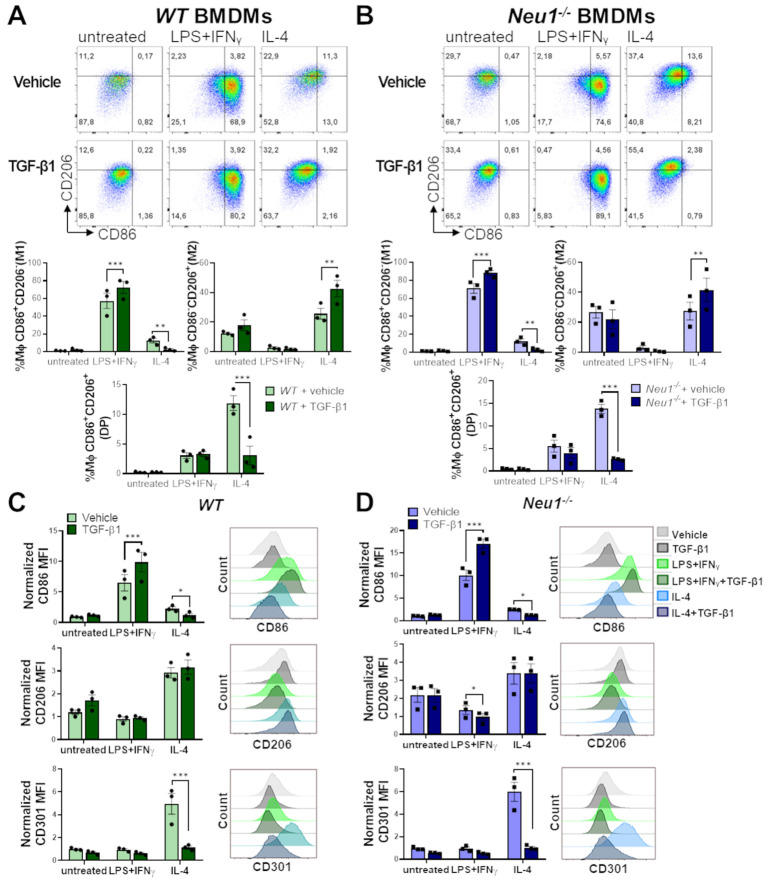
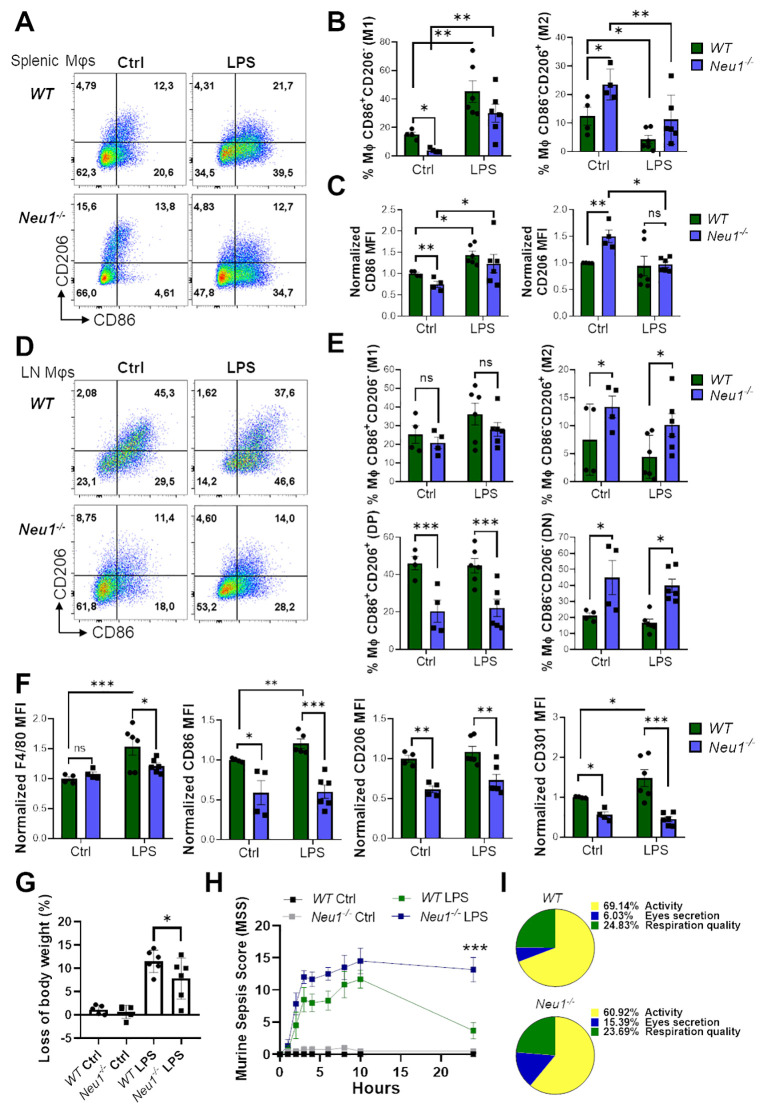
Macrophages play a pivotal role in tissue homeostasis, pathogen defense, and inflammation resolution. M1 and M2 macrophage phenotypes represent two faces in a spectrum of responses to microenvironmental changes, crucial in both physiological and pathological conditions. Neuraminidase 1 (Neu1), a lysosomal and cell surface sialidase responsible for removing terminal sialic acid residues from glycoconjugates, modulates several macrophage functions, including phagocytosis and Toll-like receptor (TLR) signaling. Current evidence suggests that Neu1 expression influences M1/M2 macrophage phenotype alterations in the context of cardiovascular diseases, indicating a potential role for Neu1 in macrophage polarization. For this reason, we investigated the impact of Neu1 deficiency on macrophage polarization in vitro and in vivo. Using bone marrow-derived macrophages (BMDMs) and peritoneal macrophages from Neu1 knockout (Neu1-/- ) mice and wild-type (WT) littermate controls, we demonstrated that Neu1-deficient macrophages exhibit an aberrant M2-like phenotype, characterized by elevated macrophage mannose receptor 1 (MMR/CD206) expression and reduced responsiveness to M1 stimuli. This M2-like phenotype was also observed in vivo in peritoneal and splenic macrophages. However, lymph node (LN) macrophages from Neu1-/- mice exhibited phenotypic alterations with reduced CD206 expression. Further analysis revealed that peripheral LNs from Neu1-/- mice were highly fibrotic, with overexpression of transforming growth factor-beta 1 (TGF-β1) and hyperactivated TGF-β signaling in LN macrophages. Consistently, TGF-β1 was found to alter M1/M2 macrophage polarization in vitro. Our findings showed that Neu1 deficiency prompts macrophages towards an M2 phenotype and that microenvironmental changes, particularly increased TGF-β1 in fibrotic tissues such as peripheral LNs in Neu1-/- mice, further influence M1/M2 macrophage polarization, highlighting its sensitivity to the local microenvironment. Therapeutic interventions targeting Neu1 or TGF-β signaling pathways may offer the potential to regulate macrophage behavior across different diseases.

Keywords: TGF-β; fibrosis; lymph node microenvironment; macrophage polarization; neuraminidase 1; sialidosis.


Conflict of interest statement

The authors declare that the research was conducted in the absence of any commercial or financial relationships that could be construed as a potential conflict of interest.

Figures

Figure 1
Figure 1
Neu1-deficient BMDMs overexpress the M2 marker CD206/MMR1 and exhibit an abnormal phenotype under in vitro M1/M2 polarization. (A-F) Analysis of WT and Neu1 -/- BMDMs phenotypes after 24 hours of in vitro polarization. Macrophage differentiation to M1 was induced with LPS (100 ng/ml), and LPS plus IFN-γ (100 ng/ml and 10 ng/ml, respectively), while M2 macrophages were induced with IL-4 (100 ng/ml). As control we used unstimulated macrophages (M0 condition). (A) Representative pseudocolor dot-plots showing WT and Neu1 -/- BMDMs (F4/80+CD11b+) (left), and MMR and CD86 expression in WT and Neu1 -/- BMDMs after in vitro polarization (right). (B) Quantification of the frequencies of M1 (CD86+CD206-), M2 (CD86-CD206+) and double-positive (DP) (CD206+CD86+) macrophages in WT and Neu1 -/- BMDMs after polarization. (C-F) Representative histograms and graphs of F4/80 (D), CD86 (E) and CD206 (F) expression in WT (green) and Neu1 -/- (blue) BMDMs after in vitro polarization. For quantification, mean fluorescence intensity (MFI) was normalized to the average of the untreated WT group. Bars represent mean ± SEM. *p < 0.05, **p < 0.01, ***p < 0.001 by two-way ANOVA with Bonferroni post-hoc test. Data from n=3 mice per group (WT and Neu1 -/-) across 3 independent experiments are shown. (G-I) Relative gene expression of mannose receptor C-type 1 (Mrc-1/CD206) (G), arginase 1 (arg-1) (H) and inducible nitric oxide synthase (iNOS) (I) by Realtime-PCR in WT and Neu1 -/- BMDMs after in vitro polarization. Actin was used as housekeeping. Data from n=3 were normalized to the average of the control WT group. Bars represent mean ± SEM. *p < 0.05, **p < 0.01, ***p < 0.001 by two-way ANOVA with Bonferroni post-hoc test. MΦ, macrophages.
Figure 2
Figure 2
Peritoneal macrophages (PMs) of Neu1-/- mice display M2 phenotype and alterations in the in vitro polarization assay. (A-F) Analysis of large peritoneal macrophages (LPMs) from WT and Neu1 -/- mice. (A) Representative pseudocolor dot-plots showing LPMs (CD11b+F4/80high). (B) Quantification of the frequency and number of LPMs in WT and Neu1-/- mice. Bars represent mean ± SEM. *p < 0.05 by unpaired t-test. (C) Representative pseudocolor dot-plots displaying CD206 and CD86 expression in LPMs of WT and Neu1-/- mice (left) and quantification of M1, M2 and double-positive (DP) LPMs frequencies (right). Bars represent mean ± SEM. *p < 0.05 by unpaired t-test. (D-F) Representative histograms and graphs of F4/80 (D), CD206 (E) and CD86 (F) expression in WT (green) and Neu1-/- (blue) LPMs. For quantification, mean fluorescence intensity (MFI) was normalized relative to the average of WT mice. Bars represent mean ± SEM. *p < 0.05, ***p < 0.001 by two-way ANOVA with Bonferroni post-hoc test. Data from 4 mice per group are shown. (G-I) Assessment of WT and Neu1-/- PMs phenotype after M1 in vitro polarization. (G) Representative pseudocolor dot-plots showing CD206 and CD86 expression in WT and Neu1 -/-PMs after 24 hours of M1 in vitro polarization with LPS plus IFN-γ (100ng/ml and 10ng/ml, respectively). (H) Quantification of M1, M2 and DP frequencies of WT and Neu1 -/- PMs after M1 polarization. (I) Representative histograms and MFI graphs of CD86, F4/80 and CD206 in WT and Neu1 -/- PMs after M1 polarization. Bars represent mean ± SEM. ns: not significant, *p < 0.05, **p < 0.01, ***p < 0.001 by two-way ANOVA with Bonferroni post-hoc test. Data from n=4 from 3 independent experiments. (J-L) Assessment of WT and Neu1-/- PMs phenotype after M2 in vitro polarization. (J) Representative pseudocolor dot-plots showing CD206 and CD86 expression in WT and Neu1 -/- PMs after 48 hours of M2 in vitro polarization with 100 ng/ml of IL-4. (K) Quantification of M1, M2 and DP frequencies of WT and Neu1 -/- PMs after M2 polarization. (L) Representative histograms and graphs of CD86, F4/80 and CD206 expression in WT and Neu1 -/- PMs after M2 polarization. MFI were normalized relative to the average of the untreated WT group. Bars represent mean ± SEM. *p < 0.05, **p < 0.01 by two-way ANOVA with Bonferroni post-hoc test. Data from n=3 from 3 independent experiments. MΦ, macrophages.
Figure 3
Figure 3
Neu1-/- splenic macrophages show an aberrant M1/M2 phenotype. (A) Representative pseudocolor dot-plots of splenic macrophages (F4/80+, CD11blow/−) (left) and CD206 and CD86 expression (right). (B, C) Quantification of frequency (B) and number (C) of F4/80+ splenic macrophages from WT and Neu1-/- mice. (D) Quantification of CD86+CD206-, CD86-CD206+, double-positive (DP) (CD206+CD86+) and double-negative (DN) (CD206-CD86-) frequencies of WT and Neu1 -/- splenic macrophages. (E, F) Representative histograms and relative expression of CD86 (E) and CD206 (F) in WT (green) and Neu1 -/- (blue) splenic macrophages. Mean fluorescence intensity (MFI) was normalized relative to the average of WT mice. Bars represent mean ± SEM. ns: not significant, *p < 0.05, **p < 0.01, ***p < 0.001 by unpaired t-test for (B, C, E, F) and two-way ANOVA with Bonferroni post-hoc test for (D) Data from n=6 from 5 independent experiments. MΦ, macrophages.
Figure 4
Figure 4
Lymph nodes (LN) macrophages of Neu1-/- mice are predominantly double negative (CD86-CD206-) and have diminished M1 and M2 markers. (A) Representative pseudocolor dot-plots of LN macrophages (CD11b+ F4/80+) (left) and their CD206 and CD86 expression (right). (B, C) Quantification of frequency (B) and number (C) of pLNs from WT and Neu1-/- mice. (D) Quantification of CD86+CD206-, CD86-CD206+, double-positive (DP) (CD206+CD86+) and double-negative (DN) (CD206-CD86-) frequencies of LN macrophages. (E, F). Representative histograms and relative expression of CD86 (E) and CD206 (F) in LN macrophages from WT (green) and Neu1-/- (blue) mice. Mean fluorescence intensity (MFI) was normalized relative to the average of WT mice. Bars represent mean ± SEM. ns: not significant, *p < 0.05, ***p < 0.001 by unpaired t-test for (B, C, E, F) and two-way ANOVA with Bonferroni post-hoc test for (D) Data from n=6 from 5 independent experiments. MΦ, macrophages.
Figure 5
Figure 5
Peripheral lymph nodes (pLNs) of Neu1-/- mice have increased fibrosis and activation of TGF-β signaling in lymph node macrophages. (A) Relative expression of TGFB1 and TGFB2 in pLNs and spleens of WT and Neu1-/- mice. Actin was used as housekeeping. Bars show the mean ± SEM. Data from at least n=5 of 3 independent experiments were analyzed by unpaired t-test. ns: not significant, **p < 0.01. (B) Relative expression of collagen type I alpha 1 chain (COL1A1), collagen type III alpha 1 chain (COL3A1) and fibronectin (FN1) in pLNs of WT and Neu1-/- mice. Actin was used as housekeeping. Bars show the mean ± SEM, Data n=4. from 2 independent experiments were analyzed by unpaired t-test. ns: not significant; *p < 0.05. (C) Representative images of Masson’s trichrome staining of inguinal LN sections of WT and Neu1-/- mice, scale bar represent 1 mm in whole LN section (left) and 50 µM in zooms (right). Data from 2 independent experiments is shown. (D-F) Analysis of fibroblastic reticular cells (FRCs) of pLNs of WT and Neu1-/- mice. (D) Flow cytometry gating strategy to select FRCs (Ter119-CD45-CD31-CD140a+PDPN+ cells). (E) Quantification of the frequency and cells number of FRCs in pLNs of WT and Neu1-/- mice. Bars show mean ± SEM. Data from at least n=4 from 3 independent experiments were analyzed by unpaired t test, ns: not significant, *p < 0.05. (F) Graphs of FSC mean, SSC-A mean, podoplanin (PDPN) and Sca1 expression in FRCs of pLNs of WT and Neu1-/- mice. Mean fluorescence intensity (MFI) was normalized relative to the average of WT mice. Bars show mean ± SEM (n=8) from 3 independent experiments and were analyzed by unpaired t test, *p < 0.05, **p < 0.01, ***p < 0.001. (G) Representative histograms and MFI quantification of pSMAD-2 in F4/80+ LN and splenic macrophages of WT and Neu1-/- mice. Bars show mean ± SEM (n=3). Data were analyzed by unpaired t test. ns: not significant, **p < 0.01. (H) Relative expression of TGFB1 in WT and Neu1-/- BMDMs after 24 hours of culture under different conditions: M0 (untreated), M1 (100 ng/ml LPS plus 10 ng/ml IFN-γ) or M2 (100 ng/ml IL-4). Actin was used as housekeeping gene. Data from n=3 were normalized to the average of the control WT group. Bars represent mean ± SEM. **p < 0.01, ***p < 0.001 by two-way ANOVA with Bonferroni post-hoc test. MΦ, macrophages.
Figure 6
Figure 6
Effect of TGF-β1 on in vitro polarization of WT and Neu1-/- BMDMs. Evaluation of TGF-β1 effect on in vitro polarization of WT (A, C) and Neu1-/- BMDMs (B, D). (A, B) (Above) Representative pseudocolor dot-plots showing CD206 and CD86 expression in WT (A) and Neu1-/- (B) BMDMs (CD11b+F4/80+ gated) differentiated into M1 or M2 macrophages using 100 ng/ml LPS plus 10 ng/ml IFN-γ or 100ng/ml IL-4, respectively. Additionally, cultures were simultaneously stimulated with or without TGF-β1 at 20 ng/ml. (Below) Graphs of the frequency of M1 (CD86+CD206-), M2 (CD86-CD206+) and DP (CD206+CD86+) WT (A) and Neu1-/- (B) macrophages under different polarization conditions with or without TGF-β1. Bars are the mean ± SEM. *p < 0.05, **p < 0.01, ***p < 0.001 by two-way ANOVA with Bonferroni post-hoc test. Data from n=3 from 3 independent experiments. (C, D) Representative histograms and quantification of mean fluorescence intensity (MFI) of CD86, CD206 and CD301 in WT (C) and Neu1-/- (D) macrophages under different polarization conditions with or without TGF-β1. MFI were normalized relative to the average of the untreated group. Bars are the mean ± SEM. *p < 0.05, **p < 0.01, ***p < 0.001 by two-way ANOVA with Bonferroni post-hoc test. Data from n=3 from 3 independent experiments are shown. MΦ, macrophages.
Figure 7
Figure 7
Macrophages from spleen, but not LN of Neu1-/- mice respond to in vivo inflammatory stimulation. (A) Representative pseudocolor dot-plots of CD206 and CD86 expression in F4/80+ splenic macrophages of WT and Neu1 -/- mice after 24 hours post-injection of LPS. (B, C) Quantification of the frequency of M1 (CD86+CD206- ) and M2 (CD86- CD206+) subpopulation (B) and M2 (CD86-CD206+) subpopulation and relative mean fluorescence intensity (MFI) of CD86 and CD206 (C) of WT and Neu1 -/- splenic macrophages in (A). (D) Representative pseudocolor dot-plots of CD206 and CD86 expression in F4/80+ LN macrophages of WT and Neu1 -/- mice after 24 hours post-injection of LPS. (E) Quantification of frequency of M1 (CD86+CD206-), M2 (CD86-CD206+), double-positive (DP) (CD206+CD86+) and double-negative (DN) (CD206-CD86-) WT and Neu1 -/- LN macrophages showed in D. (F) Relative MFI of F4/80, CD86, CD206 and CD301 in WT and Neu1 -/- LN macrophages in D. MFI was normalized relative to the average of WT mice. (G, H) Changes in body weight (G) and Murine sepsis score (MMS) (H) at 0, 1, 2, 3, 4, 6, 8, 10 and 24 hours after LPS injection of WT and Neu1 -/- mice. (I) Parts of whole representation of the main indicators (activity, eye secretion, respiration) of WT and Neu1 -/- mice during the whole in vivo inflammatory assay. Error bars represent mean ± SEM. ns: not significant, *p < 0.05, **p < 0.01, ***p < 0.001 by two-way ANOVA with Bonferroni post-hoc test. Data from n=4 controls and n=6 treated mice from 2 independent experiments. MΦ, macrophages.

Similar articles

References

    1. Mass E, Nimmerjahn F, Kierdorf K, Schlitzer A. Tissue-specific macrophages: how they develop and choreograph tissue biology. Nat Rev Immunol. (2023) 23:563–79. doi: 10.1038/s41577-023-00848-y - DOI - PMC - PubMed
    1. Wu Y, Hirschi KK. Tissue-resident macrophage development and function. Front Cell Dev Biol. (2020) 8:617879. doi: 10.3389/fcell.2020.617879 - DOI - PMC - PubMed
    1. De Kleer I, Willems F, Lambrecht B, Goriely S. Ontogeny of myeloid cells. Front Immunol. (2014) 5:423. doi: 10.3389/fimmu.2014.00423 - DOI - PMC - PubMed
    1. Uribe-Querol E, Rosales C. Phagocytosis: our current understanding of a universal biological process. Front Immunol. (2020) 11:1066. doi: 10.3389/fimmu.2020.01066 - DOI - PMC - PubMed
    1. Barker RN, Erwig LP, Hill KS, Devine A, Pearce WP, Rees AJ. Antigen presentation by macrophages is enhanced by the uptake of necrotic, but not apoptotic, cells. Clin Exp Immunol. (2002) 127:220–5. doi: 10.1046/j.1365-2249.2002.01774.x - DOI - PMC - PubMed

MeSH terms

LinkOut - more resources