. 2024 Sep 13:15:1440753.
doi: 10.3389/fimmu.2024.1440753. eCollection 2024.

Causal relationship, shared genes between rheumatoid arthritis and pulp and periapical disease: evidence from GWAS and transcriptome data

Affiliations

Causal relationship, shared genes between rheumatoid arthritis and pulp and periapical disease: evidence from GWAS and transcriptome data

Huili Wu et al. Front Immunol. .

Abstract

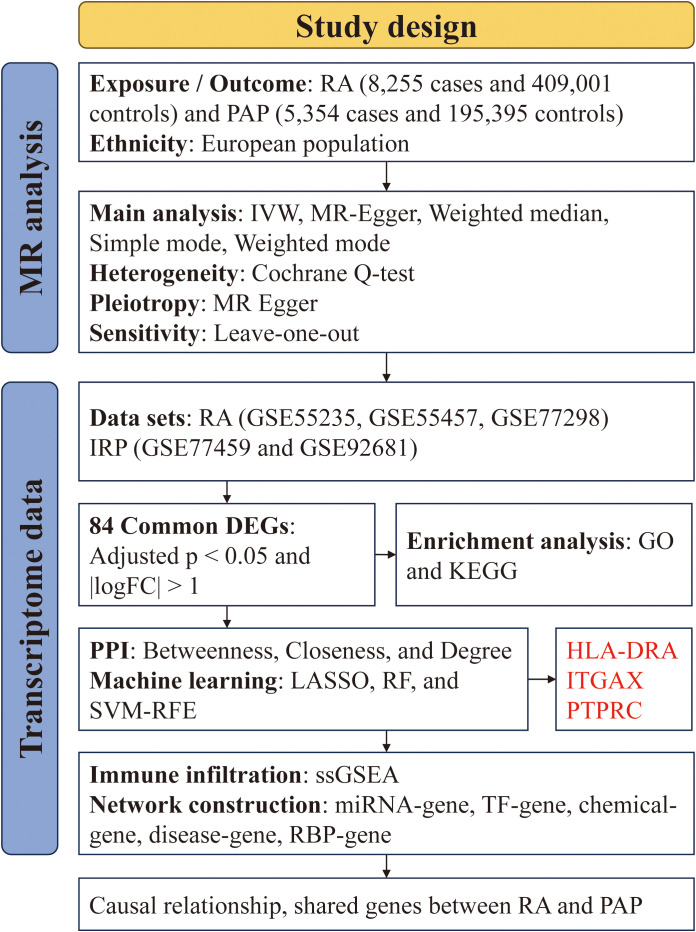
Objective: Patients with rheumatoid arthritis (RA) have an increased risk of developing pulp and periapical disease (PAP), but the causal relationship and shared genetic factors between these conditions have not been explored. This study aimed to investigate the bidirectional causal relationship between RA and PAP and to analyze shared genes and pathogenic pathways.

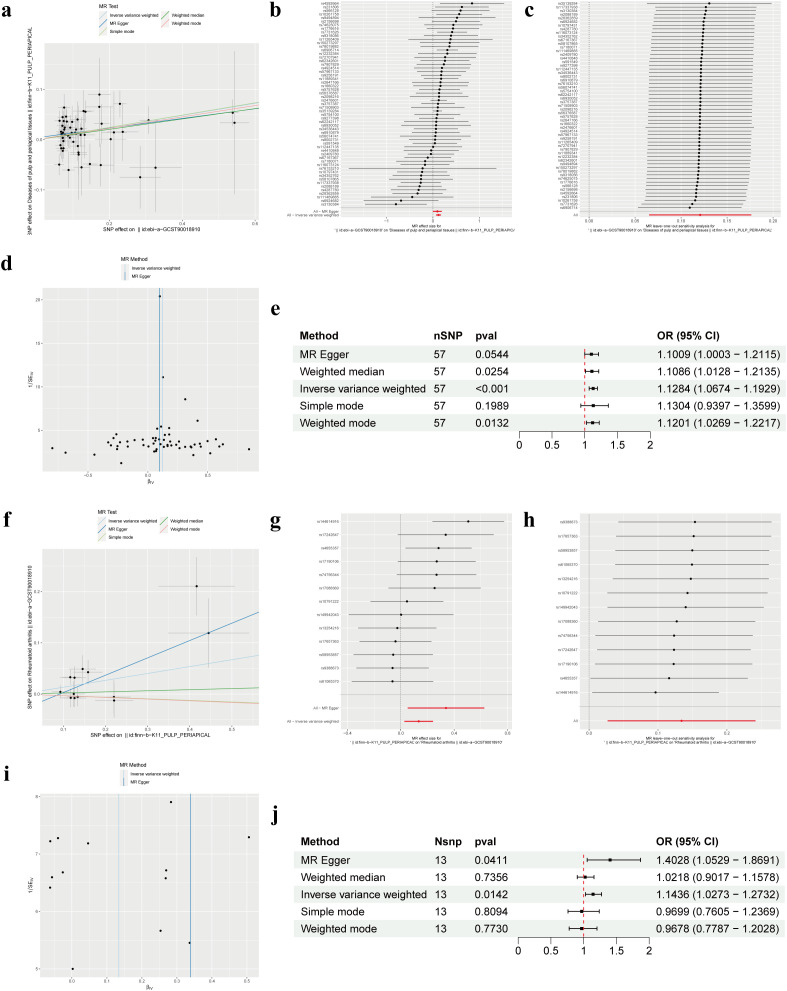
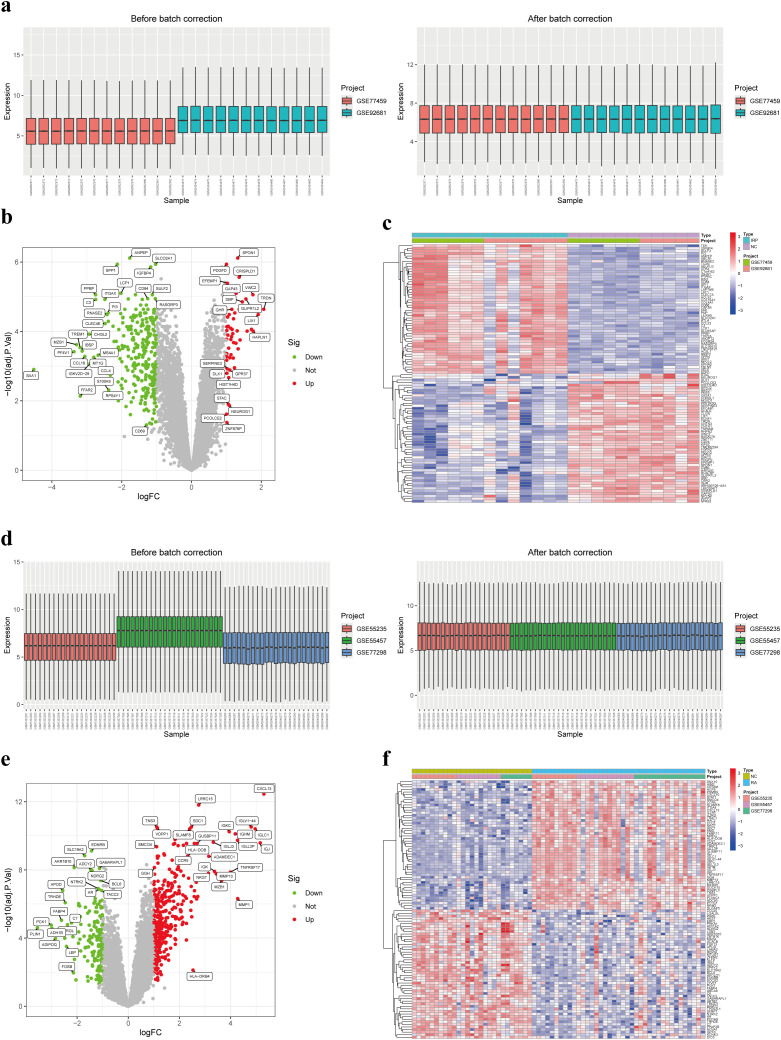
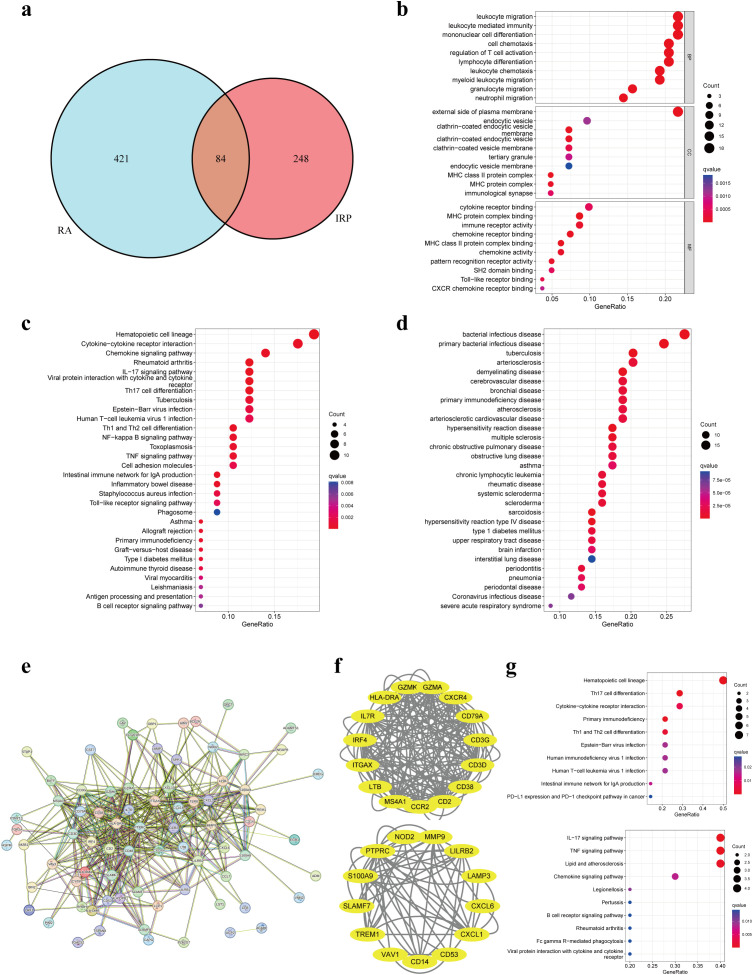
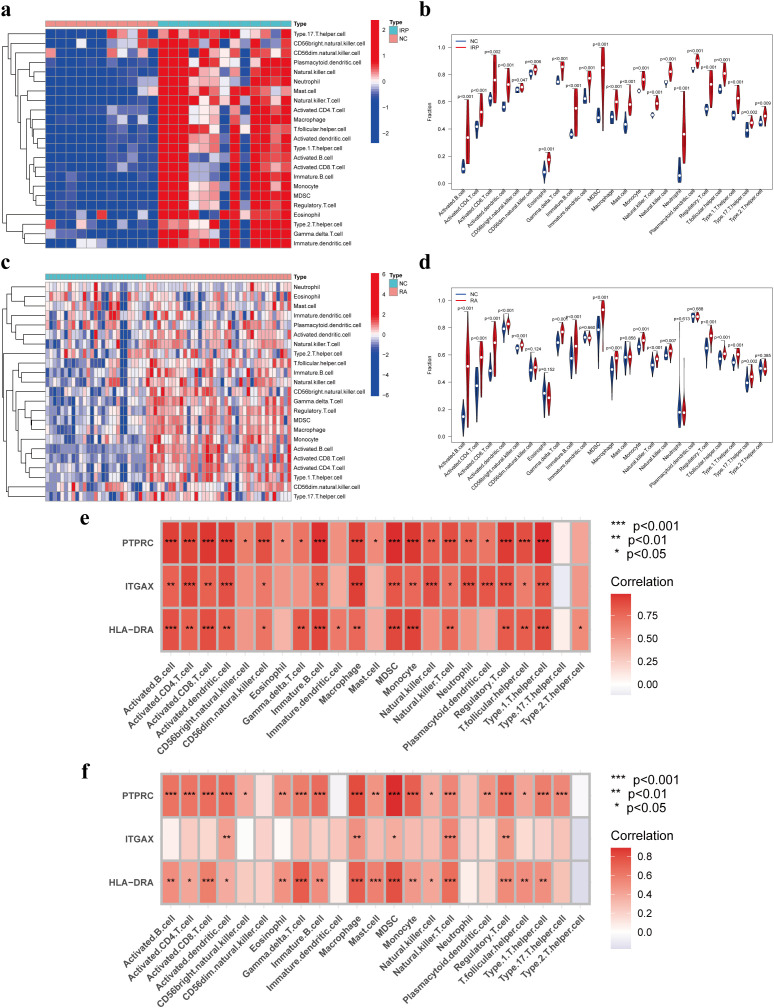
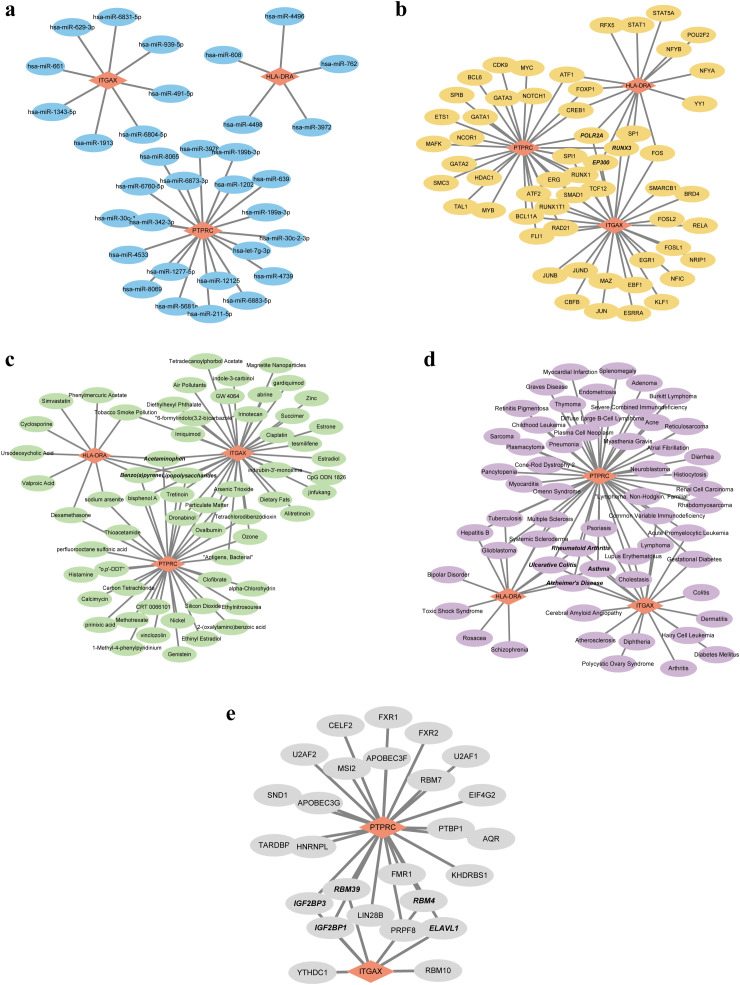
Methods: We utilized GWAS data from the IEU Open GWAS Project and employed five Mendelian randomization methods (MR Egger, weighted median, inverse variance weighted, simple mode, and weighted mode) to investigate the bidirectional causal relationship between RA and PAP. Transcriptome data for RA and irreversible pulpitis (IRP) were obtained from the GEO database. Hub genes were identified through differential analysis, CytoHubba, machine learning (ML), and other methods. The immune infiltration of both diseases was analyzed using the ssGSEA method. Finally, we constructed a regulatory network for miRNAs, transcription factors, chemicals, diseases, and RNA-binding proteins based on the identified hub genes.

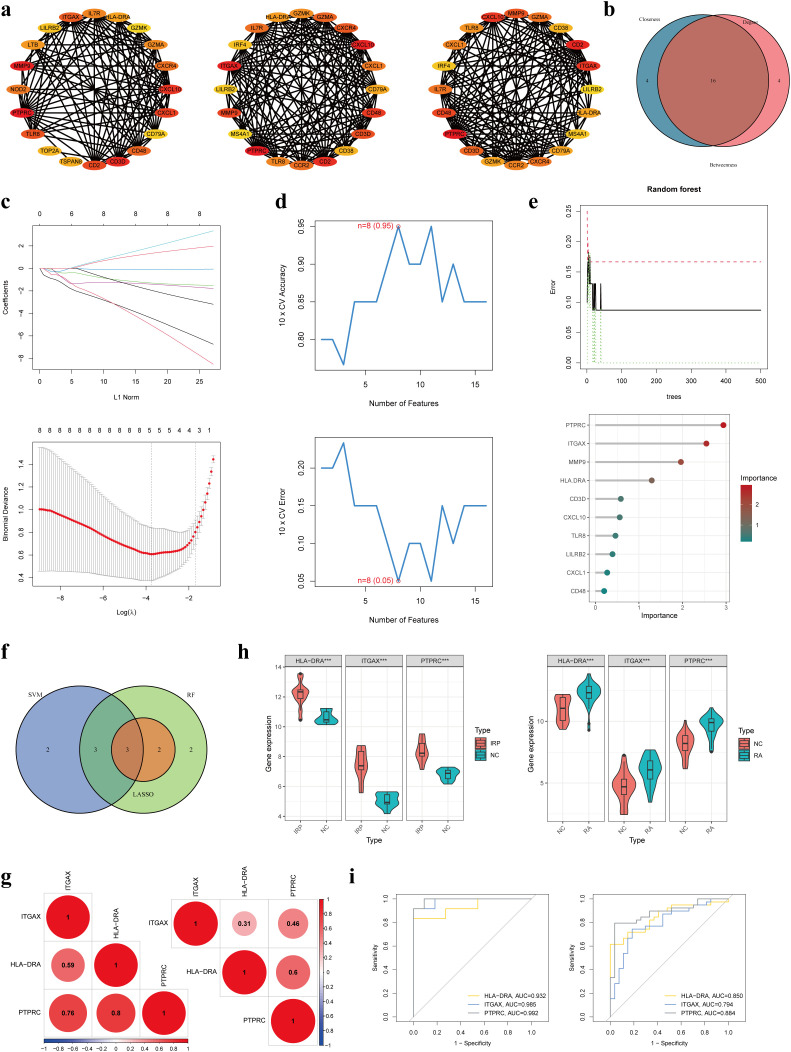
Results: RA was significantly associated with an increased risk of PAP (OR = 1.1284, 95% CI 1.0674-1.1929, p < 0.001). However, there was insufficient evidence to support the hypothesis that PAP increased the risk of RA. Integrating datasets and differential analysis identified 84 shared genes primarily involved in immune and inflammatory pathways, including the IL-17 signaling pathway, Th17 cell differentiation, and TNF signaling pathway. Using CytoHubba and three ML methods, we identified three hub genes (HLA-DRA, ITGAX, and PTPRC) that are significantly correlated and valuable for diagnosing RA and IRP. We then constructed a comprehensive regulatory network using the miRDB, miRWalk, ChipBase, hTFtarget, CTD, MalaCards, DisGeNET, and ENCORI databases.

Conclusion: RA may increase the risk of PAP. The three key genes, HLA-DRA, ITGAX, and PTPRC, have significant diagnostic value for both RA and IRP.

Keywords: Mendelian randomization; hub genes; irreversible pulpitis; pulp and periapical disease; rheumatoid arthritis.


Conflict of interest statement

The authors declare that the research was conducted in the absence of any commercial or financial relationships that could be construed as a potential conflict of interest.

Figures

Figure 1
Figure 1
The flowchart of the study.
Figure 2
Figure 2
Mendelian randomization revealed the bidirectional causal relationship between RA and PAP. (A) Scatter plot of SNPs related to RA and the risk of PAP. (B) Forest plot of SNPs associated with RA and the risk of PAP. (C) Leave‐one‐out of SNPs associated with RA and the risk of PAP. (D) Funnel plot for RA on PAP. (E) Associations of genetically predicted RA and the risk of PAP. (F) Scatter plot of SNPs related to PAP and the risk of RA. (G) Forest plot of SNPs associated with PAP and the risk of RA. (H) Leave‐one‐out of SNPs associated with PAP and the risk of RA. (I) Funnel plot for PAP on RA. (J) Associations of genetically predicted PAP and the risk of RA. RA, Rheumatoid arthritis; PAP, Pulp and periapical disease; SNP, Single nucleotide polymorphism.
Figure 3
Figure 3
Identification of DEGs in IRP and RA. (A) Box plots of two IRP datasets before and after batch correction. (B) Volcano plot of the DEGs in IRP. (C) Heatmap of the top 50 up-regulated and down-regulated genes in IRP. (D) Box plots of three RA datasets before and after batch correction. (E) Volcano plot of the DEGs in RA. (F) Heatmap of the top 50 up-regulated and down-regulated genes in RA. DEGs, Differentially-expressed genes; IRP, Irreversible pulpitis.
Figure 4
Figure 4
Enrichment analyses based on the shared DEGs. (A) Intersecting DEGs obtained by IRP group and RA group. (B) GO analysis according to the DEGs. (C) KEGG analysis revealed the pathways related to the DEGs. (D) DO analysis revealed the diseases related to the DEGs. (E) Construction of a PPI network using the proteins encoded by the 84 DEGs. (F) Identification of two important modules using the MCODE plug-in. (G) KEGG analyses for the two modules. GO, Gene Ontology; KEGG, Kyoto Encyclopedia of Genes and Genomes; DO, Disease Ontology; PPI, Protein-protein interaction.
Figure 5
Figure 5
Identification of three hub genes in IRP. (A) Three algorithms (Betweenness, Closeness, and Degree) within the CytoHubba plug-in presented the top 20 genes in the PPI network. (B) Intersecting the key genes obtained by the above three algorithms. (C) Identification the key genes among the 16 genes using LASSO regression. (D) Identification the key genes using SVM-RFE. (E) Identification the key genes using RF. (F) Obtaining the three hub genes using the three ML methods. (G) The correlation among the three genes in IRP and RA, respectively. (H) Verification of the differential expression of the hub genes in IRP and RA groups. (I) Verification of the diagnostic value of the hub genes using the ROC curves. LASSO, least absolute shrinkage and selection operator; SVM-RFE, Support vector machine-recursive feature elimination; RF, Random forest; ML, Machine learning; ROC, Receiver operating characteristic. P***<0.001.
Figure 6
Figure 6
Immune infiltration analysis of IRP and RA groups. Comparison of the fraction of 23 immune cells between NC and IRP samples using the heatmap (A), and the violin plot (B). Comparison of the fraction of 23 immune cells between NC and RA samples using the heatmap (C), and the violin plot (D). The relationship between the hub genes and immune cell infiltration in IRP (E) and RA (F), respectively. NC, Negative control. P*<0.05, P**<0.01; P***<0.001.
Figure 7
Figure 7
Five regulatory network of the three hub genes. (A) Visualization of the miRNA-mRNA network. (B) Visualization of the TF-mRNA network. (C) Visualization of the chemical-mRNA network. (D) Visualization of the disease-mRNA network. (E) Visualization of the RBP-mRNA network. TF, Transcription factor; RBP, RNA-binding protein.

Similar articles

Cited by

References

    1. Chum JD, Lim DJZ, Sheriff SO, Pulikkotil SJ, Suresh A, Davamani F. In vitro evaluation of octenidine as an antimicrobial agent against Staphylococcus epidermidis in disinfecting the root canal system. Restor Dent Endod. (2019) 44:e8. doi: 10.5395/rde.2019.44.e8 - DOI - PMC - PubMed
    1. Chandwani ND, Gedam UD, Deshmukh R, Dakshindas DM, Shrigiriwar M. Mines of cytokine: A treasure trove in pulpal and periapical diseases. J Conserv Dent Endod. (2024) 27:227–32. doi: 10.4103/JCDE.JCDE_289_23 - DOI - PMC - PubMed
    1. Tiburcio-MaChado CS, Michelon C, Zanatta FB, Gomes MS, Marin JA, Bier CA. The global prevalence of apical periodontitis: a systematic review and meta-analysis. Int Endod J. (2021) 54:712–35. doi: 10.1111/iej.13467 - DOI - PubMed
    1. Hernandez Vigueras S, Donoso Zuniga M, Jane-Salas E, Salazar Navarrete L, Segura-Egea JJ, Velasco-Ortega E, et al. . Viruses in pulp and periapical inflammation: a review. Odontology. (2016) 104:184–91. doi: 10.1007/s10266-015-0200-y - DOI - PubMed
    1. Ye L, Cao L, Song W, Yang C, Tang Q, Yuan Z. Interaction between apical periodontitis and systemic disease (Review). Int J Mol Med. (2023) 52. doi: 10.3892/ijmm - DOI - PMC - PubMed