

Unraveling the role of ADAMs in clinical heterogeneity and the immune microenvironment of hepatocellular carcinoma: insights from single-cell, spatial transcriptomics, and bulk RNA sequencing
- PMID: 39346916
- PMCID: PMC11427318
- DOI: 10.3389/fimmu.2024.1461424
Unraveling the role of ADAMs in clinical heterogeneity and the immune microenvironment of hepatocellular carcinoma: insights from single-cell, spatial transcriptomics, and bulk RNA sequencing
Abstract
Background: Hepatocellular carcinoma (HCC) is a prevalent and heterogeneous tumor with limited treatment options and unfavorable prognosis. The crucial role of a disintegrin and metalloprotease (ADAM) gene family in the tumor microenvironment of HCC remains unclear.
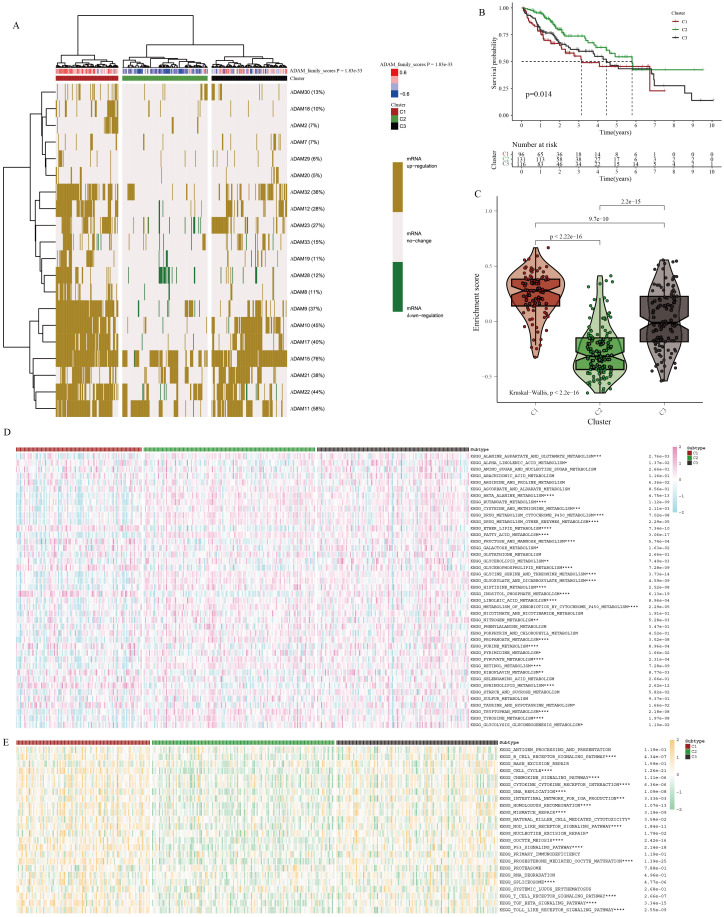
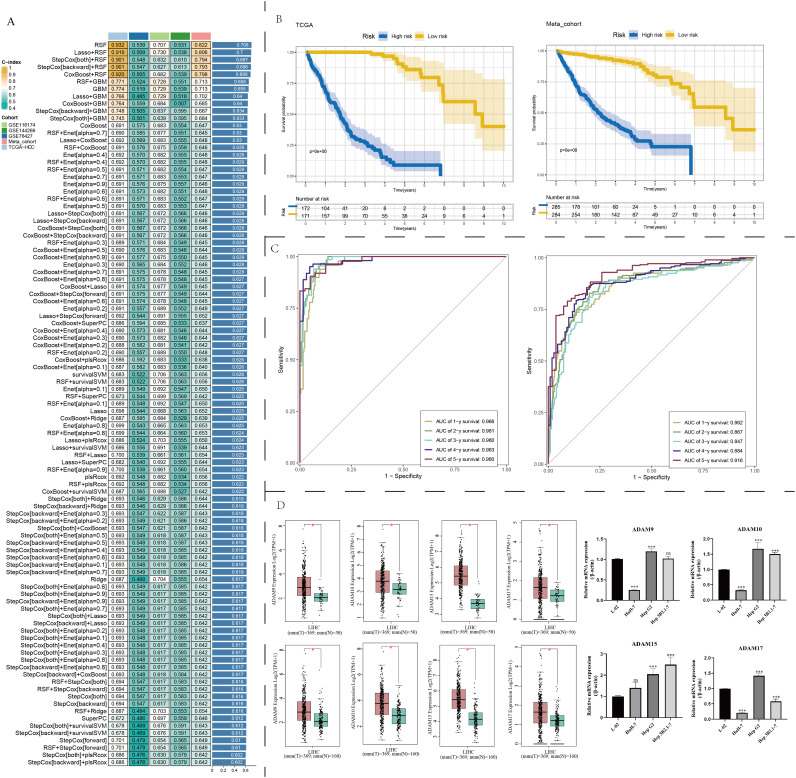
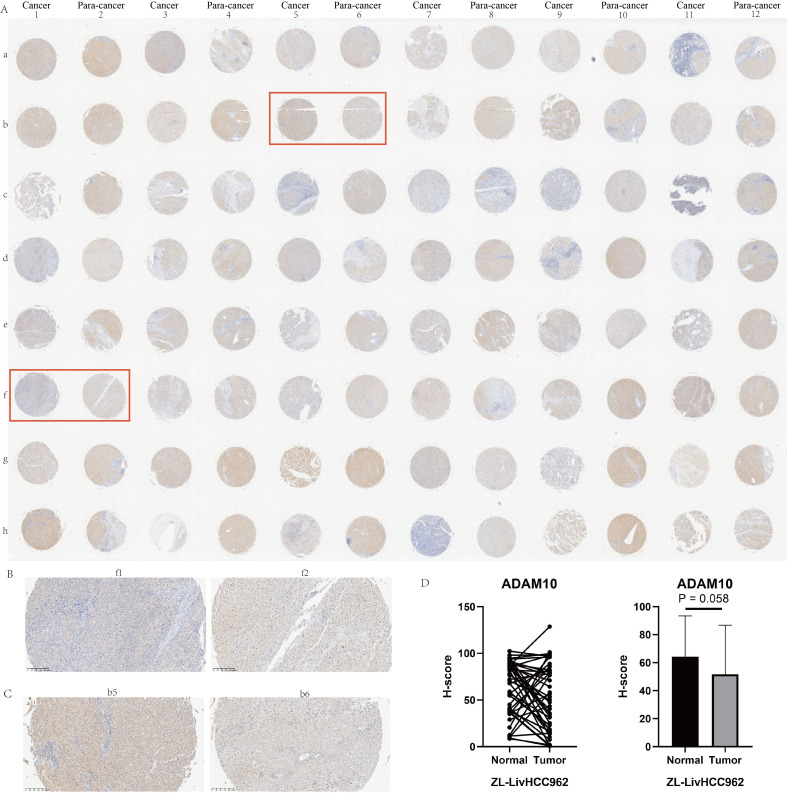
Methods: This study employed a novel multi-omics integration strategy to investigate the potential roles of ADAM family signals in HCC. A series of single-cell and spatial omics algorithms were utilized to uncover the molecular characteristics of ADAM family genes within HCC. The GSVA package was utilized to compute the scores for ADAM family signals, subsequently stratified into three categories: high, medium, and low ADAM signal levels through unsupervised clustering. Furthermore, we developed and rigorously validated an innovative and robust clinical prognosis assessment model by employing 99 mainstream machine learning algorithms in conjunction with co-expression feature spectra of ADAM family genes. To validate our findings, we conducted PCR and IHC experiments to confirm differential expression patterns within the ADAM family genes.
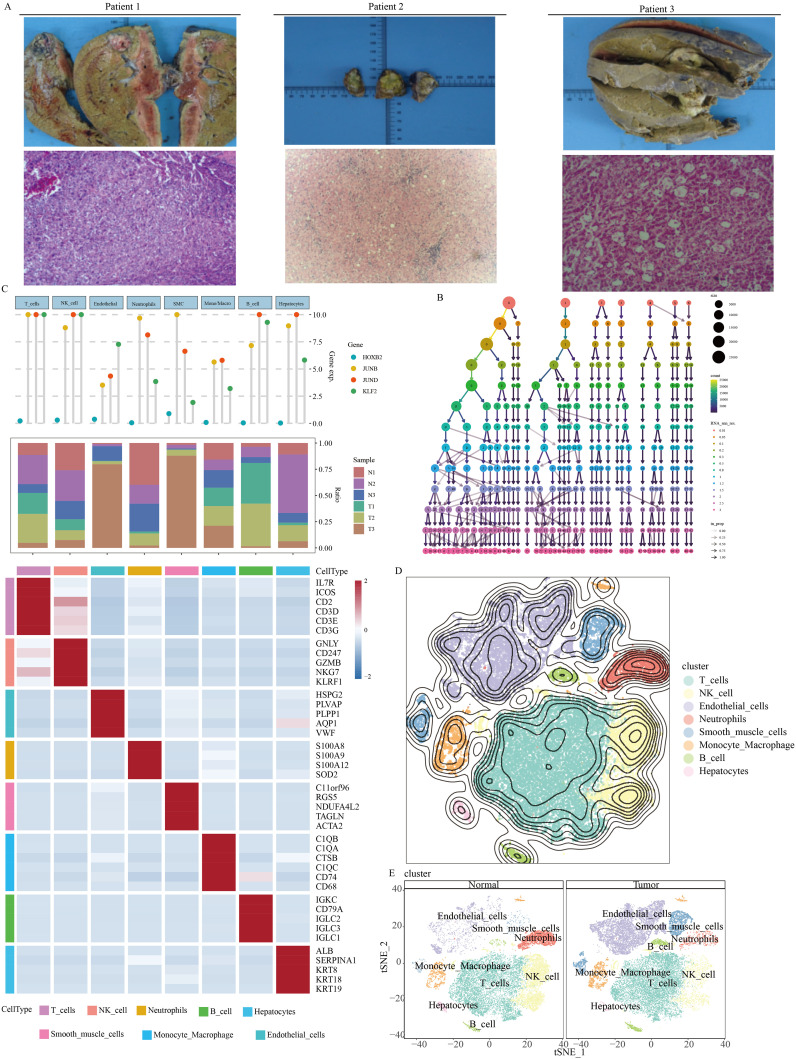
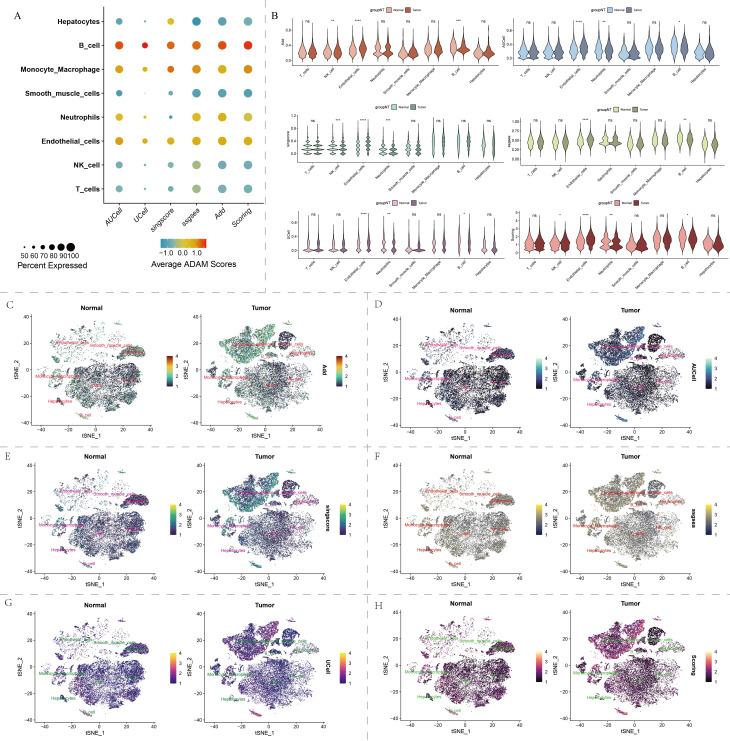
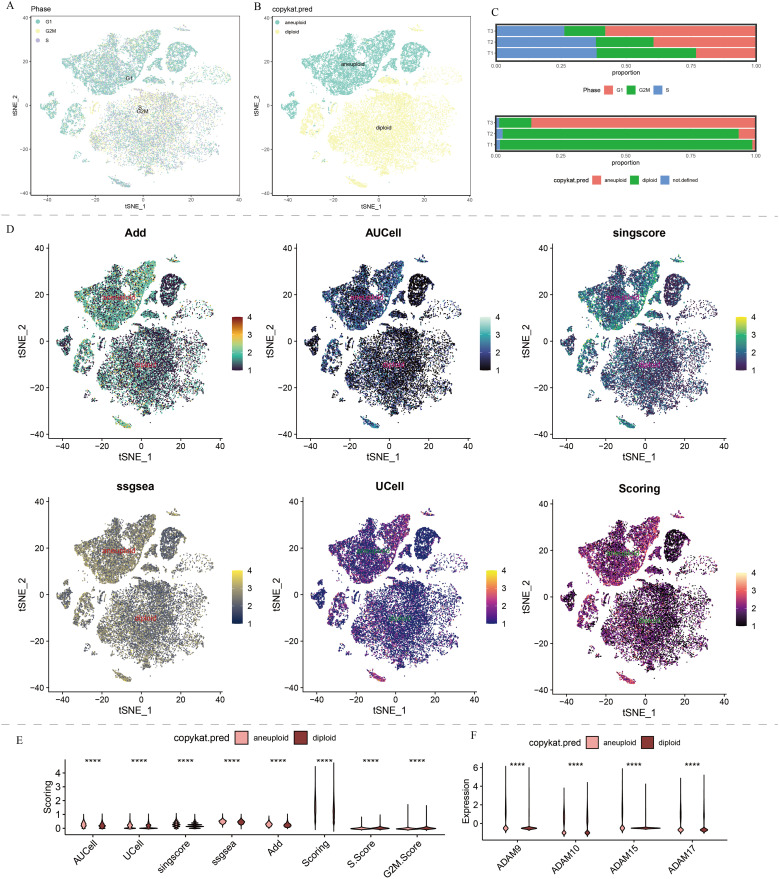
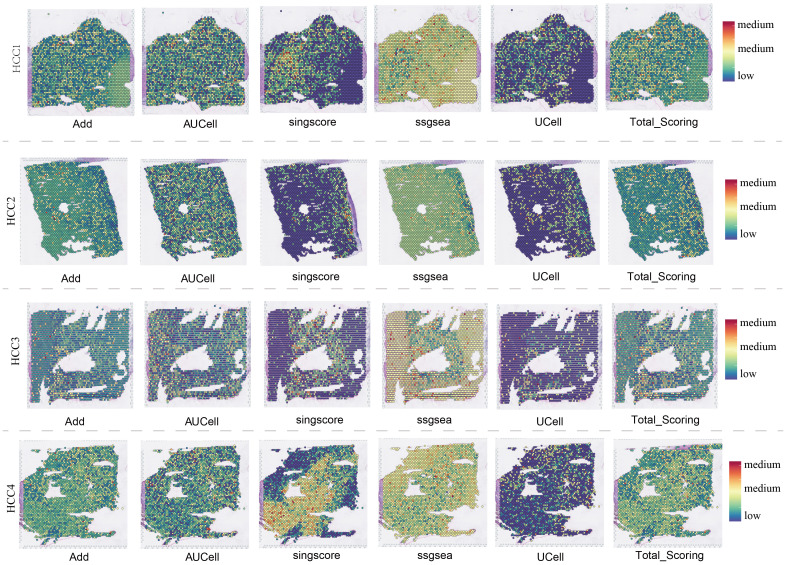
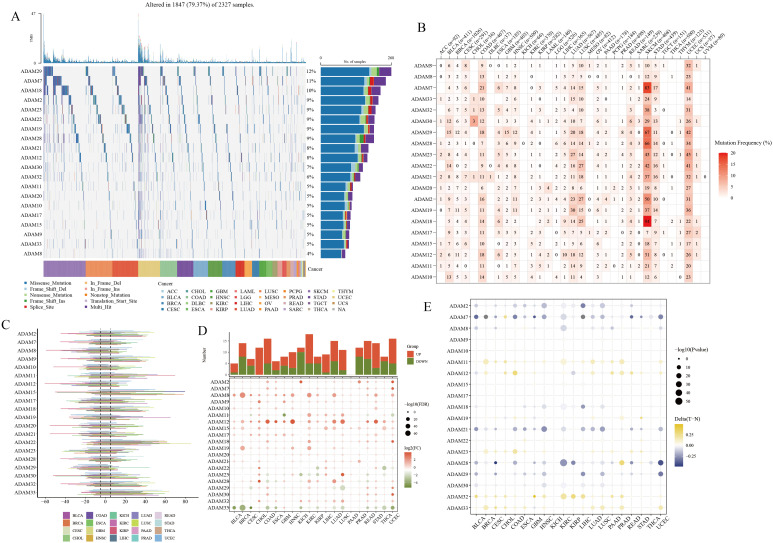
Results: Gene signals from the ADAM family were notably abundant in endothelial cells, liver cells, and monocyte macrophages. Single-cell sequencing and spatial transcriptomics analyses have both revealed the molecular heterogeneity of the ADAM gene family, further emphasizing its significant impact on the development and progression of HCC. In HCC tissues, the expression levels of ADAM9, ADAM10, ADAM15, and ADAM17 were markedly elevated. Elevated ADAM family signal scores were linked to adverse clinical outcomes and disruptions in the immune microenvironment and metabolic reprogramming. An ADAM prognosis signal, developed through the utilization of 99 machine learning algorithms, could accurately forecast the survival duration of HCC, achieving an AUC value of approximately 0.9.
Conclusions: This study represented the inaugural report on the deleterious impact and prognostic significance of ADAM family signals within the tumor microenvironment of HCC.
Keywords: ADAM family; bulk RNA sequencing; clinical heterogeneity; hepatocellular carcinoma; immune microenvironment; single-cell sequencing; spatial transcriptome sequencing.
Copyright © 2024 Chen, Yuan, Guan, Cui, Fu, Wei and Liu.
Conflict of interest statement
The authors declare that the research was conducted in the absence of any commercial or financial relationships that could be construed as a potential conflict of interest.
Figures
Similar articles
-
Integrated Analysis of Single-Cell and Bulk RNA-Sequencing Defines N7-Methylguanosine (m7G)-Mediated Modifications' Role in Prognosis and the Tumor Immune Microenvironment in Hepatocellular Carcinoma.Cancer Med. 2025 Jun;14(11):e70992. doi: 10.1002/cam4.70992. Cancer Med. 2025. PMID: 40485623 Free PMC article.
-
Multi-omics identification of a polyamine metabolism related signature for hepatocellular carcinoma and revealing tumor microenvironment characteristics.Front Immunol. 2025 Apr 22;16:1570378. doi: 10.3389/fimmu.2025.1570378. eCollection 2025. Front Immunol. 2025. PMID: 40330470 Free PMC article.
-
Elucidating the multifaceted role of MGAT1 in hepatocellular carcinoma: integrative single-cell and spatial transcriptomics reveal novel therapeutic insights.Front Immunol. 2024 Jul 16;15:1442722. doi: 10.3389/fimmu.2024.1442722. eCollection 2024. Front Immunol. 2024. PMID: 39081317 Free PMC article.
-
Unraveling the Heterogeneity of Tumor Immune Microenvironment in Hepatocellular Carcinoma by SingleCell RNA Sequencing and its Implications for Prognosis and Therapeutic Response.Turk J Gastroenterol. 2024 Nov 28;35(12):876-888. doi: 10.5152/tjg.2024.24118. Turk J Gastroenterol. 2024. PMID: 39641225 Free PMC article. Review.
-
Role of Radiomics-based Multiomics Panel in the Microenvironment and Prognosis of Hepatocellular Carcinoma.Acad Radiol. 2025 Apr;32(4):1961-1970. doi: 10.1016/j.acra.2024.12.039. Epub 2025 Jan 6. Acad Radiol. 2025. PMID: 39765431 Review.
Cited by
-
MAZ-mediated tumor progression and immune evasion in hormone receptor-positive breast cancer: Targeting tumor microenvironment and PCLAF+ subtype-specific therapy.Transl Oncol. 2025 Feb;52:102280. doi: 10.1016/j.tranon.2025.102280. Epub 2025 Jan 12. Transl Oncol. 2025. PMID: 39805182 Free PMC article.
-
Fabrication and Characterization of Electrospun DegraPol® Tubes Releasing TIMP-1 Protein to Modulate Tendon Healing.Materials (Basel). 2025 Feb 3;18(3):665. doi: 10.3390/ma18030665. Materials (Basel). 2025. PMID: 39942332 Free PMC article.
-
Multi-Omics Profiling Reveals Glycerolipid Metabolism-Associated Molecular Subtypes and Identifies ALDH2 as a Prognostic Biomarker in Pancreatic Cancer.Metabolites. 2025 Mar 18;15(3):207. doi: 10.3390/metabo15030207. Metabolites. 2025. PMID: 40137171 Free PMC article.
-
Single-cell RNA sequencing and immune microenvironment analysis reveal PLOD2-driven malignant transformation in cervical cancer.Front Immunol. 2025 Jan 7;15:1522655. doi: 10.3389/fimmu.2024.1522655. eCollection 2024. Front Immunol. 2025. PMID: 39840054 Free PMC article.
-
Mapping molecular landscapes in triple-negative breast cancer: insights from spatial transcriptomics.Naunyn Schmiedebergs Arch Pharmacol. 2025 Mar 22. doi: 10.1007/s00210-025-04057-3. Online ahead of print. Naunyn Schmiedebergs Arch Pharmacol. 2025. PMID: 40119898 Review.
References
-
- Liu J, Yuan Q, Ren J, Li Y, Zhang Y, Shang D. Single-cell sequencing and bulk RNA sequencing reveal a cell differentiation-related multigene panel to predict the prognosis and immunotherapy response of hepatocellular carcinoma. Chin Med J. (2023) 136:485–7. doi: 10.1097/CM9.0000000000002393 - DOI - PMC - PubMed
MeSH terms
Substances
LinkOut - more resources
Full Text Sources
Medical
Miscellaneous