. 2024 Sep 13:15:1447608.
doi: 10.3389/fimmu.2024.1447608. eCollection 2024.

Neutrophil-fibroblast crosstalk drives immunofibrosis in Crohn's disease through IFNα pathway

Affiliations

Neutrophil-fibroblast crosstalk drives immunofibrosis in Crohn's disease through IFNα pathway

Efstratios Gavriilidis et al. Front Immunol. .

Abstract

Introduction: Crohn's disease (CD) is characterized by chronic inflammation and intestinal fibrosis leading to lifelong complications. However, the disease pathogenesis remains elusive, and the therapeutic options are limited. Here, we investigated the interaction between neutrophils and intestinal fibroblasts in the development of CD immunofibrosis, a disease mechanism predisposing to inflammatory and fibrotic complications.

Methods: Peripheral neutrophils, enriched neutrophil extracellular traps (eNETs), serum, primary intestinal fibroblasts (PIFs) and intestinal biopsies from CD, ulcerative colitis (UC) patients, and healthy individuals (HI), were studied. Transcriptome analysis of neutrophils, multi-cytokine profiling and cell-based functional assays at mRNA/protein level were performed.

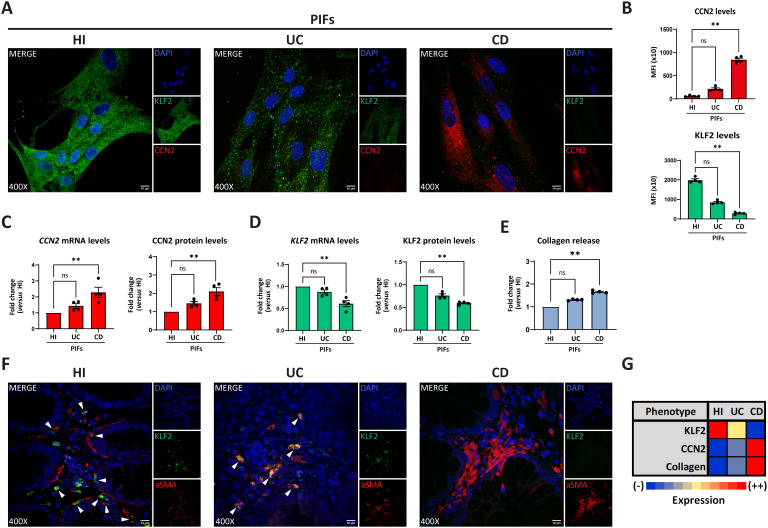
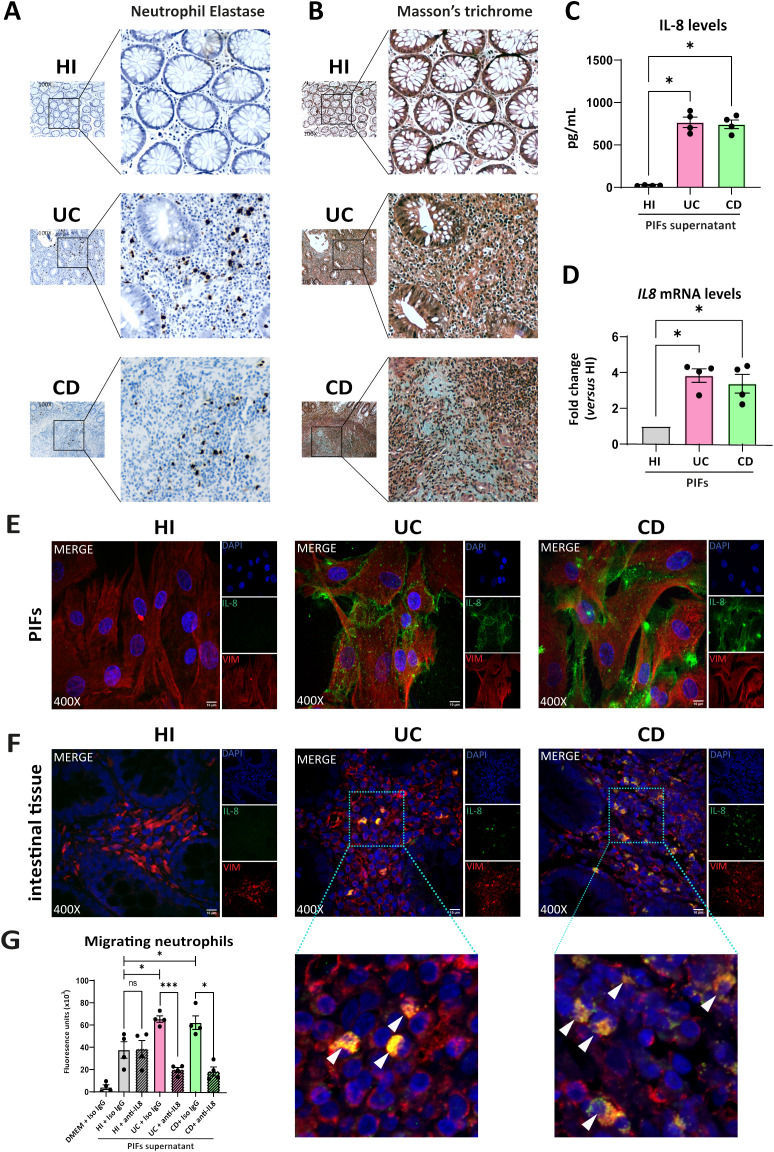
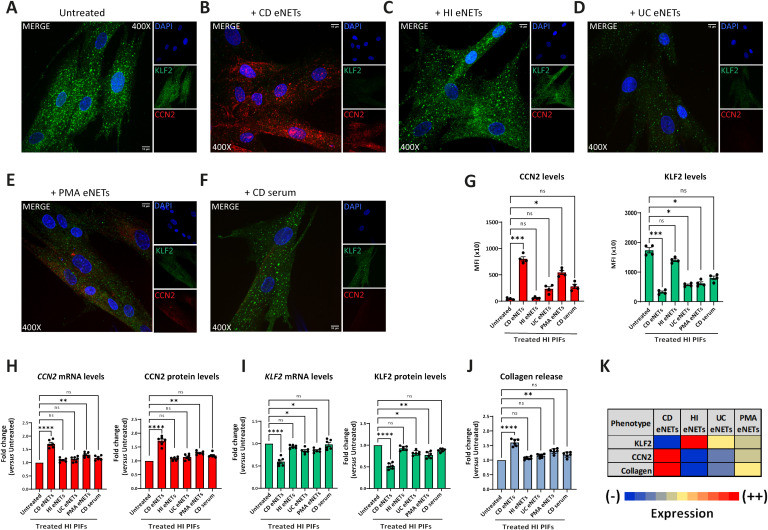
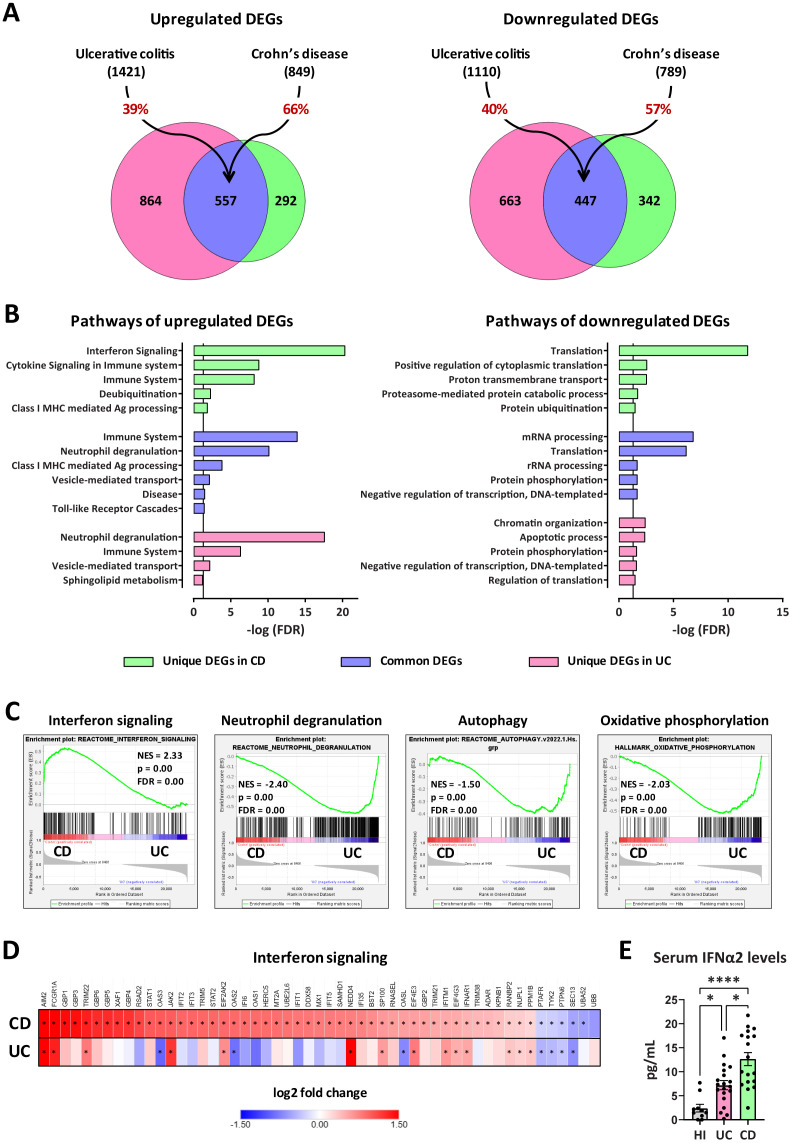
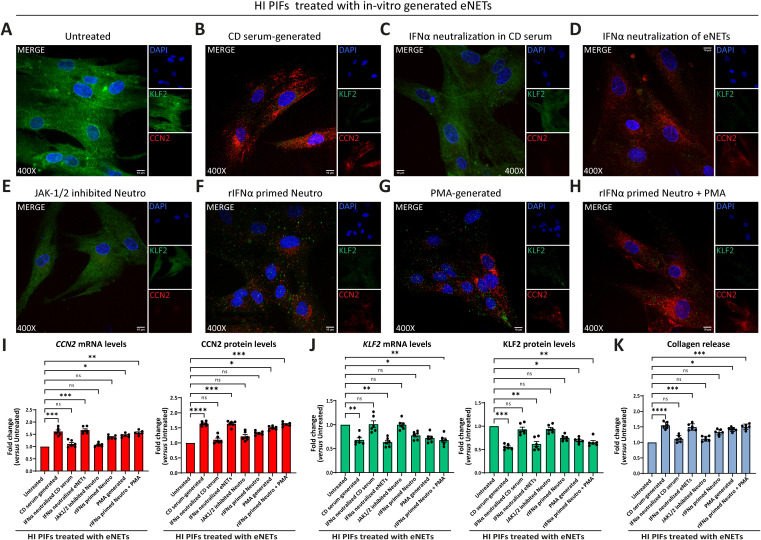
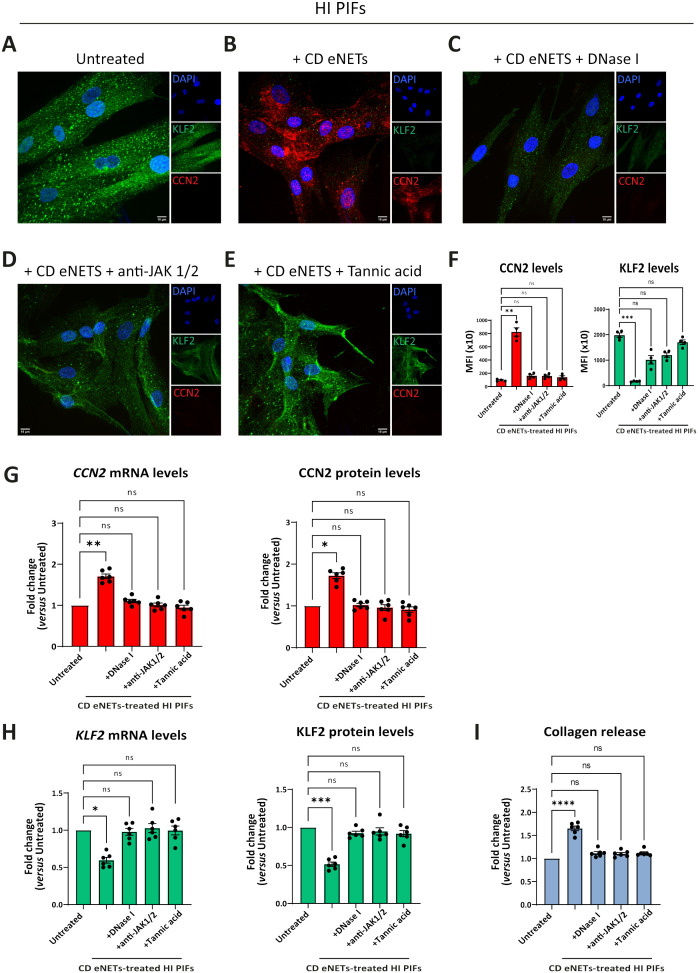
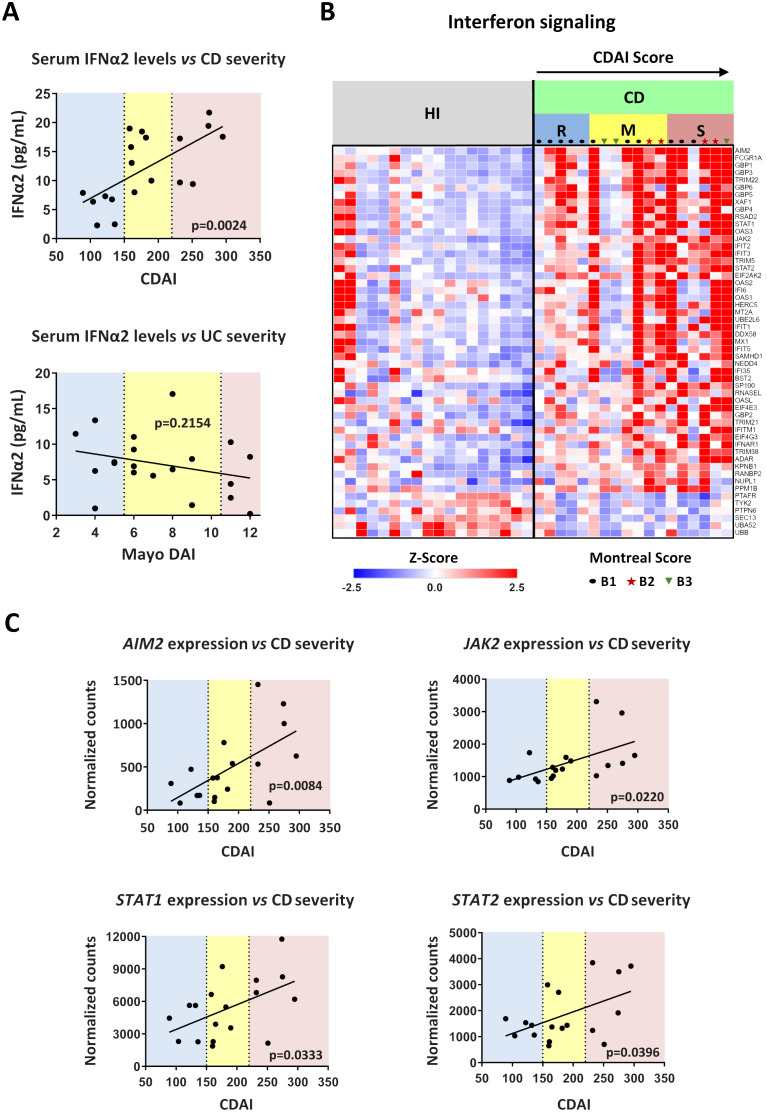
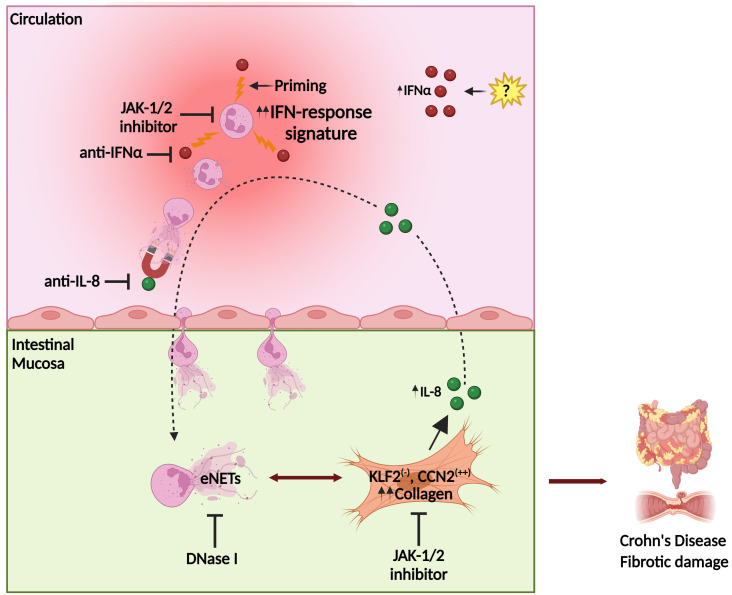
Results: Compared to UC, PIFs from CD patients, independently to the presence of strictures, displayed a distinct pro-fibrotic phenotype characterized by negative Krüppellike Factor-2 (KLF2) and increased cellular communication network factor-2 (CCN2) expression leading to collagen production. In both UC and CD, PIFs-derived IL-8 acted as a culprit chemoattractant for neutrophils in the intestine, where CD neutrophils were accumulated close to fibrotic lesions. Functionally, only CD neutrophils via eNETs induced a CD-like phenotype in HI PIFs, suggesting their fibrotic plasticity. High IFNa in serum and IFΝ-responsive signature in peripheral neutrophils were observed in CD, distinguishing it from UC. Moreover, CD serum stimulated the release of fibrogenic eNETs from neutrophils in an IFNa-dependent manner, suggesting the priming role of IFNa in circulating neutrophils. Inhibition of eNETs or JAK signaling in neutrophils or PIFs prevented the neutrophil-mediated fibrotic effect on PIFs. Furthermore, both serum IFNa levels and mRNA levels of key IFN signaling components in neutrophils were wellcorrelated with CD severity.

Conclusions: This study reveals the important role of the IFNa/neutrophil/fibroblast axis in CD immunofibrosis, suggesting candidate biomarkers and putative therapeutic targets.

Keywords: Crohn’s disease; IFNα; NETs; fibroblasts; immunofibrosis; neutrophils.


Conflict of interest statement

The authors declare that the research was conducted in the absence of any commercial or financial relationships that could be construed as a potential conflict of interest. The author(s) declared that they were an editorial board member of Frontiers, at the time of submission. This had no impact on the peer review process and the final decision.

Figures

Figure 1
Figure 1
Crohn’s disease intestinal fibroblasts exhibit a distinct fibrotic phenotype. Assessment of KLF2 and CCN2 expression in PIFs from IBD patients and HI by (A) immunostaining (blue: DAPI, green: KLF2, red: CCN2), and (B) corresponding MFI quantification. (C) CCN2 and (D) KLF2 mRNA and protein levels assessed by RT-qPCR and in-cell ELISA, respectively. (E) Collagen release was measured in supernatants collected from the above-mentioned PIFs. (F) KLF2 expression in myofibroblasts within intestinal biopsies obtained from the same patients (blue: DAPI, green: KLF2, red: aSMA). (G) Heatmap indicating the expression intensity of KLF2, CCN2 and collagen release in PIFs. (A, F) One representative example out of four independent experiments, performed in different subjects of each group, is shown. (F) White arrowheads show double positive KLF2/aSMA cells observed in HI and UC patients. Confocal microscopy. (A, F) Magnification: 400x, Scale Bar: 10μm. Nonparametric Kruskal-Wallis followed by Dunn’s multiple comparisons test was applied in all panels, n=4, **p<0.01, ns, not significant. Data are expressed as mean ± SEM. aSMA, alpha smooth muscle actin; CCN2, cellular communication network factor 2; CD, Crohn’s disease; HI, healthy individuals; IBD, inflammatory bowel disease; KLF2, Kruppel-like factor 2; MFI, mean fluorescence intensity; PIFs, primary intestinal fibroblasts; UC, ulcerative colitis.
Figure 2
Figure 2
UC and CD intestinal tissues are characterized by differential spatial distribution of neutrophils, attracted in the intestinal tissue by fibroblast-derived IL-8. (A) Neutrophil Elastase IHC staining (brown cells) and (B) Masson’s trichrome (cyan fibers) indicating the presence of neutrophils and fibrotic areas respectively, in serial cross sections obtained from the same intestinal biopsies. Thickness between the serial cross sections in (A, B) was 4 μm. (C) IL-8 levels in supernatants of PIFs measured by a bead-based flow cytometric assay. (D) IL-8 mRNA assessed by RT-qPCR and (E) IL-8 protein levels in PIFs immunostaining (blue: DAPI, green: IL-8, red: Vimentin). (F) IL-8 expression assessed by immunostaining in intestinal tissue fibroblasts (blue: DAPI, green: IL-8, red: Vimentin). Dotted frames indicate the zoomed-in areas, which are provided to assess the co-expression of IL-8 and Vimentin. White arrowheads show double positive IL-8/Vimentin cells observed in UC and CD patients. (G) Chemotactic capacity of the PIFs’ supernatant on HI neutrophils, before and after the neutralization of IL-8, assessed by a transwell migration assay. (A, B, E, F) One representative example out of four independent experiments, performed in different subjects of each group, is shown. (A, B) Optical microscopy, magnification: 100x, (E, F) Confocal microscopy, magnification: 400x, Scale Bar: 10μm. Nonparametric Kruskal-Wallis followed by Dunn’s multiple comparisons test was performed in (C, D), n=4, *p<0.05, ns, not significant. (G) Bayesian unpaired t-tests, followed by the Benjamini-Hochberg correction, were used to compare the migratory capacity of HI PIFs supernatants to UC and CD. For comparisons between PIFs supernatants that were treated with IL-8 neutralizing antibody (anti-IL-8), and supernatants treated with IgG isotype control (Iso IgG), Bayesian paired t-tests were performed, n=4, *p<0.05, ***p<0.001, ns, not significant. Data are expressed as mean ± SEM. CD, Crohn’s disease; DMEM, Dulbecco’s Modified Eagle Medium; HI, healthy individuals; IHC, immunohistochemistry; PIFs, primary intestinal fibroblasts; UC, ulcerative colitis;.
Figure 3
Figure 3
Treatment of healthy PIFs with ex-vivo isolated CD eNETs induces a CD-like fibrotic phenotype. (A–F) Immunostaining (blue: DAPI, green: KLF2, red: CCN2) and (G) corresponding MFI quantification of HI PIFs treated with ex-vivo isolated eNETs from (B) CD, (C) HI, or (D) UC patients, (E) PMA-generated eNETs and (F) CD serum. Assessment of CCN2 (H) and KLF2 (I) mRNA and protein levels by RT-qPCR and in-cell ELISA, respectively, as well as collagen release (J) in the treated PIFs. (K) Heatmap depicting the expression intensity of KLF2, CCN2 and collagen release. (A–F) One representative example out of four independent experiments is shown. Confocal microscopy. Magnification: 400x, Scale Bar: 10μm. (G–J) Nonparametric Kruskal-Wallis followed by Dunn’s multiple comparisons test, (G) n=4, (H–J) n=6, *p<0.05, **p<0.01, ***p<0.001, ****p<0.0001, ns, not significant. Data are expressed as mean ± SEM. CCN2, cellular communication network factor 2; CD, Crohn’s disease; eNETs, enriched neutrophil extracellular traps; HI, healthy individuals; KLF2, Kruppel-like factor 2; MFI, mean fluorescence intensity; PIFs, primary intestinal fibroblasts; PMA, Phorbol-12-myristate-13-acetate; UC, ulcerative colitis.
Figure 4
Figure 4
Transcriptomic analysis of peripheral blood neutrophils isolated from patients with CD or UC. (A) Venn diagrams showing upregulated and downregulated DEGs (baseMean > 30 and FDR < 0.05), following RNA-Seq analysis of peripheral blood neutrophils isolated from patients with CD (n=18) or UC (n=24). DEGs were identified following comparison with neutrophils isolated from healthy individuals (n=18). The percentages on the arrows indicate the overlap between the two diseases. (B) Graphs depicting the top upregulated and downregulated pathways in neutrophils isolated from CD or UC patients. Reactome and GO Biological Process annotations were used for up- and down-regulated DEGs, respectively. Pathways with redundant sets of DEGs were excluded. Vertical lines show the threshold for statistical significance (FDR < 0.05). (C) GSEA plots of significantly altered signatures in the transcriptome of CD versus UC neutrophils, using Reactome and Hallmark as reference gene sets from the Human Molecular Signatures Database. (D) Heatmap depicting the log2 fold change values of DEGs belonging to the Interferon signaling pathway (Reactome, R-HSA-913531.3), as determined by RNA-Seq analysis of CD and UC neutrophils. Asterisks depict statistical significance (FDR < 0.05). (E) Levels of IFNα2 in the serum of HI and patients with CD or UC. Data are expressed as mean ± SEM. Nonparametric Kruskal-Wallis test was applied, followed by Dunn’s multiple comparisons test, *p < 0.05, and ****p < 0.0001. CD, Crohn’s disease; DEGs, differentially expressed genes; FDR, false discovery rate; GSEA, gene set enrichment analysis; HI, healthy individuals; NES, normalized enrichment score; RNA-Seq, RNA-Sequencing; UC, ulcerative colitis.
Figure 5
Figure 5
CD neutrophils are primed through IFNα/JAK signaling to exert their fibrotic role. (A-H) Evaluation of CCN2 and KLF2 by immunofluorescence (blue: DAPI, green: KLF2, red: CCN2) in HI PIFs treated with in-vitro generated eNETs under various conditions: (A) HI neutrophils stimulated by CD serum to form eNETs in the (B) absence or (C) presence of an IFNα neutralizing antibody. (D) IFNα neutralization of already formed CD-serum eNETs. (E) Inhibition of JAK-1/2 signaling in neutrophils with baricitinib. (F) Neutrophils primed with IFNα to produce eNETs. (G) PMA-generated eNETs. (H) Combination of (F) and (G) to produce eNETs that subsequently treated HI PIFs. (I) CCN2 and (J) KLF2 mRNA and protein levels in eNETs-treated fibroblasts, as assessed by RT-qPCR and in-cell ELISA. (K) Corresponding collagen release assay. (A–H) One representative example out of four independent experiments is shown. Confocal microscopy. Magnification: 400x, Scale Bar: 10μm (I–K) Nonparametric Kruskal-Wallis followed by Dunn’s multiple comparisons test, n=6, *p<0.05, **p<0.01, ***p<0.001, ****p<0.0001, ns, not significant. Data are expressed as mean ± SEM. CCN2, cellular communication network factor 2; CD, Crohn’s disease; eNETs, enriched neutrophil extracellular traps; HI, healthy individuals; JAK, Janus kinase; KLF2, Kruppel-like factor 2; MFI, mean fluorescence intensity; Neutro, neutrophils; PIFs, primary intestinal fibroblasts; PMA, Phorbol-12-myristate-13-acetate; rIFNα, recombinant interferon alpha.
Figure 6
Figure 6
Disruption of NET-scaffold or inhibition of JAK-1/2 signaling in fibroblasts prevents neutrophil-mediated fibrosis. (A–E) Assessment of CCN2 and KLF2 by immunofluorescence (blue: DAPI, green: KLF2, red: CCN2) and (F) MFI quantification, in stimulation and inhibition studies. (A) HI PIFs, treated with (B) ex-vivo CD eNETs or (C) CD eNETs pre-treated with DNase I to dismantle the DNA-scaffold. (D) HI PIFs pre-treated with JAK-1/2 inhibitor baricitinib and subsequent stimulation with CD eNETs. (E) Tannic acid, a chemical inducer of KLF2, was used as a positive control of KLF2 expression. (G) Analysis of CCN2 and (H) KLF2 mRNA and protein expression, and (I) Collagen release assay, in PIFs from the abovementioned in-vitro studies. (A–E) One representative example out of four independent experiments is shown. Confocal microscopy. Magnification: 400x, Scale Bar: 10μm. (F-I) Nonparametric Kruskal-Wallis followed by Dunn’s multiple comparisons test, n=6, *p<0.05, **p<0.01, ***p<0.001, ****p<0.0001, ns, not significant. Data are expressed as mean ± SEM. CCN2, cellular communication network factor 2; CD, Crohn’s disease; eNETs, enriched neutrophil extracellular traps; HI, healthy individual; JAK, Janus kinase; KLF2, Kruppel-like factor 2; MFI, mean fluorescence intensity; STAT, signal transducer and activator of transcription.
Figure 7
Figure 7
Levels of interferon signaling components are positively correlated with Crohn’s disease severity. (A) Correlation plots of serum IFNα2 levels versus disease severity in CD (upper graph) and UC (lower graph). CDAI and Mayo DAI were used to assess disease activity in CD and UC, respectively. (B) Heatmap depicting the relative expression of DEGs belonging to the Interferon signaling pathway (Reactome, R-HSA-913531.3), as determined by RNA-Seq analysis of neutrophils isolated from HI (n=18) and CD patients (n=18). (C) Correlation plots of the mRNA expression of key interferon signaling components (AIM2, JAK2, STAT1, and STAT2), as determined by RNA-Seq analysis of CD neutrophils, versus disease severity in CD. Simple linear regression was used in all panels to assess the relationship between the studied variables. CD, Crohn’s disease; CDAI, Crohn’s disease activity index (R, remission, < 150; M, mild to moderate, 150-220; S, moderate to severe, > 220); Mayo DAI, Mayo score disease activity index (mild, 3-5; moderate, 6-10; severe, 11-12); Montreal score according to disease behavior: B1, non-stricturing, non-penetrating (n=11); B2, stricturing (inflammatory strictures, n=4); B3, penetrating (n=3); HI, healthy individuals; RNA-Seq, RNA-Sequencing; UC, ulcerative colitis.
Figure 8
Figure 8
Proposed model of Crohn’s disease immunofibrosis mediated by neutrophil-fibroblast crosstalk. Peripheral neutrophils are primed by IFNα, acquiring pro-fibrotic plasticity. Prone to NETosis-primed neutrophils are attracted by intestinal fibroblast-derived IL-8, migrating in the mucosa, where they stimulate fibroblasts through the production of NET-enriched extracellular mediators (eNETs), transforming them into a KLF2 (-), CCN2 (++) phenotype that releases collagen, leading to fibrotic complications. Stimulated fibroblasts further produce IL-8, which sustains the vicious immunofibrotic cycle of neutrophil-fibroblast interaction. Pharmaceutical agents targeting IFNα or IL-8, as well as JAK-1/2 signaling in both fibroblasts and neutrophils, may be promising therapeutic candidates against Crohn’s disease. CCN2, cellular communication network factor 2; eNETs, enriched neutrophil extracellular traps; IFNα, interferon alpha; JAK, Janus kinase; KLF2, Kruppel-like factor 2. Created with Biorender.com.

Similar articles

Cited by

References

    1. Torres J, Bonovas S, Doherty G, Kucharzik T, Gisbert JP, Raine T, et al. . ECCO guidelines on therapeutics in crohn’s disease: Medical treatment. J Crohns Colitis. (2020) 14:4–22. doi: 10.1093/ecco-jcc/jjz180 - DOI - PubMed
    1. Dehghan M, Wong G, Neuberger E, Kin C, Rieder F, Park KT. Worse outcomes and higher costs of care in fibrostenotic Crohn’s disease: a real-world propensity-matched analysis in the USA. BMJ Open Gastroenterol. (2021) 8:e000781. doi: 10.1136/bmjgast-2021-000781 - DOI - PMC - PubMed
    1. Lin X, Wang Y, Liu Z, Lin S, Tan J, He J, et al. . Intestinal strictures in Crohn’s disease: a 2021 update. Therap Adv Gastroenterol. (2022) 15:17562848221104951. doi: 10.1177/17562848221104951 - DOI - PMC - PubMed
    1. Andoh A, Nishida A. Molecular basis of intestinal fibrosis in inflammatory bowel disease. Inflammation Intest Dis. (2023) 7:119–27. doi: 10.1159/000528312 - DOI - PMC - PubMed
    1. Wigerblad G, Cao Q, Brooks S, Naz F, Gadkari M, Jiang K, et al. . Single-cell analysis reveals the range of transcriptional states of circulating human neutrophils. J Immunol. (2022) 209:772–82. doi: 10.4049/jimmunol.2200154 - DOI - PMC - PubMed

MeSH terms

Substances

LinkOut - more resources