

Integrating multi-omics and machine learning survival frameworks to build a prognostic model based on immune function and cell death patterns in a lung adenocarcinoma cohort
- PMID: 39346927
- PMCID: PMC11427295
- DOI: 10.3389/fimmu.2024.1460547
Integrating multi-omics and machine learning survival frameworks to build a prognostic model based on immune function and cell death patterns in a lung adenocarcinoma cohort
Abstract
Introduction: The programmed cell death (PCD) plays a key role in the development and progression of lung adenocarcinoma. In addition, immune-related genes also play a crucial role in cancer progression and patient prognosis. However, further studies are needed to investigate the prognostic significance of the interaction between immune-related genes and cell death in LUAD.
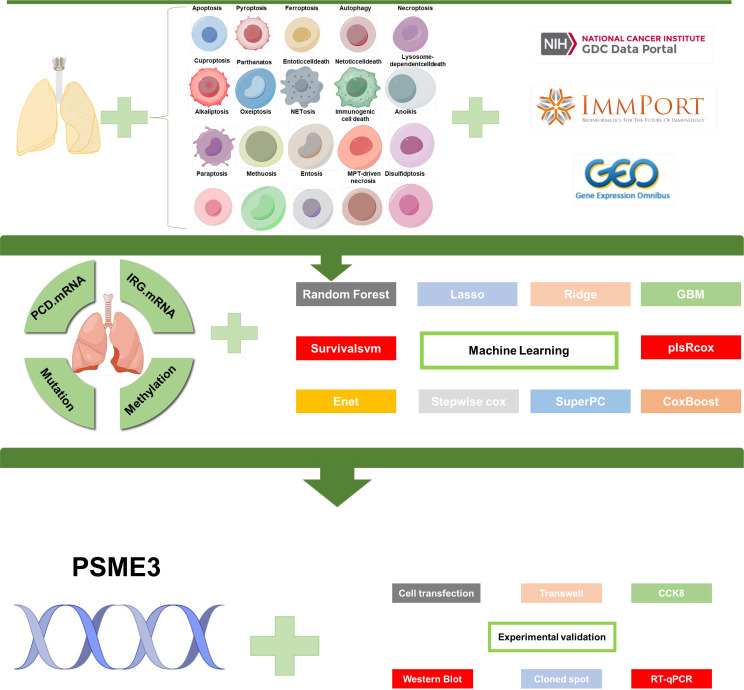
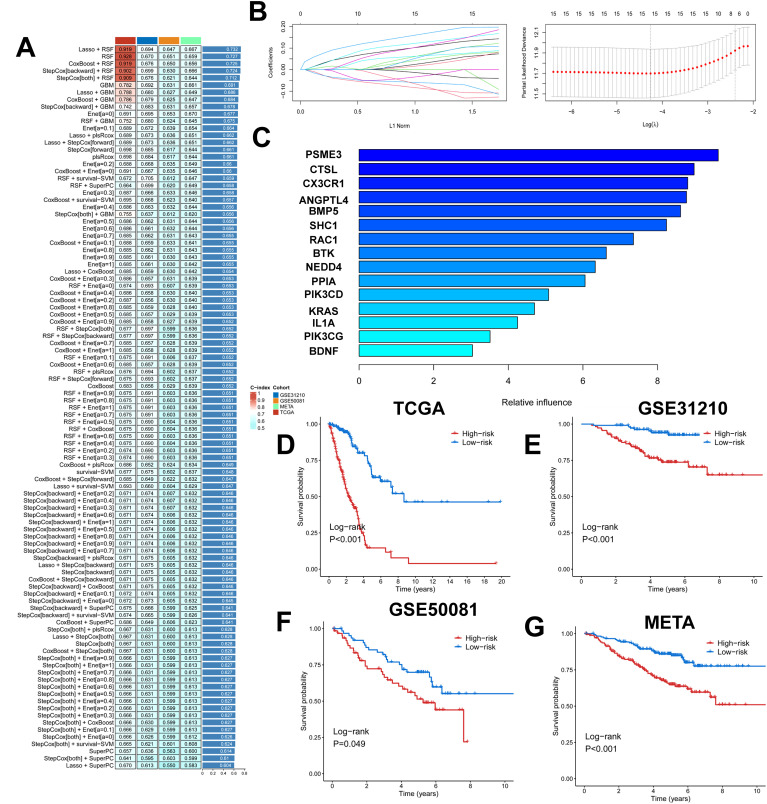
Methods: In this study, 10 clustering algorithms were applied to perform molecular typing based on cell death-related genes, immune-related genes, methylation data and somatic mutation data. And a powerful computational framework was used to investigate the relationship between immune genes and cell death patterns in LUAD patients. A total of 10 commonly used machine learning algorithms were collected and subsequently combined into 101 unique combinations, and we constructed an immune-associated programmed cell death model (PIGRS) using the machine learning model that exhibited the best performance. Finally, based on a series of in vitro experiments used to explore the role of PSME3 in LUAD.
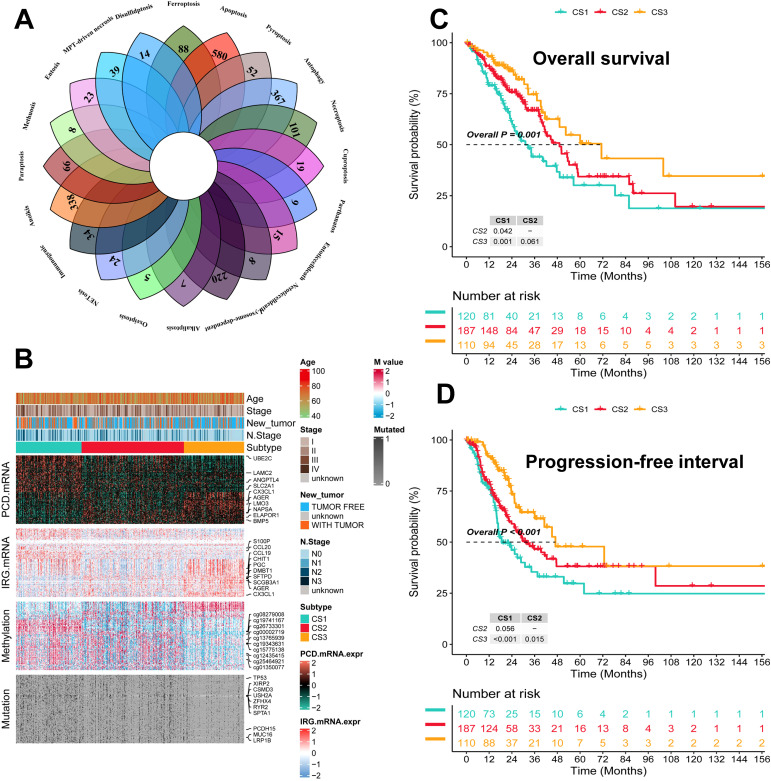
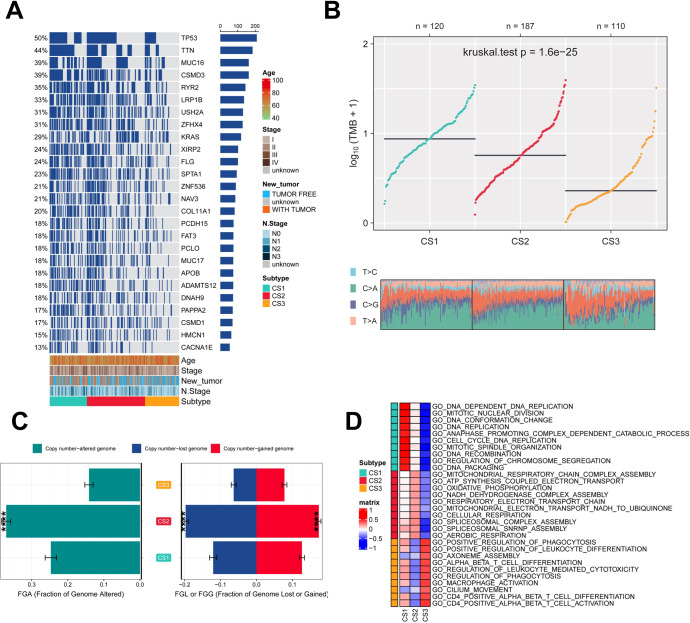
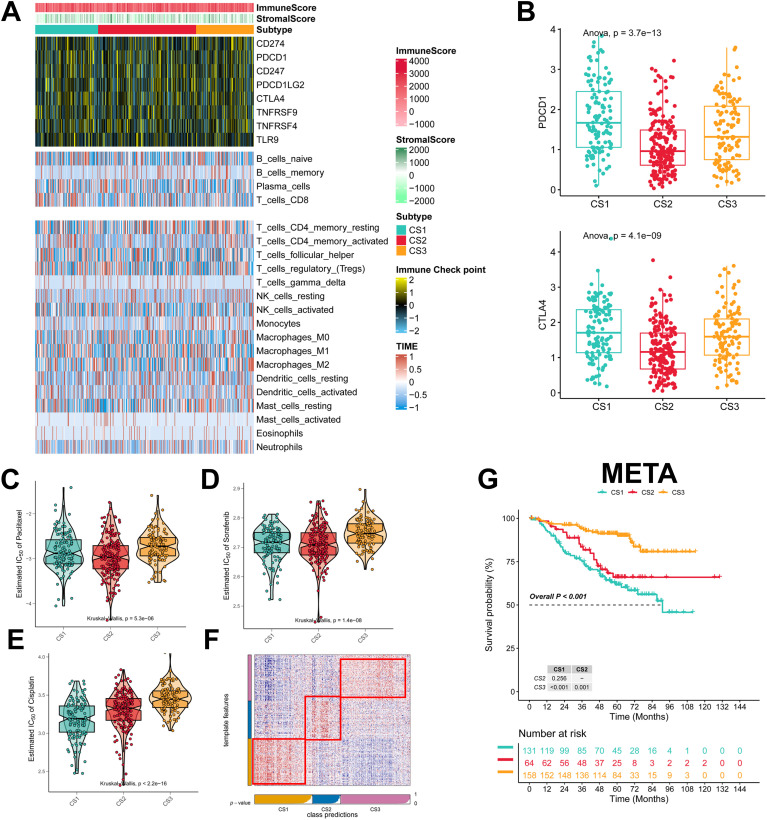
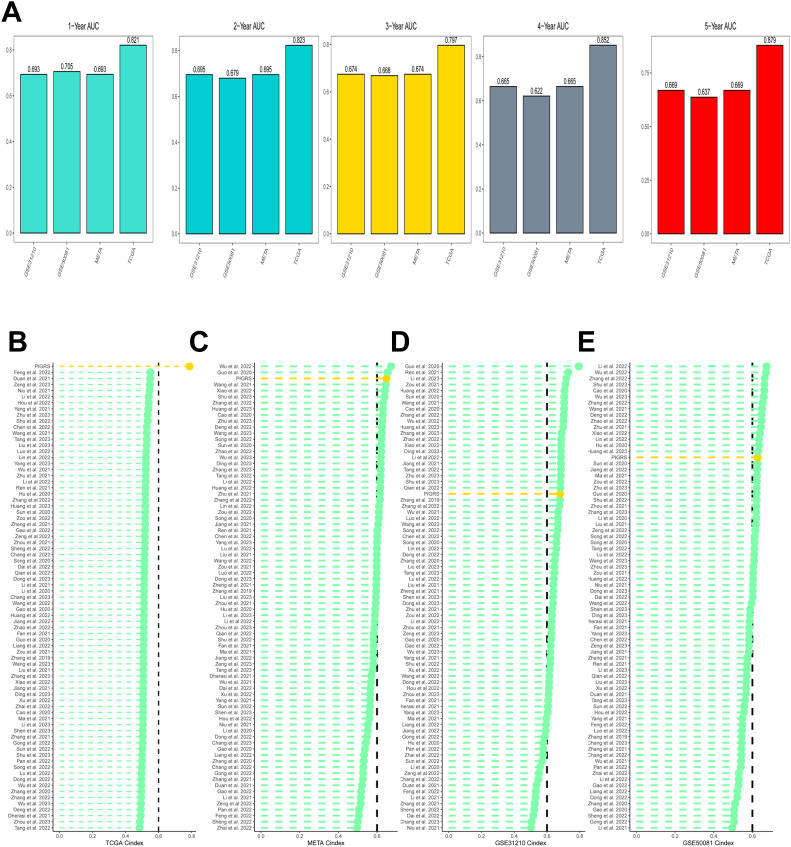
Results: We used 10 clustering algorithms and multi-omics data to categorize TCGA-LUAD patients into three subtypes. patients with the CS3 subtype had the best prognosis, whereas patients with the CS1 and CS2 subtypes had a poorer prognosis. PIGRS, a combination of 15 high-impact genes, showed strong prognostic performance for LUAD patients. PIGRS has a very strong prognostic efficacy compared to our collection. In conclusion, we found that PSME3 has been little studied in lung adenocarcinoma and may be a novel prognostic factor in lung adenocarcinoma.
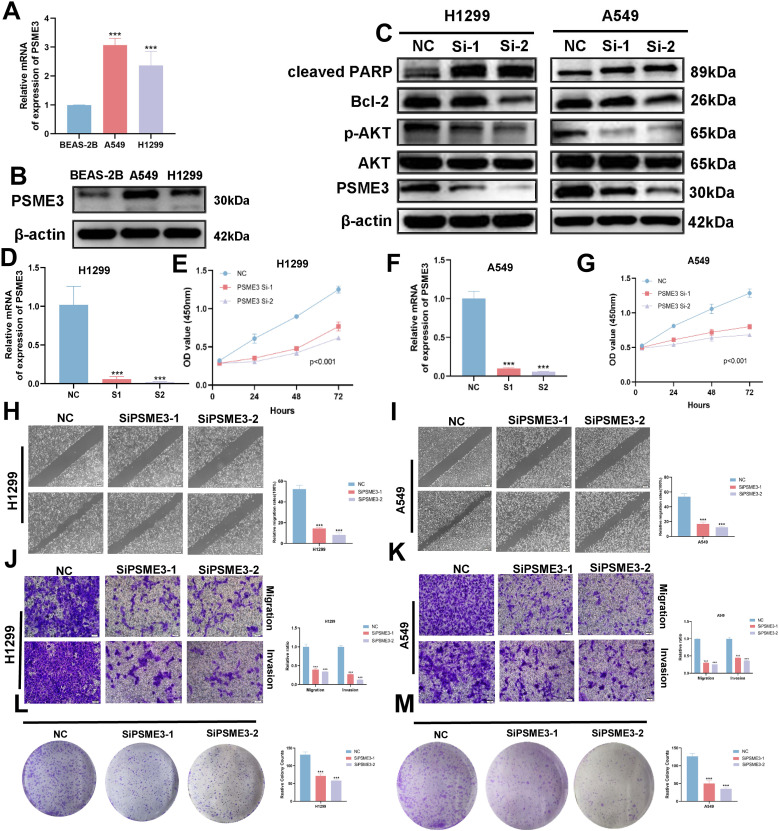
Discussion: Three LUAD subtypes with different molecular features and clinical significance were successfully identified by bioinformatic analysis, and PIGRS was constructed using a powerful machine learning framework. and investigated PSME3, which may affect apoptosis in lung adenocarcinoma cells through the PI3K/AKT/Bcl-2 signaling pathway.
Keywords: immunotherapy efficacy; lung adenocarcinoma; machine learning; precision medicine; programmed cell death.
Copyright © 2024 Xie, Chen, Tian, Wang, Wang, Zhang, Wang and Lian.
Conflict of interest statement
The authors declare that the research was conducted in the absence of any commercial or financial relationships that could be construed as a potential conflict of interest.
Figures
Similar articles
-
Multi-omics characterization and machine learning of lung adenocarcinoma molecular subtypes to guide precise chemotherapy and immunotherapy.Front Immunol. 2024 Nov 28;15:1497300. doi: 10.3389/fimmu.2024.1497300. eCollection 2024. Front Immunol. 2024. PMID: 39669580 Free PMC article.
-
Integrated multi-omics analysis and machine learning to refine molecular subtypes, prognosis, and immunotherapy in lung adenocarcinoma.Funct Integr Genomics. 2024 Jun 27;24(4):118. doi: 10.1007/s10142-024-01388-x. Funct Integr Genomics. 2024. PMID: 38935217
-
Advancing lung adenocarcinoma prognosis and immunotherapy prediction with a multi-omics consensus machine learning approach.J Cell Mol Med. 2024 Jul;28(13):e18520. doi: 10.1111/jcmm.18520. J Cell Mol Med. 2024. PMID: 38958523 Free PMC article.
-
Machine learning applications in breast cancer survival and therapeutic outcome prediction based on multi-omic analysis.Yi Chuan. 2024 Oct;46(10):820-832. doi: 10.16288/j.yczz.24-156. Yi Chuan. 2024. PMID: 39443311 Review.
-
Multiomic Investigations into Lung Health and Disease.Microorganisms. 2023 Aug 19;11(8):2116. doi: 10.3390/microorganisms11082116. Microorganisms. 2023. PMID: 37630676 Free PMC article. Review.
Cited by
-
Multiomic machine learning on lactylation for molecular typing and prognosis of lung adenocarcinoma.Sci Rep. 2025 Jan 24;15(1):3075. doi: 10.1038/s41598-025-87419-4. Sci Rep. 2025. PMID: 39856156 Free PMC article.
-
Toward precision oncology in LUAD: a prognostic model using single-cell sequencing and WGCNA based on a disulfidptosis relative gene signature.Front Immunol. 2025 May 21;16:1581915. doi: 10.3389/fimmu.2025.1581915. eCollection 2025. Front Immunol. 2025. PMID: 40469299 Free PMC article.
-
SUMOylation-related genes define prognostic subtypes in stomach adenocarcinoma: integrating single-cell analysis and machine learning analyses.Front Immunol. 2025 Aug 1;16:1527233. doi: 10.3389/fimmu.2025.1527233. eCollection 2025. Front Immunol. 2025. PMID: 40821814 Free PMC article.
-
ETV1 transcriptional manipulation of KIFC1 regulates the progression of pancreatic cancer.Oncol Res. 2025 Jun 26;33(7):1723-1737. doi: 10.32604/or.2025.059631. eCollection 2025. Oncol Res. 2025. PMID: 40612867 Free PMC article.
-
A novel mitochondrial quality regulation gene signature for anticipating prognosis, TME, and therapeutic response in LUAD by multi-omics analysis and experimental verification.Cancer Cell Int. 2025 Apr 10;25(1):138. doi: 10.1186/s12935-025-03764-4. Cancer Cell Int. 2025. PMID: 40211263 Free PMC article.
References
-
- Herbst R, Jassem J, Abogunrin S, James D, McCool R, Belleli R, et al. . A network meta-analysis of cancer immunotherapies versus chemotherapy for first-line treatment of patients with non-small cell lung cancer and high programmed death-ligand 1 expression. Front Oncol. (2021) 11:676732. doi: 10.3389/fonc.2021.676732 - DOI - PMC - PubMed
MeSH terms
Substances
LinkOut - more resources
Full Text Sources
Medical
Miscellaneous