. 2024 Jul 18;15(8):4749-4763.
doi: 10.1364/BOE.523202. eCollection 2024 Aug 1.

Polarization-resolved analysis of outer retinal bands: investigating ballistic and multiply scattered photons using full-field swept-source optical coherence tomography

Affiliations

Polarization-resolved analysis of outer retinal bands: investigating ballistic and multiply scattered photons using full-field swept-source optical coherence tomography

Shaiban Ahmed et al. Biomed Opt Express. .

Abstract

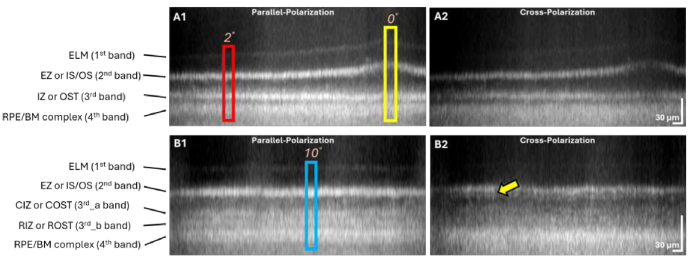
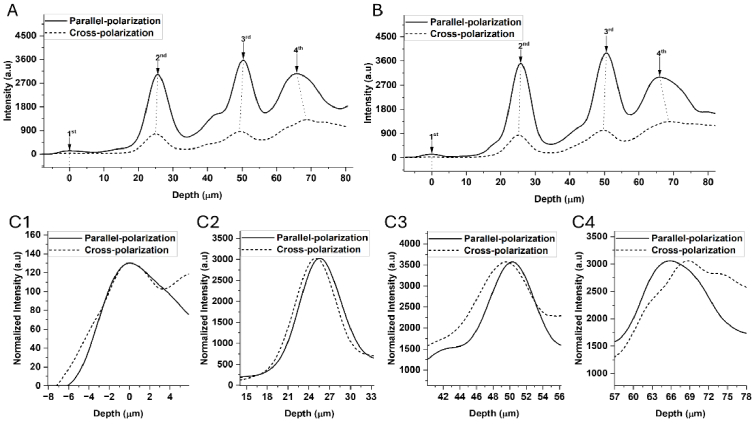
Precise interpretation of the anatomical origins of outer retinal optical coherence tomography (OCT) presents technical challenges owing to the delicate nature of the retina. To address this challenge, our study introduces a novel polarization-sensitive full-field swept-source OCT (FF-SS-OCT) that provides parallel-polarization and cross-polarization OCT measurements, predominantly capturing ballistically reflected photons and multiply scattered photons, respectively. Notably, parallel-polarization OCT unveils layer-like structures more effectively, including the inner plexiform layer (IPL) sub-layers, outer plexiform layer (OPL) sub-layers (in rod-dominant regions), and rod/cone outer segment (OS) tips, compared to cross-polarization OCT, where such sub-layers are not visible. Through a comparative analysis of parallel-polarization and cross-polarization OCT images of the outer retina, we discovered that the 2nd outer retinal OCT band results from contributions from both the ellipsoid zone (EZ) and the inner segment/outer segment (IS/OS) junction. Similarly, the 3rd outer retinal OCT band appears to reflect contributions from both the interdigitation zone (IZ) and photoreceptor OS tips. This polarization-sensitive approach advances our understanding of the origins of outer retinal OCT signals and proposes potential new biomarkers for assessing retinal health and diseases.


Conflict of interest statement

The authors declare that there are no conflicts of interest related to this article.

Figures

Fig. 1.
Fig. 1.
Schematic diagram of polarization-controlled FF-SS-OCT for retinal imaging. BS: Beam splitter; CL: Cylindrical lens; DM: Dichroic mirror; Leye: Eye lens; LP: Linear polarizer; L1-L9: Achromatic lens; QWP: Quarter-wave plate.
Fig. 2.
Fig. 2.
Retinal B-scans obtained from the polarization-controlled FF-SS-OCT system covering 0°, 2°, and 10° foveal eccentricities. Representative parallel (A1, B1) and cross-polarization (A2, B2) retinal OCT images illustrated in logarithmic scale. The two circles (s1 and s2) in Fig. 2(B1) demarcate the IPL and OPL sublayers visible in parallel-polarized OCT images. Such finer sub-layers were not distinguishable in cross-polarized OCT data (2B2). These B-scans were obtained from subject 1. NFL: Nerve Fiber Layer; GCL: Ganglion Cell Layer; IPL: Inner Plexiform Layer; INL: Inner Nuclear Layer; OPL: Outer Plexiform Layer; ONL: Outer Nuclear Layer; ELM: External Limiting Membrane; EZ: Ellipsoid Zone; IS: Inner segment; OS: Outer segment; IZ: Interdigitation Zone; OST: Outer Segment Tip; CIZ: Cone Interdigitation Zone; RIZ: Rod Interdigitation Zone; ROST: Rod Outer Segment Tip; COST: Cone Outer Segment Tip; RPE: Retinal Pigment Epithelium; BM: Bruch’s Membrane. Scale bars are 30 µm.
Fig. 3.
Fig. 3.
Magnified representative B-scans of the outer retina, obtained using parallel (A1, B1) and cross-polarization (A2, B2) OCT signals. The yellow arrowhead (3B2) demarcates the presence of a darker 2nd band sub-layer below a bright one for cross-polarized OCT B-scan. These B-scans were obtained from subject 1.; ELM: External Limiting Membrane; EZ: Ellipsoid Zone; IS: Inner segment; OS: Outer segment; IZ: Interdigitation Zone; OST: Outer Segment Tip; CIZ: Cone Interdigitation Zone; RIZ: Rod Interdigitation Zone; ROST: Rod Outer Segment Tip; COST: Cone Outer Segment Tip; RPE: Retinal Pigment Epithelium; BM: Bruch’s Membrane. Scale bars are 30 µm.
Fig. 4.
Fig. 4.
(A) Representative axial reflectance profiles obtained at 0° foveal eccentricity representing a cone-only region (demarcated by the yellow rectangle in Fig. 2(A1) and 3(A1)). (B) Representative reflectance profile from the repeated experiment obtained at the same location (C) Magnified images of the (C1) 1st (C2) 2nd (C3) 3rd and (C4) 4th outer retinal layers in Fig. 4(A). The reflectance profiles were obtained from the data recorded from subject 1.
Fig. 5.
Fig. 5.
(A) Representative axial reflectance profiles obtained at 2° foveal eccentricity representing a rod-cone region (demarcated by the red rectangle in Fig. 2(A1) and 3(A1)). (B) Representative reflectance profile from the repeated experiment obtained at the same location (C) Magnified images of the (C1) 1st (C2) 2nd (C3) 3rd and (C4) 4th outer retinal layers in Fig. 5(A). The reflectance profiles were obtained from the data recorded from subject 1.
Fig. 6.
Fig. 6.
(A) Representative axial reflectance profiles obtained at 10° foveal eccentricity representing a rod-dominant region (demarcated by the blue rectangle in Fig. 2(B1) and 3(B1)). (B) (B) Representative reflectance profile from the repeated experiment obtained at the same location (C) Magnified images of the (C1) 1st (C2) 2nd (C3) 3rd_a (C4) 3rd_b and (C5) 4th outer retinal layers in Fig. 6(A). The reflectance profiles were obtained from the data recorded from subject 1.
Fig. 7.
Fig. 7.
Mean and standard error of cross to parallel-polarization peak intensity ratio of outer retinal layers obtained at (A1) Cone-only (0° foveal eccentricity) (A2) Rod-cone (2° foveal eccentricity) and (A3) Rod-dominant region (10° foveal eccentricity).

Update of

  • doi: 10.1364/opticaopen.25345894.

Similar articles

Cited by

References

    1. Huang D., Swanson E. A., Lin C. P., et al. , “Optical coherence tomography,” Science 254(5035), 1178–1181 (1991).10.1126/science.1957169 - DOI - PMC - PubMed
    1. Swanson E. A., Izatt J. A., Hee M. R., et al. , “In vivo retinal imaging by optical coherence tomography,” Opt. Lett. 18(21), 1864–1866 (1993).10.1364/OL.18.001864 - DOI - PubMed
    1. Fujimoto J. G. J. N. b., “Optical coherence tomography for ultrahigh resolution in vivo imaging,” Nat. Biotechnol. 21(11), 1361–1367 (2003).10.1038/nbt892 - DOI - PubMed
    1. Fujimoto J. G., Pitris C., Boppart S. A., et al. , “Optical coherence tomography: an emerging technology for biomedical imaging and optical biopsy,” Neoplasia 2(1-2), 9–25 (2000).10.1038/sj.neo.7900071 - DOI - PMC - PubMed
    1. Fleckenstein M., Issa P. C., Helb H.-M., et al. , “High-resolution spectral domain-OCT imaging in geographic atrophy associated with age-related macular degeneration,” Invest. Ophthalmol. Vis. Sci. 49(9), 4137–4144 (2008).10.1167/iovs.08-1967 - DOI - PubMed

LinkOut - more resources