Postoperative Gait Performance Following Pertrochanteric Fractures Is Influenced by the Preoperative Condition of the Gluteal Muscles
- PMID: 39347225
- PMCID: PMC11439158
- DOI: 10.7759/cureus.68176
Postoperative Gait Performance Following Pertrochanteric Fractures Is Influenced by the Preoperative Condition of the Gluteal Muscles
Abstract
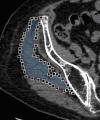
Introduction Amid an increasing number of patients with pertrochanteric fractures, early prediction of postoperative gait potential could reduce unnecessary rehabilitation and hospitalization. The relationship between preoperative gluteal muscle condition and postoperative gait outcomes remains unclear. The gluteal muscles are crucial for mobility, and their cross-sectional area (CSA) and fatty infiltration are indicators of physical function. Preoperative computed tomography (CT) provides quantitative data on muscle CSA and density, measured in Hounsfield Units (HU). This study aimed to identify which preoperative muscle index, CSA, BMI-adjusted CSA, or muscle density, best predicts postoperative gait ability. We hypothesized that a higher adjusted CSA and muscle density in the gluteus muscles would be associated with superior gait performance. Materials and methods Preoperative assessments included radiographs and CT scans. Patients under 75, with less than four weeks of follow-up, prior contralateral hip surgery, prefracture immobility, male patients, high-energy trauma, or conditions impairing physical performance were excluded. Gait performance was evaluated four weeks postoperatively, classifying patients into two groups: the 'parallel bar group,' requiring parallel bars, and the 'walker group,' walking independently. Patients underwent CM nailing. Preoperative CT scans measured the CSA and muscle density of the gluteus maximus and medius. Measurements were taken from the non-injured side to avoid interference from the fracture. Muscle borders were manually traced, and the CSA and muscle density in HU were calculated. Results Out of 81 patients, 49 met the inclusion criteria (mean age: 87). The patients were divided into the 'parallel bar group' (n=19) and the 'walker group' (n=30) based on postoperative gait performance. No significant differences in age, weight, height, or fracture laterality were observed between groups. The mean (and standard deviation (SD)) of CSA for the gluteus maximus in the 'parallel bar group'/in the 'walker group' was 2211.8 ± 469.8 mm²/2440.0 ± 586.2 mm², respectively (p=0.15), and for the gluteus medius, it was 1751.7 ± 415.2mm²/1869.1 ± 448.3mm², respectively (p=0.36). The mean (and SD) muscle density for the gluteus maximus in the 'parallel bar group'/in the 'walker group' was 13.6 ± 12.7 HU / 20.6 ± 13.0 HU (p=0.07), and for the gluteus medius, it was 25.2 ± 8.4 HU/31.8 ± 10.1 HU, respectively (p=0.02). The ROC curve identified a 30.9 HU cut-off for gluteus medius density, with sensitivity and specificity of 60.7% and 78.9%. The mean (and SD) of BMI-adjusted CSA for the gluteus maximus in the 'parallel bar group'/ in the 'walker group' was 116.4 ± 26.8 m²/106 kg/124.3 ± 29.2 m²/106 kg, respectively (p=0.35), and for the gluteus medius, it was 93.3 ± 27.2 m²/106 kg/95.4 ± 21.3m²/106kg, respectively (p=0.78). Conclusion This study analyzed preoperative CT images of women aged 75 and older with pertrochanteric fractures, comparing gluteal muscle CSA and density with postoperative walking ability. The gluteus medius density was significantly higher in the superior gait group, with a cut-off value of 30.9 HU. However, no significant differences were found in the gluteus maximus density, CSA, or BMI-adjusted CSA. These findings partially support the hypothesis, emphasizing the importance of muscle evaluation in predicting postoperative gait performance.
Keywords: body mass index: bmi; computed tomography; cross-sectional area; density; gait; gluteal muscles; gluteus medius; pertrochanteric fractures; postoperative.
Copyright © 2024, Noda et al.
Conflict of interest statement
Human subjects: Consent was obtained or waived by all participants in this study. The Nishi Hospital Ethics Committee issued approval 2021-1. Animal subjects: All authors have confirmed that this study did not involve animal subjects or tissue. Conflicts of interest: In compliance with the ICMJE uniform disclosure form, all authors declare the following: Payment/services info: All authors have declared that no financial support was received from any organization for the submitted work. Financial relationships: All authors have declared that they have no financial relationships at present or within the previous three years with any organizations that might have an interest in the submitted work. Other relationships: All authors have declared that there are no other relationships or activities that could appear to have influenced the submitted work.
Figures


References
LinkOut - more resources
Full Text Sources
Miscellaneous
