. 2024 Nov 1;31(Pt 6):1489-1504.
doi: 10.1107/S1600577524008336. Epub 2024 Sep 30.

Coprecipitation of Ce(III) oxide with UO2

Affiliations

Coprecipitation of Ce(III) oxide with UO2

M Saleh et al. J Synchrotron Radiat. .

Abstract

The neutralization of acidic solutions containing U (IV) and Ce (III) at room temperature in glove box atmosphere and in the presence of dithionite results in coprecipitation of these elements as amorphous solid solutions CexU1-xO2±y. The solubilities of the precipitates with different mole fractions (x) of Ce(OH)3 (x = 0.01 or 0.1) were determined in 1 M NaClO4 solutions between pH 2.2 and 12.8 under reducing conditions. The solids were investigated by a variety of methods (chemical analysis, SEM-EDX, XRD, XPS, XAS) to determine the nature of the solid solutions formed, their composition and the valence state of Ce and U. X-ray photoelectron spectroscopy confirmed the oxidation states of the solids both before and after the equilibration as Ce (III) and U (IV). The amorphous coprecipitates reached equilibrium relatively fast (∼1 week). The release of Ce from the coprecipitates was totally dominated by the release of uranium over the whole pH range. The Ce concentrations decrease slightly with the decrease of Ce content in the solid, suggesting that CexU1-xO2±y solids behave thermodynamically as solid solutions. The concentrations of U in equilibrium with the coprecipitate were in excellent agreement with the solubility of UO2(s) under reducing conditions reported in the literature. The conditional solubility product of Ce(OH)3 from the coprecipitate was several orders of magnitude (∼4 in the near neutral pH range and ∼18 in the acidic range) lower than that of pure Ce(OH)3(s). The activities and activity coefficients of Ce(OH)3(s) in the coprecipitate were also estimated. Activity coefficients are much less than 1, indicating that the mixing of Ce(OH)3 with UO2 is highly favorable.

Keywords: Ce (III); UO2; actinides; amorphous; coprecipitation; solid solution; solubility.


Conflict of interest statement

The authors declare that they have no known competing financial interests or personal relationships that could have appeared to influence the work reported in this paper.

Figures

Figure 1
Figure 1
UV-visible spectrophotometric analysis of U stock solution.
Figure 2
Figure 2
(a) Evolution of U and Ce total concentrations during 30 days equilibration for all pH values investigated for the solid with 1% Ce. (b) Evolution of U and Ce concentrations during 30 days equilibration for two randomly selected samples at −log[H+] values of 2.99 and 8.18. The dotted lines are horizontal and centered at the value of the last point.
Figure 3
Figure 3
SEM micrograph of (Ce0.1U0.9)Ox solid (center) and SEM-EDX U mapping (left) and Ce mapping (right) of the same area. Analysis made before equilibration.
Figure 4
Figure 4
SEM-EDX spectrum of the Ce0.1U0.9 solid. Solid after equilibration; S originates from di­thio­nite.
Figure 5
Figure 5
SEM micrograph of (Ce0.1U0.9)Ox solid (center) and SEM-EDX U mapping (left) and Ce mapping (right) of the same area. Analysis made after equilibration.
Figure 6
Figure 6
XRD spectra of the Ce0.10U0.90 solid before (upper) and after (lower) equilibration.
Figure 7
Figure 7
U–Ce equilibrated solid heated at 900°C under reducing conditions. The upper spectrum is for Ce0.10U0.90 while the lower spectrum is for Ce0.01U0.99.
Figure 8
Figure 8
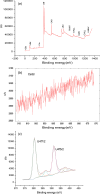
Survey XPS spectrum of the as-received Ce0.01U0.99 sample. (b) High resolution XPS scans in the Ce 3d region for the Ce0.01U0.99 solid. (c) High resolution XPS scans in the U 4f region for the Ce0.01U0.99 solid.
Figure 9
Figure 9
(a). Survey XPS spectrum of the as-received Ce0.10U0.90 sample. (b) High resolution XPS scans in the Ce 3d for the Ce0.10U0.90 solid. (c). High resolution XPS scans in the U 4f region for the Ce0.10U0.90 solid.
Figure 10
Figure 10
Normalized raw XANES spectra of cerium (III) oxide, Ce2O3 (light blue line) and cerium (IV) oxide, CeO2 (brown line). Raw data, not normalized, of U0.90Ce0.10 at two different spots (yellow and gray lines) show that cerium is present as cerium (III) in the studied samples.
Figure 11
Figure 11
Normalized raw XANES spectra of uranium (IV) oxide, UO2 (light blue line), and the studied uranium samples, ‘sample UO2_pure_1’ (red line), ‘sample UO2_pure_2’ (green line), ‘sample U0.99Ce0.01’ (purple line) and ‘sample U0.90Ce0.10’ (yellow line). Note that samples ‘UO2_pure_1’, ‘UO2_pure_2’, ‘U0.99Ce 0.01’ and ‘U0.90Ce0.10’ all consist of uranium (VI) oxide.
Figure 12
Figure 12
Close up of Fig. 11 ▸ at the white line peak region
Figure 13
Figure 13
UV-vis analysis of the MAX IV laboratory samples after dissolution in HClO4 (top; left Ce0.01U0.99, right Ce0.10U0.90) compared with spectra of pure U (VI) and U (IV) in the same solvent (bottom).
Figure 14
Figure 14
Concentrations of U in equilibrium with the Ce0.01U0.99 solid solution at 30 days. The dotted line with slope −3 is from Fig. 5 of Rai et al. (1997 ▸), while the horizontal dotted lines indicate log[U] = −8.5 ± 1. The data of Rai et al. (1997 ▸) are for equilibration times 8–420 days.
Figure 15
Figure 15
Concentrations of Ce and U in equilibrium with Ce0.01U0.99 oxide coprecipitate compared with concentrations of Ce in equilibrium with Ce(OH)3(s) (Kragten & Decnop-Weever, 1978 ▸) at 1 M NaClO4.
Figure 16
Figure 16
Concentrations of Ce and U in equilibrium with Ce0.10U0.90 oxide coprecipitate. The dotted lines in the basic range indicate the solubility of UO2(s), log[U] = −8.5, and the horizontal part of Ce concentrations for the pure oxide and the coprecipitate.

References

    1. Allen, P. G., Shuh, D. K., Bucher, J. J., Edelstein, N. M., Palmer, C. E. A. & Marquez, L. N. (1996). EXAFS Spectroscopic Study of Uranium (VI) Precipitates, Report LBNL-39934. Ernest Orlando Lawrence Berkeley National Laboratory, CA USA.
    1. Arab-Chapelet, B., De Bruycker, F., Picart, S., Leturcq, G. & Grandjean, S. (2008). Proceedings of ATALANTE 2008: Nuclear Fuel Cycles for a Sustainable Future, 19–23 May 2008, Montpellier, France. Paper 3,02.
    1. Baes, C. F. & Mesmer, R. E. (1976). The Hydrolysis of Cations. New York: Wiley.
    1. Bernkopf, M. F. (1984). Hydrolysereaktionen und karbonatkomplexierung von dreiwertigem americium im Natürlichen aquatischen systemen. Thesis. Technische Universität München, Germany.
    1. Broczkowski, M., Noël, J. & Shoesmith, D. (2005). J. Nucl. Mater.346, 16–23.

LinkOut - more resources