. 2024 Oct 7;221(10):e20230420.
doi: 10.1084/jem.20230420. Epub 2024 Sep 30.

An iron-rich subset of macrophages promotes tumor growth through a Bach1-Ednrb axis

Affiliations

An iron-rich subset of macrophages promotes tumor growth through a Bach1-Ednrb axis

Ian W Folkert et al. J Exp Med. .

Abstract

We define a subset of macrophages in the tumor microenvironment characterized by high intracellular iron and enrichment of heme and iron metabolism genes. These iron-rich tumor-associated macrophages (iTAMs) supported angiogenesis and immunosuppression in the tumor microenvironment and were conserved between mice and humans. iTAMs comprise two additional subsets based on gene expression profile and location-perivascular (pviTAM) and stromal (stiTAM). We identified the endothelin receptor type B (Ednrb) as a specific marker of iTAMs and found myeloid-specific deletion of Ednrb to reduce tumor growth and vascular density. Further studies identified the transcription factor Bach1 as a repressor of the iTAM transcriptional program, including Ednrb expression. Heme is a known inhibitor of Bach1, and, correspondingly, heme exposure induced Ednrb and iTAM signature genes in macrophages. Thus, iTAMs are a distinct macrophage subset regulated by the transcription factor Bach1 and characterized by Ednrb-mediated immunosuppressive and angiogenic functions.


Conflict of interest statement

Disclosures: K. Rai reported personal fees from Daiichi Sankyo, other from Jivanu Therapeutics, and other from Koshika Therapeutics outside the submitted work. No other disclosures were reported.

Figures

Figure 1.
Figure 1.
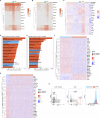
scRNA-seq identifies TAM subsets enriched for heme metabolism. (A) UMAP of CD45+ immune cells sorted from murine FS tumors and profiled using scRNA-seq (murine FS scRNA-seq dataset, n = 2 mice). Cells from the two replicates were combined prior to sequencing, yielding one sequencing dataset. Numbers represent distinct clusters. (B) UMAP of the murine FS scRNA-seq dataset showing cell-type annotation using the SingleR package with the ImmGen database as a reference for cell-type-specific gene expression signature. (C) Boxplot of Hmox1 expression showing highest expression in two TAM clusters—6 and 12. (D) UMAP expression plots of selected top marker genes for clusters 6 and 12 in FS tumors. Clusters with the highest levels of expression of the indicated genes are encircled. Hmox1: Heme oxygenase 1. Fth1: Ferritin heavy polypeptide 1. Ftl1: Ferritin light polypeptide 1. Cd36. Mmp12: Matrix metallopeptidase 12. Slc48a1: Solute carrier family 48, member 1. Lyve1: Lymphatic vessel endothelial hyaluronan receptor 1. Ednrb: Endothelin receptor type B. Cd163: Cluster of differentiation 163. (E) GSEA of clusters 6 and 12 relative to all other clusters in the murine FS scRNA-seq dataset with normalized enrichment scores of the top 20 Hallmark gene sets from the Molecular Signatures Database (MSigDB). Pathways related to heme metabolism are highlighted in red. (F) UMAP of CD45+ immune cells sorted from a murine model of SS and profiled using scRNA-seq (murine SS scRNA-seq dataset, n = 1 tumor). Cell types are annotated using the SingleR package with the ImmGen database as a reference for cell-type-specific gene expression signatures. (G) UMAP expression plots of selected top marker genes for clusters 6 and 12 in FS tumors within the murine SS scRNA-seq dataset. Clusters with the highest levels of expression are encircled. (H) UMAP of CD45+ immune cells sorted from a murine model of UPS and profiled using scRNA-seq (murine UPS scRNA-seq dataset, n = 1 tumor). Cell types are annotated using the SingleR package with the ImmGen database as a reference for cell-type-specific gene expression signatures. (I) UMAP expression plots of selected top marker genes for clusters 6 and 12 in FS tumors within the murine UPS scRNA-seq dataset. Clusters with the highest levels of expression are encircled. NK: Natural Killer Cells. ILC: Innate Lymphoid Cells. DC: Dendritic Cells.
Figure S1.
Figure S1.
TAM subsets enriched for heme metabolism. (A) UMAP expression plots of marker genes specific to major leukocyte and stromal cell types in the murine FS scRNA-seq dataset. (B) Heatmap of SingleR scores for each cluster in the murine FS scRNA-seq dataset, using the ImmGen database as a reference for cell-type-specific gene expression signature. (C) UMAP expression plots of marker genes specific to major leukocyte and stromal cell types in the murine SS scRNA-seq dataset. (D) GSEA of clusters 0 and 2 (iTAMs, corresponding to encircled cells in Fig. 1 G) relative to all other clusters in the murine SS scRNA-seq dataset, with normalized enrichment scores of the top 20 Hallmark gene sets from the MSigDB shown. Gene sets related to heme metabolism are highlighted in red. (E) UMAP expression plots of marker genes specific to major leukocyte and stromal cell types in the murine UPS scRNA-seq dataset. (F) GSEA of clusters 0 and 2 (iTAMs, corresponding to encircled cells in Fig. 1 I) relative to all other clusters in the murine UPS scRNA-seq dataset, with normalized enrichment scores of the top 20 Hallmark gene sets from the MSigDB shown. Gene sets related to heme metabolism are highlighted in red.
Figure 2.
Figure 2.
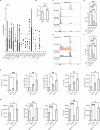
iTAMs are characterized by high intracellular iron. (A) Schematic for iron fractionation and iTAM enrichment. Tumors are digested into singlecell suspensions and directly passed over a magnetic column (Miltenyi). Iron-negative cells pass through the column, while iron-positive cells are bound and subsequently eluted. To further enrich for TAMs, both the iron-positive and iron-negative fractions are incubated with anti-F4/80 magnetic beads and passed over a second fresh column. (B) Iron quantification (Abcam) of iron-negative and iron-positive TAMs after enrichment from FS tumors as described in A (n = 3 mice per group). Approximately 4.4 × 10⁶ cells were used to measure iron in the flow-through and eluate fractions. Representative of three independent experiments. (C) Prussian blue staining for intracellular iron performed on cytospin preparations of iron fractionated TAMs (as described in A) from murine FS tumors. (D) The left panel shows UMAP with annotated cell types of iron-negative (flow-through, n = 2 mice) and iron-positive (eluate, n = 2 mice) TAMs isolated using the workflow depicted in A and profiled using scRNA-seq (iron fractionated TAM scRNA-seq dataset). Replicates within each group were combined prior to sequencing, yielding one iron-negative and one iron-positive sample. Cell types are annotated using the SingleR package with the ImmGen database as a reference for cell-type-specific gene expression signature. The right panel shows UMAP expression plots of genes involved in heme and iron metabolism (Hmox1, Slc40a1, Cd163, Ftl1) in the iron fractionated TAM scRNA-seq dataset. Macrophage clusters with the highest levels of expression of these genes are encircled. (E) Density plots of iron-negative and iron-positive samples from the iron fractionated TAM scRNA-seq dataset. Macrophage clusters corresponding to iTAMs are encircled and show increased numbers of iTAMs in the iron-positive fraction. (F) Bar plot showing the percent contribution from each cluster in the iron-negative and iron-positive samples from the iron fractionated TAM scRNA-seq dataset. iTAM1 and iTAM2 correspond to the two distinct clusters of iTAMs seen in the murine FS scRNA-seq dataset. (G) Expression of genes involved in heme and iron metabolism (Hmox1, Cd163, Cd36, Slc40a1, Fth1, and Ftl1) in the iron-negative and iron-positive samples in the iron fractionated TAM scRNA-seq dataset. (H) FCM plots (left) and frequencies (right) of CD163+ TAMs (CD45+CD11b+F4/80high) in iron-negative (left FCS plot) and iron-positive (right FCS plot) TAMs fractionated from FS tumors. Pregated on live singlets, CD45+, Ly6G, CD11b+, and F4/80high (n = 5 mice). Representative of ≥3 independent experiments. (I) FCM plots (left) and frequencies (right) of CD36+ TAMs (CD45+CD11b+F4/80high) in iron-negative (left FCS plot) and iron-positive (right FCS plot) TAMs fractionated from FS tumors. Pregated on live singlets, CD45+, Ly6G, CD11b+, and F4/80high (n = 5 mice). Representative of ≥3 independent experiments. (J) FCM plots (left) and frequencies (right) of Lyve1+ TAMs (CD45+CD11b+F4/80high) in iron-negative (left FCS plot) and iron-positive (right FCS plot) TAMs fractionated from FS tumors. Pregated on live singlets, CD45+, Ly6G, CD11b+, and F4/80high (n = 5 mice). Representative of ≥3 independent experiments. *P < 0.05, **P < 0.01. Statistical significance was determined by using the Mann–Whitney U test. Bar graphs are plotted as mean with SEM. All FCM plot events were pregated on live singlets unless otherwise specified and numbers represent the percentage of cells within the highlighted gates.
Figure S2.
Figure S2.
Characterizing iTAM subsets. (A) Iron quantification (Abcam) of iron-negative (flow-through) and iron-positive (eluate) cells isolated from mouse spleen. The workflow is similar to that depicted in Fig. 2 A, except that the second step of F4/80 enrichment was omitted for spleen samples. (B) Relative expression (RT-qPCR) of Hmox1 and Slc40a1 in iron fractionated TAMs isolated as described in Fig. 2 A (n = 4 independent tumors). (C) UMAP of iron-negative (flow-through, n = 2 mice) and iron-positive (eluate, n = 2 mice) TAMs from Fig. 2 D showing cell type annotation generated using the SingleR package with the ImmGen database as a reference for cell-type-specific gene expression signature. (D) Heatmap of SingleR scores for each cluster in the iron fractionated TAM scRNA-seq dataset, using the ImmGen database as a reference for cell-type-specific gene expression signature. (E) Selected marker gene expression for major leukocyte and stromal cell types in the iron fractionated TAM scRNA-seq dataset shown in Fig. 2 D. (F) FCM plots (left) and frequencies (right) of CD45+ cells in iron-negative and iron-positive TAMs fractionated from FS tumors as described in Fig. 2 A. Pregated on live singlets. Representative of ≥3 independent experiments. (G) FCM plots (left) and frequencies (right) of CD45+CD11b+F4/80high TAMs in iron-negative and iron-positive TAMs fractionated from FS tumors as described in Fig. 2 A. Pregated on live singlets. Representative of ≥3 independent experiments. (H) Single-cell suspensions were generated from murine syngeneic subcutaneous FS tumors by enzymatic digestion and taken through the magnetic column-based iTAM enrichment protocol (as shown in Fig. 2 A). Shown is the expression of key iTAM surface markers detected via FCM at each step of the enrichment. Tumor: unfractionated single-cell suspension from tumors. Tumor FT: flow-through after unfractionated tumor cells are run over the magnetic column for the first time. Tumor Iron+: iron-enriched fraction after unfractionated tumor cells are run over a magnetic column for the first time. TAM: Tumor FT sample incubated with ferromagnetic anti-F4/80 and run over magnetic columns to enrich for iron-negative TAM. TAM-FT: flow-through from the TAM step that contains F4/80-negative iron-negative cells. iTAM: Tumor iron+ fraction described above incubated with ferromagnetic anti-F4/80 and run over magnetic columns to enrich for iTAM. iTAM-FT: flow-through from the iTAM step that contains F4/80-negative iron-positive cells. *P < 0.05, **P < 0.01, ****P < 0.0001. Statistical significance in B, F, and G was determined using the Mann–Whitney U test. Significance for differences in H was determined using repeated-measures ANOVA. Bar graphs are plotted as mean with SEM. All FCM plot events were pregated on live singlets unless otherwise specified and numbers represent percentage of cells within the highlighted gates.
Figure 3.
Figure 3.
Ednrb expression marks iTAMs in mice and humans. (A) Relative expression (RT-qPCR) of Ednrb in paired iron fractionated TAMs (as described in Fig. 2 A) from flank FS tumors (n = 4 mice per group). Representative of ≥3 independent experiments. (B) FCM plots of iron-negative (flow-through) and iron-positive (eluate) cells from FS tumors (as described in Fig. 2 A but without the second step of F4/80+ cell enrichment) stained with ET1-HF488 conjugated peptide (fluorescent ligand for Ednrb). Histogram shows cells pregated on live singlets, CD45+ cells. Representative of three independent experiments. (C) t-SNE plot of malignant, immune, and stromal cells from 12 human SS profiled using scRNA-seq (human SS dataset) by Jerby-Arnon et al. (2021). Cluster labels from the original publication are highlighted. Pre-processed data from the original publication was downloaded from the Broad Institute Single Cell Portal (https://singlecell.broadinstitute.org/single_cell). (D) t-SNE expression plots of marker genes specific to major leukocyte and stromal cell types in the human SS scRNA-seq dataset, with clusters corresponding to TAMs encircled. (E) t-SNE expression plots of select iron metabolism and iTAM marker genes in the human SS scRNA-seq dataset, with myeloid clusters with the highest expression (clusters C1.immune and C13.immune) encircled. (F) Heatmap showing expression of selected iTAM marker genes identified in the murine FS scRNA-seq dataset, shown by cluster in the human SS scRNA-seq dataset. Clusters C1.immune and C13.immune demonstrate the highest expression of these iTAM markers. (G) GSEA of cluster C13.immune relative to all other clusters in the human SS scRNA-seq dataset, with normalized enrichment scores of the top 25 Hallmark pathways from the MSigDB shown and the Heme metabolism gene set highlighted in red. (H) t-SNE plot of leukocytes and stromal cells from 31 human melanoma tumors profiled using a publicly available scRNA-seq dataset (human melanoma scRNA-seq dataset) from a published study (Jerby-Arnon et al., 2018). Pre-processed data from the original publication was downloaded from the Broad Institute Single Cell Portal (https://singlecell.broadinstitute.org/single_cell). (I) t-SNE expression plots of marker genes specific to major leukocyte and stromal cell types in the human melanoma scRNA-seq dataset, with clusters corresponding to TAMs encircled. (J) t-SNE expression plots of select iron metabolism and iTAM marker genes in the human melanoma scRNA-seq dataset, with myeloid clusters with the highest expression encircled. ***P < 0.001. Statistical significance was determined by using the Mann-Whitney U test. Bar graph is plotted as mean with SEM. All FCM plot events were pregated on live singlets unless otherwise specified and numbers represent the percentage of cells within the highlighted gates.
Figure S3.
Figure S3.
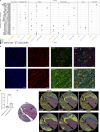
Ednrb expression in iTAM subsets. (A) Correlation between expression of EDNRB and selected iTAM-associated marker genes in the TCGA sarcoma (SARC), breast cancer (BRCA), lung adenocarcinoma (LUAD), and colon adenocarcinoma (COAD) datasets. Spearman and Pearson correlation coefficients are shown with associated P values. (B) Zoomed-in perivascular region from the Xenium spatial analyses of human melanoma described in Fig. 5 C. Color-coded cells reflect cell clusters identified by unbiased clustering analysis. Purple represents endothelial cells and sky blue pviTAMs (magnified inset). As shown in the figure, each gene/transcript is represented by a unique shape and its abundance by the frequency of that shape in a cell. (C) Zoomed-in stromal region from the Xenium spatial analyses of human melanoma described in Fig. 5 C. As described above, cell clusters and transcripts are coded by color and shape respectively. Purple cells here represent stiTAMs and are highlighted in the magnified inset.
Figure 4.
Figure 4.
iTAMs comprise two distinct subsets. (A and B) Heatmap showing that the two iTAM clusters (green and yellow color-coded) of the iron fractionated scRNA-seq dataset demonstrate high expression of the top 10 iTAM marker genes identified in the murine FS scRNA-seq dataset (clusters 6 and 12 in Fig. 1). The green color-coded cluster is also referred to as cluster 2 (C2) and the yellow as cluster 3 (C3) elsewhere in this figure. (C) Heatmap showing expression of perivascular macrophage marker genes by cluster within the iron fractionated TAM scRNA-seq dataset. The genes defining perivascular macrophages were identified from a previously published scRNA-seq dataset of perivascular macrophages (Chakarov et al., 2019). C3 (the yellow color-coded TAM cluster) has the highest relative expression of the perivascular marker genes compared to all other clusters, including C2 (the green color-coded) cluster. (D and E) GSEA of stiTAMs (C2, green color-coded cluster in A–C) and pviTAMs (C3, yellow color-coded cluster in A–C) relative to all other clusters, with normalized enrichment scores of the top 20 Hallmark gene sets from the MSigDB shown. Pathways enriched in both clusters are highlighted in red, while pathways uniquely enriched in one cluster are highlighted in blue. (F) Heatmap of the top 30 differentially expressed genes between the iron-negative and iron-positive cells within the stiTAM cluster of the iron fractionated TAM scRNA-seq dataset. Genes involved in iron metabolism, antigen presentation, or the generation of immune or inflammatory responses are bolded. (G) Heatmap of the top 30 differentially expressed genes between the iron-negative and iron-positive cells within the pviTAM cluster of the iron fractionated TAM scRNA-seq dataset. Genes involved in iron metabolism, antigen presentation, or the generation of immune or inflammatory responses are bolded. (H) Representative FCM of single-cell suspension from murine FS generated in Ms4A3Cre:Rosa26tdTomato mice. The gating scheme is indicated for each histogram and the numbers represent the percentage of cells enclosed within the box. The two-color histogram on the right shows the distribution of cells expressing the monocyte lineage marker TdTomato within pviTAMs (red) and stiTAMs (blue).
Figure 5.
Figure 5.
pviTAMs and stiTAMs have distinct localization in tumors. (A) Cell–cell signaling network generated from the murine SS scRNA-seq dataset (Fig. 1 F) using the CytoTalk computational algorithm. The y-axis lists the ligand–receptor interactions. Cells participating in the interactions are listed above (cellular source of ligand) and below (cells with receptor) the graph. The size and color of dots indicate the specificity and strength of the interaction, respectively. (B) Immunofluorescence images of murine UPS showing the location of pviTAMs (white arrowhead) and stiTAMs (yellow arrowhead). Tumor sections were stained with anti-CD31 (red; endothelial cells), anti-CD68 (blue; macrophages), and anti-Hmox1 (top; green) or anti-Ednrb (bottom; green). Scale bar: 50 µm. Representative of two experiments. (C) Relative quantification of the fraction of endothelial cells (CD31+) proximal to iTAM population (Hmox1+ stiTAM or Ednrb+ pviTAM). The number of endothelial cells and Hmox1+ or Ednrb+ cells was determined in each region of interest. Each symbol represents a region of interest where counting was performed within one representative stained tumor section. (D) Spatial transcriptomics (Xenium—10X Genomics) was performed on a human melanoma tissue microarray. The panel of genes tested included multiple iTAM marker genes. The leftmost panel shows H&E staining for the selected section in a tissue microarray of human melanoma biopsies. The black arrow highlights a large hemorrhagic area within the tumor. The six fluorescence panels show the expression of selected iTAM genes (headers) that were included in the Xenium panel. Statistical significance was determined by using the Mann-Whitney U test. Bar graph is plotted as mean with SEM.
Figure 6.
Figure 6.
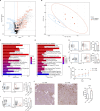
iTAMs promote tumor growth. (A) Volcano plot of differentially expressed genes (n = 278 downregulated and 1,361 upregulated genes with adjusted P value <0.1 and logFC >0.5) in bulk RNA-seq data from four pairs of iron-negative and iron-positive TAMs (bulk iron fractionated TAM RNA-seq dataset, see Fig. 3 A). Select significantly downregulated genes involved in antigen presentation through major histocompatibility complex class II (MHCII) are highlighted and labeled in blue (gene list from https://www.informatics.jax.org/go/term/GO:0019886 [GO Term: antigen processing and presentation of exogenous peptide antigen via MHC class II]). Significantly upregulated genes from the top 10 stiTAM markers and top 10 pviTAM markers from the murine FS scRNA-seq dataset are highlighted and labeled in red. (B) Principal component analysis (PCA) plot showing the first two principal components from the bulk iron fractionated TAM RNA-seq dataset. (C) Top 20 GO biological process (GO:BP) terms significantly enriched in upregulated genes in the iron-positive TAMs (bulk iron fractionated TAM RNA-seq dataset) based on the Enrichr R package. Pos. = positive, TF = transcription factor, Reg. = regulation. (D) Top 20 GO:BP terms significantly enriched in upregulated genes in the iron-negative TAMs (bulk iron fractionated TAM RNA-seq dataset) based on the Enrichr R package. Pos. = positive, TF = transcription factor, Reg. = regulation. (E) FCM plots (left) and frequencies (right) of CD11c+ TAMs (CD45+CD11b+F4/80high) in iron-negative (left FCS plot) and iron-positive (right FCS plot) TAMs fractionated from FS tumors. Cells in the histogram were pregated on live singlets, CD45+, Ly6G, CD11b+, and F4/80high. Representative of ≥3 independent experiments. (F) FCM plots (left) and frequencies (right) of MHCII+ TAMs (CD45+CD11b+F4/80high) in iron-negative (left FCS plot) and iron-positive (right FCS plot) TAMs fractionated from FS tumors. Cells in the histogram were pregated on live singlets, CD45+, Ly6G, CD11b+, and F4/80high. Gates were drawn manually on individual samples to appropriately distinguish MHCII and MHCII+ populations in each sample. Representative of ≥3 independent experiments. (G) TAMs or iTAMs were isolated from murine FS using our magnetic column-based approach, mixed 1:1 with FS cells grown in culture, and the mixture was then injected subcutaneously into C57BL/6 mice. Tumors were measured every 2 days starting 6 days after implantation. Shown are tumor volumes over time (n = 4 tumors per group). Representative of four independent experiments. (H) FCM plots (left) and frequencies (right) of CD45+CD3+ T cells in iron-negative and iron-positive TAM co-transplanted tumors described above in Fig. 6 G. Cells in the histogram were pregated on live singlets, CD45+ Ly6G. Representative of ≥3 independent experiments. (I) FCM plots (left) and frequencies (right) of CD45CD31+ endothelial cells (ECs) in iron-negative and iron-positive TAM co-transplantated tumors described above in Fig. 6 G. Representative of ≥3 independent experiments. (J) Immunohistochemistry with anti-CD31 on tumors generated with iron-negative and iron-positive TAM cotransplanted tumors described above. Representative micrographs are on the left and quantification on the right. Scale bar: 50 µm. Representative of ≥2 independent experiments. *P < 0.05, **P < 0.01. Statistical significance was determined using the Mann-Whitney U test. The significance of differences in tumor volume (G) was determined using repeated-measures ANOVA. Bar graphs are plotted as mean with SEM. All FCM plot events were pregated on live singlets unless otherwise specified and numbers represent percentage of cells within the highlighted gates.
Figure S4.
Figure S4.
Ednrb function in iTAMs. (A) Bulk bone marrow cells from Ms4A3Cre:Rosa26Flox-tdT mice were cultured in M-CSF to generate BMDMs. FS tumor cells were mixed with these BMDMs at a 50:50 ratio and subcutaneously transplanted into syngeneic C57BL/6J mice. FS tumors were harvested 14 days after transplantation and subjected to FCM to identify monocyte-derived macrophages (TdTomato-positive cells). Representative FCM is shown with the gating scheme for each histogram. The two-color histograms on the right show the distribution of Tdtomato+ (red) and Tdtomato− (blue) cells expressing macrophage markers CD206, F4/80, MHCII, CD163, and CD11b. (B) Co-transplantation of tumor cells with TAMs or iTAMs (as described in Fig. 6 G) was performed and the tumors were harvested on day 14. CD4 and CD8 T cell phenotyping was performed using FCM. The bar graphs show the various phenotypic parameters (y-axis) of indicated (header) cell types. n = 4 mice per group. Representative of ≥3 independent experiments. (C) FCM surface expression of key iTAM markers, Ednrb and Lyve1, by induced iTAMs (BMDMs exposed to heme). Three replicates per group. Representative of ≥3 independent experiments. (D) Relative expression (RT-qPCR) of Ednrb in FAC-sorted TAMs from subcutaneous FS tumors generated in control (LysmCre:Rosa26LSL-tdT) and Ednrb-KO (LysMCre:Ednrbfl/fl) mice, confirming loss of Ednrb expression in Ednrb-KO TAMs. n = 4 mice per group. Representative of ≥3 independent experiments. (E) Relative expression (RT-qPCR) of Ednrb in FAC-sorted large peritoneal macrophages (CD45+CD11b+F4/80hightdT+) from either control (LysMCre:Rosa26LSL-tdT), Ednrb-Het (LysMCre:Ednrb+/flox:Rosa26LSL-tdT), or Ednrb-KO (LysMCre:Ednrbfl/fl:Rosa26LSL-tdT) mice. Representative of ≥3 independent experiments. (F) The left panel shows the gating strategy for tumor-associated macrophages (TAMs) and neutrophils from FS tumors generated in LysmCre:Rosa26LSL-tdT mice. Histograms show the expression of tdTomato (LysmCre+ cells) in TAMs, neutrophils, endothelial cells, and tumor cells from these tumors. (G) Body weight was measured over time for WT mice injected with FS flank tumors and treated with either DMSO or the endothelin receptor antagonist Macitentan (see Fig. 8, E and F). n = 5 mice per group. Representative of ≥3 independent experiments. (H) CellTiter-Glo viability assay for FS cells treated with either DMSO or increasing concentrations of Macitentan in culture. Six replicates per group. Representative of ≥2 independent experiments. (I) UMAP expression plots of marker genes specific to major leukocyte and stromal cell types in the Bach1 KO scRNA-seq dataset. (J) UMAP of the murine Bach1 KO scRNA-seq dataset showing cell-type annotation using the SingleR package with the ImmGen database as a reference. *P < 0.05, **P < 0.01, ****P < 0.0001. Statistical significance in B–D was determined using the Mann–Whitney U test. Significance for differences in E and H was determined using repeated-measures ANOVA. Bar graphs are plotted as mean with SEM. All FCM plot events were pregated on live singlets unless otherwise specified and numbers represent percentage of cells within the highlighted gates.
Figure 7.
Figure 7.
iTAMs promote angiogenesis and immunosuppression. (A and B) The left graph shows a boxplot of Folr2 expression by cluster in the murine FS scRNA-seq dataset. The right bar graph inset shows cell surface expression of Folr2 measured by FCM in TAMs and iTAMs isolated from FS tumors using our magnetic column-based enrichment outlined in Fig. 2 A (n = 5 mice; representative of three independent experiments). (C and D) Folr2 positive and negative TAMs were isolated using FCM-based cell sorting. These cells were then cocultured with T cells labeled with CTV dye. T cell proliferation was measured after 3 days based on dye dilution. T cell proliferation was significantly decreased after coculture with Folr2+ macrophages. The colored histogram (C) shows representative dye dilution in CD8 T cells while the bar graph (D) quantifies CD8 T cell proliferation across multiple experimental replicates. Representative of ≥2 independent experiments. (E and F) The same experiment outlined above in panels C and D but showing CD4 T cell proliferation through a colored histogram (E) and bar graph quantification (F). (G and H) In vitro angiogenesis assay performed by coculturing macrophages with endothelial cells (x-axis). Various parameters of angiogenesis (y-Axis) were measured. Each symbol represents a different field of image in one cell culture well. Data is representative of three independent experiments. In (G) the macrophages used in the co-culture experiment were iron-negative TAMs or iTAMs derived from tumors. In (H) the macrophages were in vitro induced iTAMs generated by culturing bone marrow cells in M-CSF to generate macrophages (BMDMs) that were then exposed to heme (x-axis, BMDM + Heme) or control (x-axis, BMDMs). EC: Endothelial cells. ITAM: Iron-rich TAM. *P < 0.05, **P < 0.01, ***P < 0.001, ****P < 0.0001. Statistical significance in B was determined using the Mann-Whitney U test. Statistical significance in D and F–H was determined using repeated-measures ANOVA. Bar graphs are plotted as mean with SEM.
Figure 8.
Figure 8.
Ednrb signaling promotes the tumor-supportive functions of iTAMs. (A) Control mice (LysmCre:RosaLSL-tdT) and mice with Ednrb deletion in macrophages (LysMCre:Ednrbfl/fl) were transplanted subcutaneously with FS cells. Shown are tumor volumes over time (n = 6 mice per group). Representative of ≥3 independent experiments. (B) Weight of the tumors at endpoint from the experiment in A. (C) FCM plots (left) and frequencies (right) of MHCII+ TAMs (CD45+CD11b+F4/80high) in FS tumors generated in control (LysmCre:RosaLSL-tdT) and Ednrb myeloid knockout (LysMCre:Ednrbfl/fl) mice (n = 4 mice per group). Cells were pregated on live singlets, CD45+, Ly6G, CD11b+, and F4/80high. Representative of ≥3 independent experiments. (D) Representative immunohistochemistry for CD31 in FS tumors generated in control (LysmCre:RosatdT) and Ednrb myeloid KO (LysMCre:Ednrbfl/fl) mice. Scale bar: 100 µm. The bar graph on the right show quantification of % CD31 positive staining per tumor section (n = 7 tumors per group). Each dot represents a section/slide from an independent tumor. Representative of three independent experiments from two independent cohorts of tumors. (E) FS-bearing C57BL/6 mice were treated with the Endothelin receptor antagonist macitentan (i.p. 10 mg/kg, daily) or vehicle control (DMSO, daily) with or without anti-PD1 (200 μg, every 3 days) starting when tumors were ∼50 mm3 (n = 5 tumors per group). Kaplan–Meier survival curves are shown, with a significant difference between groups by log-rank test (P = 0.01). Representative of two independent experiments. (F) Tumor volume measured at day 13 for the experiment outlined in E above (n = 5 tumors per group). (G) Expression of EDNRB, CTLA4, PDCD1 (PD-1), and CD274 (PD-L1) in human melanoma patients, stratified by response to treatment with nivolumab (Riaz et al., 2017). Raw data obtained from the CRI iAtlas portal (https://cri-iatlas.org/). (H) Z-scores of T cell dysfunction scores associated with each selected iTAM marker gene in both the Core (grey) and Immunotherapy (black) datasets from the Tumor Immune Dysfunction and Exclusion (TIDE) database (http://tide.dfci.harvard.edu/). Higher Z-scores are associated with increased T cell dysfunction. (I) EDNRB expression in the tumor immune microenvironment subtypes identified by Thorsson et al. (2018), showing the highest expression in the “immunologically quiet” C5 subtype (leftmost panel), which is characterized by the highest proportion of M2 macrophages (top right panel) and monocytes (bottom left panel) and the fewest tumor-infiltrating lympohocytes (bottom right panel). Data downloaded from (https://cri-iatlas.org/). *P < 0.05, **P < 0.01. Significance for differences in tumor volume (A and F) were determined using repeated-measures ANOVA. Statistical significance in B–D was determined using the Mann-Whitney U test. Statistical significance in G was determined using a Student’s t test. Bar graphs are plotted as mean with SEM. All FCM plot events were pregated on live singlets unless otherwise specified and numbers represent percentage of cells within the highlighted gates.
Figure 9.
Figure 9.
Bach1 represses the iTAM phenotype. (A and B) GSEA for transcription factor binding motif enrichment in stiTAM (A) and pviTAM (B) clusters in the iron fractionated TAM scRNA-seq dataset (described in Fig. 2 D) using the TFT_legacy subset of the TFT collection in MSigDB. Motifs related to Bach, Maf, and Nrf2 transcription factor binding are highlighted in red. (C) Annotated UMAP from integrated scRNA-seq dataset of CD45+ column-enriched leukocytes from FS tumors generated in WT and Bach1 KO mice (Bach1 KO scRNA-seq dataset) (n = 1 mouse per genotype). Clusters are annotated using a combination of canonical marker genes and the SingleR package with the ImmGen database as a reference. (D) Percent contribution of each cluster by genotype in the Bach1 KO scRNA-seq dataset. (E) Expression of selected genes involved in antigen presentation (Cd74, H2-Aa, B2m), iron metabolism (Hmox1, Slc40a1), and Ednrb by genotype in the Bach1 KO scRNA-seq dataset. (F) Volcano plot of differentially expressed genes between WT and Bach1 KO macrophages within the iTAM cluster of the Bach1 KO scRNA-seq dataset. Differentially expressed genes (log2FC > 1 and P-adj < 0.05) are highlighted in red, with select genes involved in antigen presentation (Cd74, H2-Aa, H2-Ab1, H2-Eb1), iron metabolism (Hmox1, Fth1, Ftl1, Slc40a1, Slc48a1), known Bach1 target genes (Spic), and additional iTAM marker genes (Pf4, F13a1, Arg1, Ccl6, Mmp12) labeled. Differential expression testing was performed using MAST. (G) Violin plots showing GSEA enrichment scores for Bach1 WT and Bach1 KO iTAMs for indicated Hallmark pathways (headers). (H) FCM plots (left) and frequencies (right) of MHCII+ TAMs (CD45+CD11b+F4/80high) from littermate control (Bach1 WT) and Bach1 KO mice transplanted with FS tumors (n = 5 mice per group). Pregated on live singlets, CD45+, Ly6G, CD11b+, and F4/80high. Representative of ≥2 independent experiments. (I) FCM plots (left) and frequencies (right) of MHCII+ myeloid cells (CD45+CD11b+F4/80low) from littermate control (Bach1 WT) and Bach1 KO mice transplanted with FS tumors (n = 5 mice per group). Pregated on live singlets, CD45+, Ly6G, CD11b+, and F4/80low. Representative of ≥2 independent experiments. (J) FS flank tumor volumes from Bach1 WT and Bach1 KO mice (n = 4 mice per group). Representative of ≥3 independent experiments. (K) Tumor weight of FS flank tumors in Bach1 WT and Bach1 KO mice (n = 8 mice per group). *P < 0.05, **P < 0.01, ***P < 0.001, ****P < 0.0001. Statistical significance in H, I, and K was determined using the Mann-Whitney U test. Statistical significance in J was determined using repeated-measures ANOVA. Bar graphs are plotted as mean with SEM. All FCM plot events were pregated on live singlets unless otherwise specified and numbers represent percentage of cells within the highlighted gates.
Figure S5.
Figure S5.
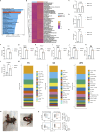
Regulation of Ednrb expression by the heme-Bach1 axis. (A) GSEA of the iTAM cluster in the murine Bach1 KO scRNA-seq dataset relative to all other clusters, with normalized enrichment scores of the top 20 Hallmark gene sets from the MSigDB shown, and the Heme metabolism gene set highlighted in red. (B) Heatmap of GSEA Hallmark pathway (MSigDB) enrichment comparing Bach1 WT and Bach1 KO cells within the iTAM cluster of the Bach1 KO scRNA-seq dataset. (C) FS flank tumors from Bach1 WT and Bach1 KO mice were harvested and the single-cell suspensions from the tumors were analyzed by FCM. Shown is the frequency of CD45CD31+ endothelial cells as a percentage of all viable cells in the tumor (see also Fig. 9, J and K). n = 5 mice per group. Representative of ≥3 independent experiments. (D) Relative expression (RT-qPCR) of Bach1 in mouse monocyte-derived macrophages (MDMs) from either WT littermate control (Bach1 WT) or Bach1 KO mice. MDMs were generated by isolating monocytes from bone marrow and culturing them with M-CSF. Representative of ≥3 independent experiments. (E) Relative expression (RT-qPCR) of Ednrb in mouse MDMs from either WT littermate control (Bach1 WT) or Bach1 KO mice. (F) Relative expression (RT-qPCR) of Spic in mouse BMDMs treated with vehicle control or Heme for 24 h. Representative of ≥3 independent experiments. (G) Relative expression (RT-qPCR) of Ednrb in mouse BMDMs treated with vehicle control or Heme for 24 h. Representative of ≥3 independent experiments. (H) Relative expression (RT-qPCR) of Hmox1 in mouse BMDMs treated with vehicle control or Heme for 24 h. Representative of ≥3 independent experiments. (I) Relative expression (RT-qPCR) of Slc40a1 in mouse BMDMs treated with vehicle control or Heme for 24 h. Representative of ≥3 independent experiments. (J) Relative expression (RT-qPCR) of Fth1 in mouse BMDMs treated with vehicle control or Heme for 24 h. Representative of ≥3 independent experiments. (K) Relative expression (RT-qPCR) of Ftl1 in mouse BMDMs treated with vehicle control or Heme for 24 h. Representative of ≥3 independent experiments. (L) Relative expression (RT-qPCR) of EDNRB in human MDMs treated with vehicle control or Heme for 24 h. Representative of ≥3 independent experiments. (M) Percent contribution of each cluster of cells identified by unbiased analyses of scRNA-seq data of CD45+ cells from the different tumor types indicated above each bar graph. FS tumors were generated by a syngeneic transplant of FS tumor cells into LysMCre:Rosa26LSL-tdT (control/WT) recipient mice. SS and UPS are autochthonous tumors generated by TAT-Cre injection in genetically engineered mice. (N) Example of a spontaneously hemorrhagic murine SS tumor. Image on the right shows a magnified picture of an SS tumor. White arrowheads point towards the hemorrhagic areas. (O) FCM plots show frequency of MHCII+ (top) and CD11c+ (bottom) TAMs in non-hemorrhagic (left) and spontaneously hemorrhagic (right) SS tumors and littermate controls. (NH: Non-hemorrhagic, H: Hemorrhagic). *P < 0.05, ***P < 0.001, ****P < 0.0001. Statistical significance was determined using the Mann–Whitney U test. Bar graphs are plotted as mean with SEM. All FCM plot events were pregated on live singlets unless otherwise specified and numbers represent the percentage of cells within the highlighted gates.
Figure 10.
Figure 10.
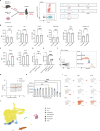
Hemorrhage-derived heme regulates iTAM development. (A) Schematic of the intratumoral autologous blood injection model and downstream analysis. (B) FCM plots showing expression of pro-inflammatory markers (MHCII and CD11c) in myeloid cells (CD11bhigh) from PBS (control) and autologous blood injected FS tumors 48 h after injection (n = 4 mice per group). Cells pregated on live singlets, CD45+ cells. Representative of ≥3 independent experiments. (C) CD45+ leukocytes were FAC-sorted 48 h after PBS (control) or autologous blood injection of FS flank tumors (n = 2 mice per group) and profiled by scRNA-seq. Shown are UMAP plots of the merged control and blood-injected samples after the two datasets were combined and annotated using a combination of canonical marker genes and reference-based annotation using SingleR, with the ImmGen database as a reference (merged hemorrhage scRNA-seq dataset). Cells from the replicates of each experimental group were combined before sequencing, yielding one sequencing dataset per group. (D) Percent contribution of stiTAMs and pviTAMs in the PBS (control) and autologous blood injected samples in the merged hemorrhage scRNA-seq dataset. (E) Heatmap of the top 50 significantly differentially expressed genes between PBS (control) and autologous blood injected cells in the pviTAM cluster of the merged hemorrhage scRNA-seq dataset. Genes involved in iron metabolism, antigen presentation, or the generation of immune or inflammatory responses are bolded. (F) Log2 normalized expression over time of EDNRB and HMOX1 in human peripheral blood monocytes (blue) and monocytes/macrophages from intracerebral hemorrhage (ICH) patients (gold) in a previously published dataset (Askenase et al., 2021). (G) Model for iTAM induction and function in the TME. *P < 0.05. Statistical significance was determined using the Mann-Whitney U test. Bar graphs are plotted as mean with SEM. All FCM plot events were pregated on live singlets unless otherwise specified and numbers represent percentage of cells within the highlighted gates.

References

    1. Alam, M.Z., Devalaraja S., and Haldar M.. 2017. The heme connection: Linking erythrocytes and macrophage biology. Front. Immunol. 8:33. 10.3389/fimmu.2017.00033 - DOI - PMC - PubMed
    1. Arlauckas, S.P., Garris C.S., Kohler R.H., Kitaoka M., Cuccarese M.F., Yang K.S., Miller M.A., Carlson J.C., Freeman G.J., Anthony R.M., et al. . 2017. In vivo imaging reveals a tumor-associated macrophage-mediated resistance pathway in anti-PD-1 therapy. Sci. Transl. Med. 9:eaal3604. 10.1126/scitranslmed.aal3604 - DOI - PMC - PubMed
    1. Askenase, M.H., Goods B.A., Beatty H.E., Steinschneider A.F., Velazquez S.E., Osherov A., Landreneau M.J., Carroll S.L., Tran T.B., Avram V.S., et al. . 2021. Longitudinal transcriptomics define the stages of myeloid activation in the living human brain after intracerebral hemorrhage. Sci. Immunol. 6:eabd6279. 10.1126/sciimmunol.abd6279 - DOI - PMC - PubMed
    1. Benci, J.L., Xu B., Qiu Y., Wu T.J., Dada H., Twyman-Saint Victor C., Cucolo L., Lee D.S.M., Pauken K.E., Huang A.C., et al. . 2016. Tumor interferon signaling regulates a multigenic resistance program to immune checkpoint blockade. Cell. 167:1540–1554.e12. 10.1016/j.cell.2016.11.022 - DOI - PMC - PubMed
    1. Chakarov, S., Lim H.Y., Tan L., Lim S.Y., See P., Lum J., Zhang X.-M., Foo S., Nakamizo S., Duan K., et al. . 2019. Two distinct interstitial macrophage populations coexist across tissues in specific subtissular niches. Science. 363:eaau0964. 10.1126/science.aau0964 - DOI - PubMed

MeSH terms