. 2024 Sep 30;15(1):509.
doi: 10.1007/s12672-024-01357-7.

Comprehensive analysis to identify IL7R as a immunotherapy biomarker from pan-cancer analysis to in vitro validation

Affiliations

Comprehensive analysis to identify IL7R as a immunotherapy biomarker from pan-cancer analysis to in vitro validation

Jiafeng Liang et al. Discov Oncol. .

Abstract

Background: Immunotherapy faces a major challenge in treatment resistance, highlighting the need for efficacy biomarkers identification. The tumor microenvironment (TME) significantly influences treatment outcomes, necessitating molecular TME exploration to address immunotherapy resistance.

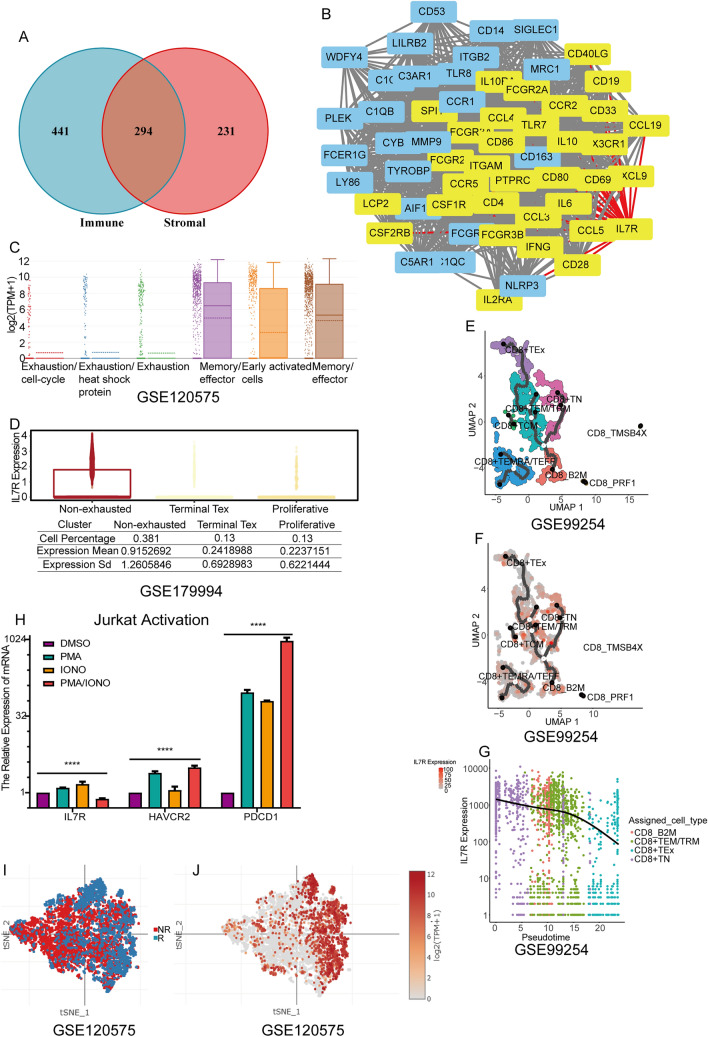
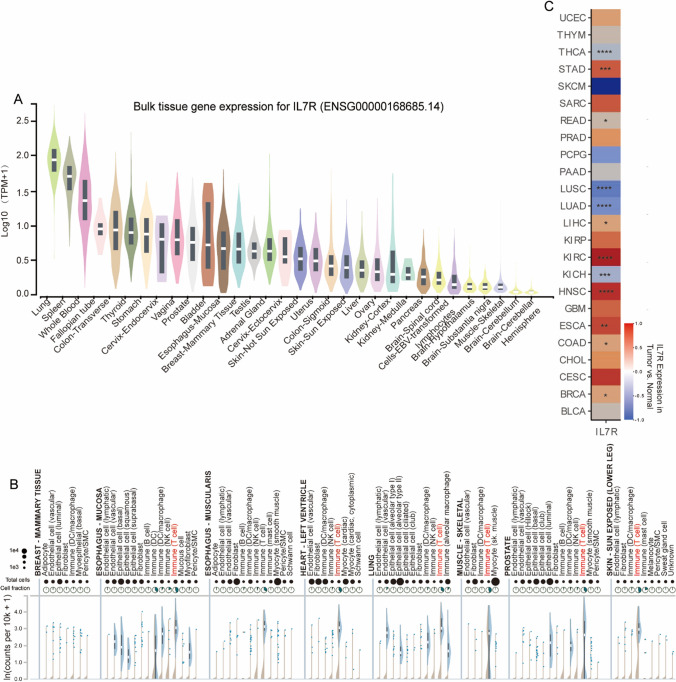
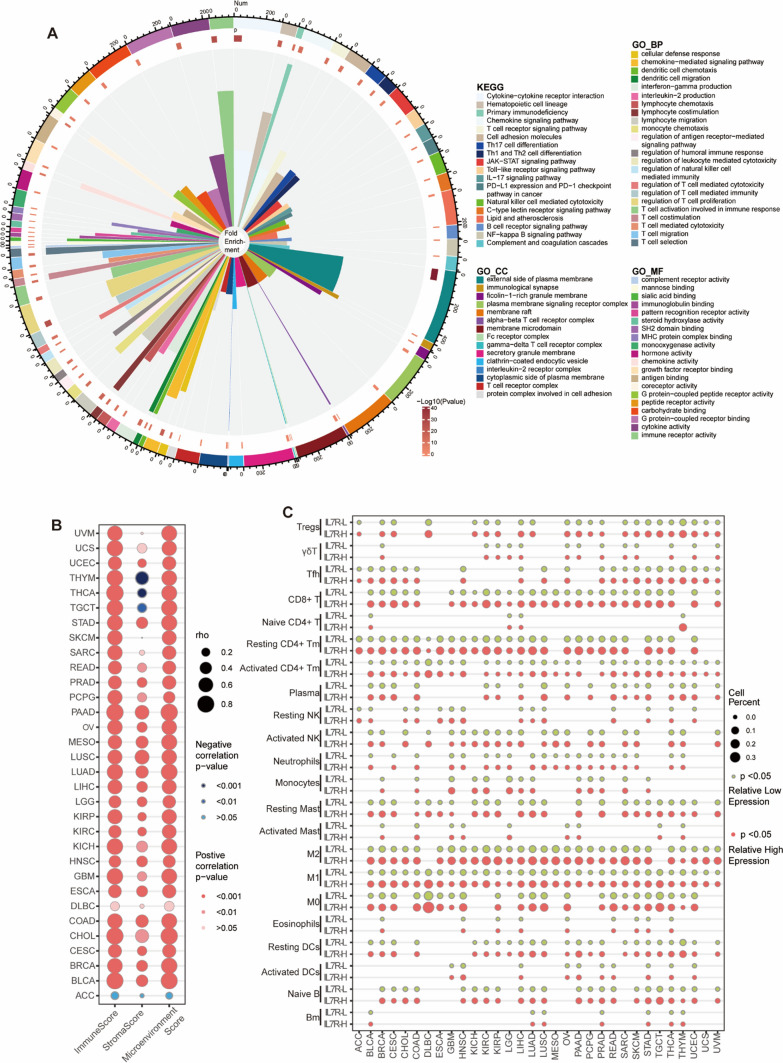
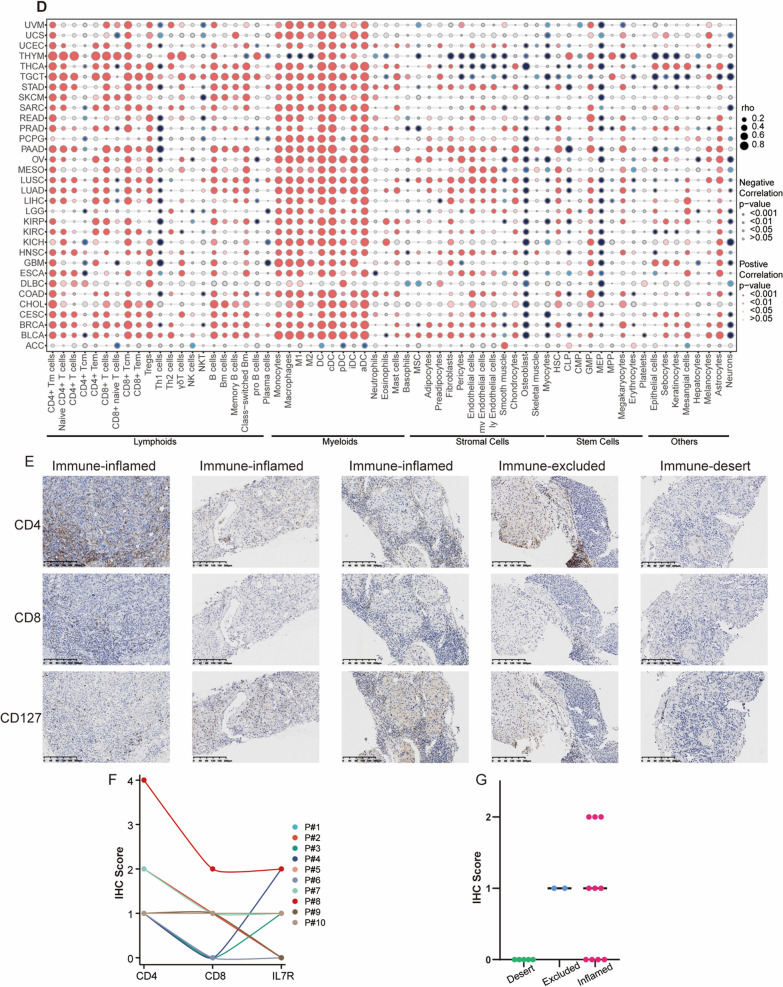
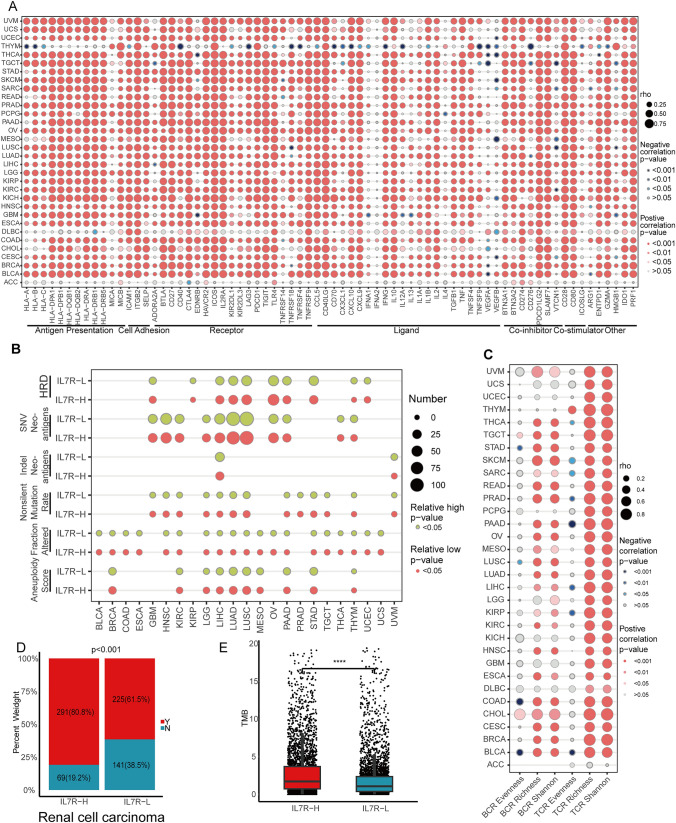
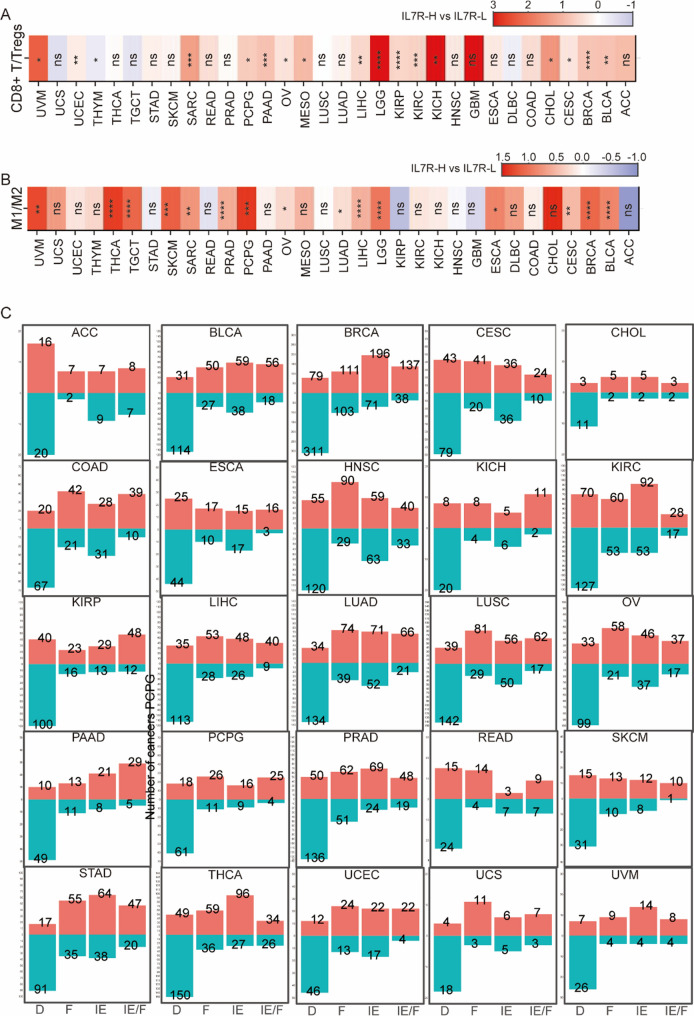
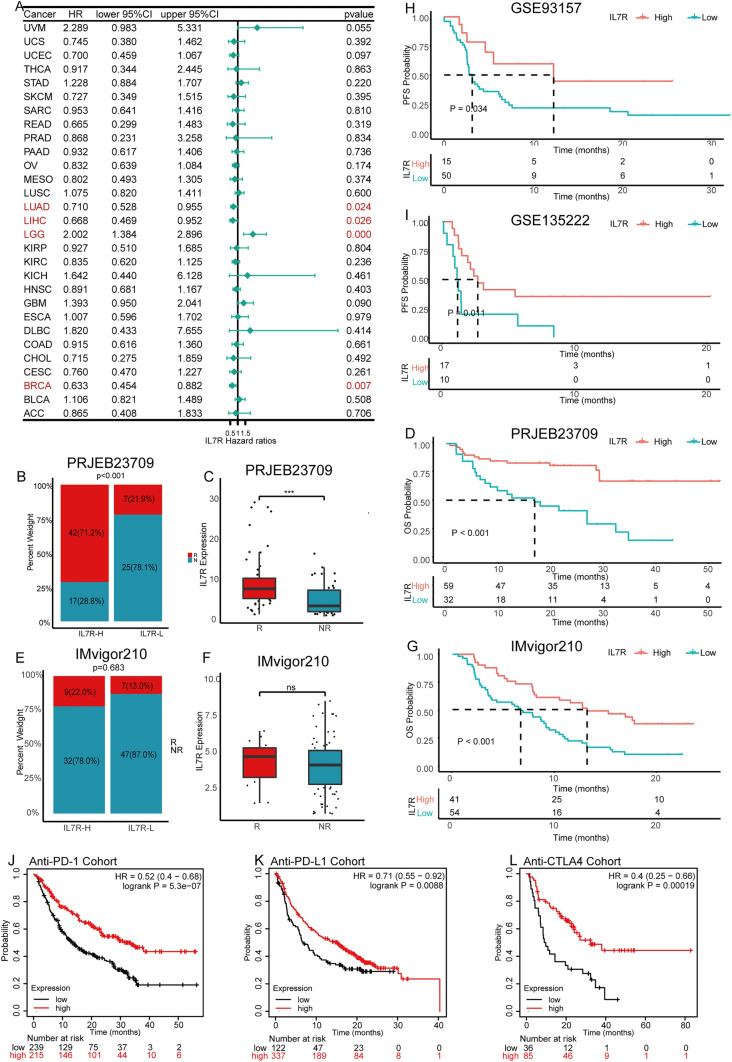
Methods: The study initially pinpointed IL7R as a pivotal TME gene and then examined its impact on TME's CD8 + T cells at the single-cell level. Bulk-RNA analysis investigated IL7R function, immune cell infiltration related to IL7R in TCGA pan-cancer samples with its expression verified in clinical samples through immunohistochemistry. Genome instability and immune-related molecular expression associated with IL7R were also assessed. Furthermore, the clinical efficacy of IL7R was evaluated in various immunotherapy treatment cohorts.

Results: Our single-cell analyses and cell-cased experiment revealed that T cells with high IL7R expression tended to be non-terminal and correlated with favorable immunotherapy responses. High IL7R expression corresponded to increased immune and stromal cell signiture, immune pathway enrichment, and an immune-inflamed environment in Bulk-RNA analysis and immunohistochemistry verification. These patients exhibited higher proportions of memory T cells and M1 cells within the TME, along with frequent genome instability and immune molecular upregulation. While IL7R had varied prognostic impact across the TCGA dataset, patients with high IL7R expression showed extended survival under immunotherapy.

Conclusion: IL7R plays a critical role in shaping TME diversity across cancer types and holds promise as a relevant biomarker for predicting immunotherapy benefits.

Keywords: IL7R; Immunotherapy; Pan-cancer; T cell; Tumor microenvironment.


Conflict of interest statement

The authors declare no competing interests.

Figures

Fig. 1
Fig. 1
IL7R function its role in non-exhausting T cells. A Venn diagram shows overlapping differentially expressed gene signatures in ImmuneScore-DEG and StromalScore-DEG. B Hub PPI network constructed according to DEGs. DEGs came from ImmuneScore and StromalScore DEGs sets intersection. C, D Boxplot shows IL7R expression in different CD8+ T cell subtypes in GSE120575 (C), GSE179994 (D). E UMAP shows CD8+ T cell clusters. F UMAP shows IL7R expression in single CD8+ T cell. G UMAP shows IL7R expression across pseudotime. H RT-PCR shows IL7R expression decreasing with T cells exhausting makers growing. I tSNE shows the patients’ response to immunotherapy. J tSNE shows IL7R expression in single CD8+ T cell
Fig. 2
Fig. 2
Clinical impaction and distribution of IL7R across pan-cancer. A Violin plot shows IL7R expression across different organs. B Violin plot shows the distribution of IL7R across different cell lines in different organs at the single-cell level. C Heatmap shows the fold changes of IL7R expression involved in different organs in the comparison of tumor versus normal
Fig. 3
Fig. 3
Impact of IL7R expression on immune infiltration in pan-cancer. A Circos plot shows top enriched terms based on KEGG pathways, cellular components, molecular functions and biological processes in DEGs. B Bubble heatmap shows the association between EstimateScore and IL7R expression in pan-cancer. C Bubble heatmap shows 22 Immune cells infiltration difference between IL7R-H and IL7R-L group. 22 immune cell content is calculated using CIBERSORTABS. D Bubble heatmap shows the association between each immune cell and IL7R expression in pan-cancer. Immune cells content is caculated using XCELL. E Representative images of IHC for CD4, CD8, IL7R protein expression in LUAD tissue. (F) Quantification of CD4, CD8, IL7R protein expression in LUAD immune-inflamed cases. G The plot of relationships IL7R expressed in immune-desert, immune-excluded and immune-inflamed cases
Fig. 3
Fig. 3
Impact of IL7R expression on immune infiltration in pan-cancer. A Circos plot shows top enriched terms based on KEGG pathways, cellular components, molecular functions and biological processes in DEGs. B Bubble heatmap shows the association between EstimateScore and IL7R expression in pan-cancer. C Bubble heatmap shows 22 Immune cells infiltration difference between IL7R-H and IL7R-L group. 22 immune cell content is calculated using CIBERSORTABS. D Bubble heatmap shows the association between each immune cell and IL7R expression in pan-cancer. Immune cells content is caculated using XCELL. E Representative images of IHC for CD4, CD8, IL7R protein expression in LUAD tissue. (F) Quantification of CD4, CD8, IL7R protein expression in LUAD immune-inflamed cases. G The plot of relationships IL7R expressed in immune-desert, immune-excluded and immune-inflamed cases
Fig. 4
Fig. 4
Impact of IL7R expression on immune point in pan-cancer. A Bubble heatmap shows the association between each immune related molecular and IL7R. B Bubble heatmap shows genome instability difference between IL7R-H and IL7R-L group. C Barplot shows the proportion of PD-L1 expression between IL7R-H and IL7R-L group in renal cell carcinoma. D Bubble heatmap shows the association between TCR/BCR and IL7R expression in pan-cancer. E Boxplot shows the relationship between TMB and IL7R expression in TCGA patients
Fig. 5
Fig. 5
Distinct immune microenvironment in pan-cancer. AB Bar plot shows CD8/Tregs (A) and M1/M2 (B) across pan-cancer. C Histogram shows distribution of TME subgroups in IL7R-H and IL7R-L group
Fig. 6
Fig. 6
Identification of IL7R role on predicting immunotherapy efficacy. A Forest plot shows the IL7R cox regression in different cancers. B, E Barplot shows the relative proportions of treatment response patients between IL7R-H and IL7R-L group in PRJEB23709 (B), IMvigor210 (E). C, F Boxplot shows IL7R expression in treatment responder and non-responder in PRJEB23709 (C), IMvigor210(F). D, G, H, I Kaplan–Meier curves for OS in PRJEB23709 (D) and IMvigor210 (G) and GSE13522 (H) and GSE93157 (I) stratified according to optimal value. J, K, L Survival plots of Kaplan–Meier curves for OS between IL7R-H and IL7R-L categorized by best cut-off values in cancer patients treated with PD1 inhibitor (J), PD-L1 (K), CTLA4 inhibitors (L)

Similar articles

Cited by

References

    1. Hodi FS, O’Day SJ, McDermott DF, Weber RW, Sosman JA, Haanen JB, et al. Improved survival with ipilimumab in patients with metastatic melanoma. N Engl J Med. 2010;363(8):711–23. 10.1056/NEJMoa1003466. - PMC - PubMed
    1. Gu JY. Releasing the Brakes on cancer immunotherapy. Oncol Lett. 2015;373(16):1490–2. 10.1056/NEJMp1510079. - PubMed
    1. Motzer RJ, Escudier B, McDermott DF, George S, Hammers HJ, Srinivas S, et al. Nivolumab versus everolimus in advanced renal-cell carcinoma. N Engl J Med. 2015;373(19):1803–13. 10.1056/NEJMoa1510665. - PMC - PubMed
    1. Bruni D, Schmid P, Adams S, Rugo HS, Schneeweiss A, Barrios CH, et al. Atezolizumab and Nab-paclitaxel in advanced triple-negative breast cancer. Nat Rev Drug Discovery. 2018. 10.1038/s41573-018-0007-y.10.1056/NEJMoa1809615. - PubMed
    1. Forde PM, Chaft JE, Smith KN, Anagnostou V, Cottrell TR, Hellmann MD, et al. Neoadjuvant PD-1 blockade in resectable lung cancer. N Engl J Med. 2018;378(21):1976–86. 10.1056/NEJMoa1716078. - PMC - PubMed

LinkOut - more resources