. 2024 Oct 21;9(11):1925-1937.
doi: 10.1039/d4nh00315b.

Viral capsid structural assembly governs the reovirus binding interface to NgR1

Affiliations

Viral capsid structural assembly governs the reovirus binding interface to NgR1

Rita Dos Santos Natividade et al. Nanoscale Horiz. .

Abstract

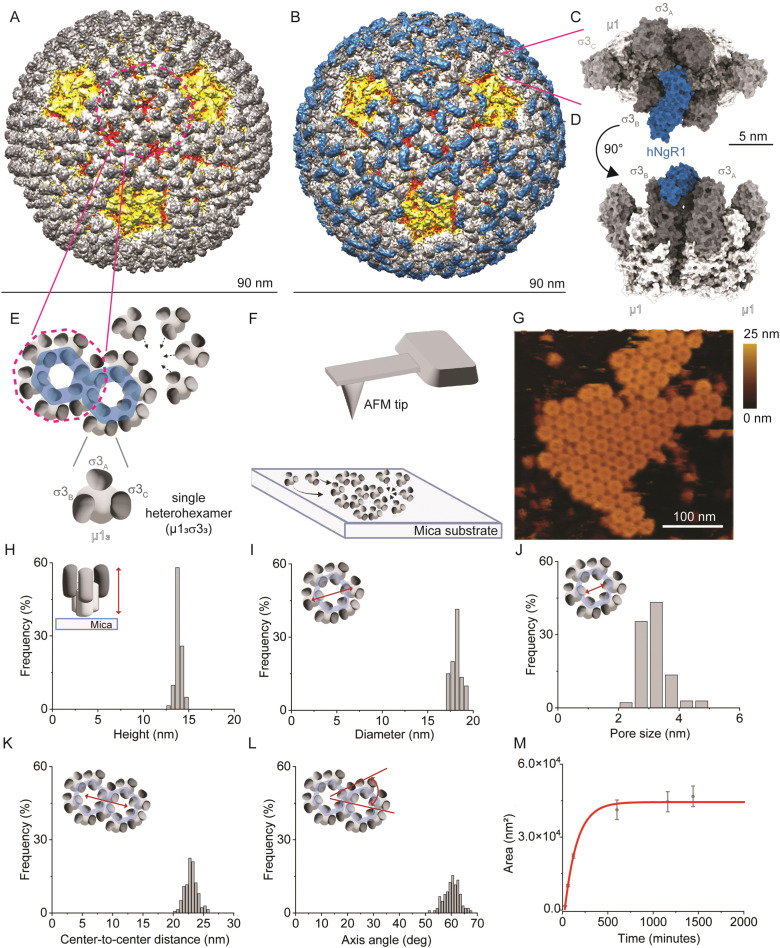
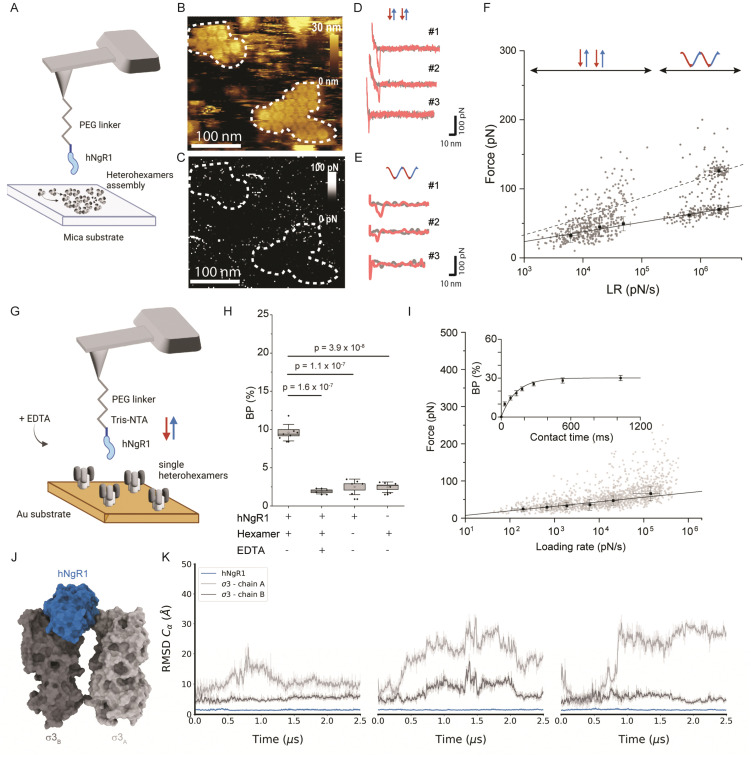
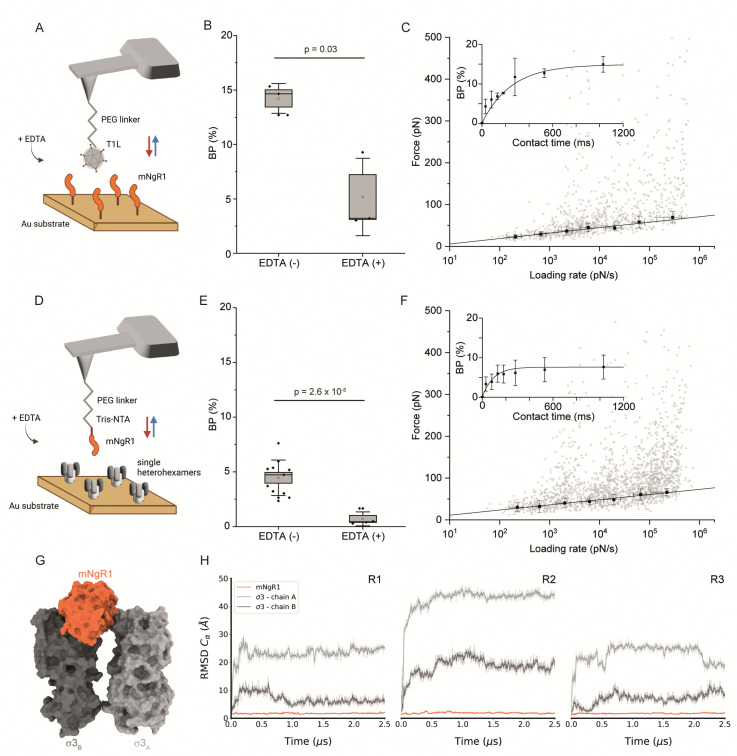
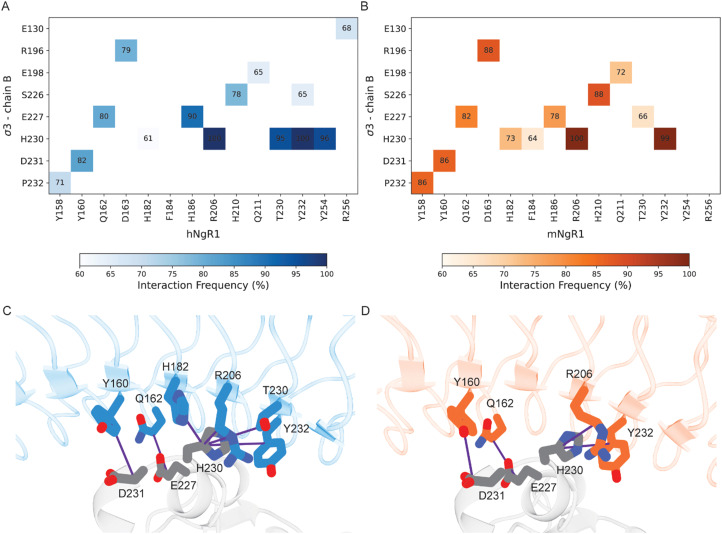
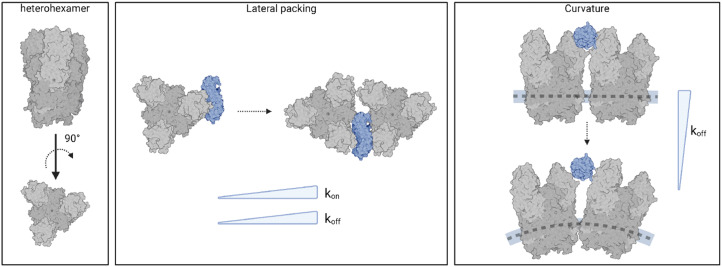
Understanding the mechanisms underlying viral entry is crucial for controlling viral diseases. In this study, we investigated the interactions between reovirus and Nogo-receptor 1 (NgR1), a key mediator of reovirus entry into the host central nervous system. NgR1 exhibits a unique bivalent interaction with the reovirus capsid, specifically binding at the interface between adjacent heterohexamers arranged in a precise structural pattern on the curved virus surface. Using single-molecule techniques, we explored for the first time how the capsid molecular architecture and receptor polymorphism influence virus binding. We compared the binding affinities of human and mouse NgR1 to reovirus μ1/σ3 proteins in their isolated form, self-assembled in 2D capsid patches, and within the native 3D viral topology. Our results underscore the essential role of the concave side of NgR1 and emphasize that the spatial organization and curvature of the virus are critical determinants of the stability of the reovirus-NgR1 complex. This study highlights the importance of characterizing interactions in physiologically relevant spatial configurations, providing precise insights into virus-host interactions and opening new avenues for therapeutic interventions against viral infections.


Conflict of interest statement

The authors declare no competing interests.

Figures

Fig. 1
Fig. 1. Imaging the self-assembly of reovirus μ1σ3 heterohexamers. (A) and (B) Density maps of reovirus alone (A) or in complex with hNgR1 (B). Viral capsid proteins λ2, λ1/σ2, μ1, and σ3 are depicted in yellow, red, white, and shades of grey, respectively. The receptor hNgR1 is depicted in blue. (C) and (D) Surface representation of two σ3μ1 heterohexamers in complex with hNgR1 receptor, from the top view (C) and side view (D). (E) Schematics of the assembly of μ1σ3 heterohexamers to form on hexagonal structures, as present on the viral capsid. (F) Schematics of the imaging setup, with a bare AFM tip and self-assembled μ1σ3 heterohexamers on a mica substrate. (G) AFM topography image of a patch of self-assembled heterohexamers. (H)–(L) Histograms of the measured parameters from self-assembled heterohexamers structures: height of single heterohexamers (H), diameter of the hexagonal structure formed (I) and its pore size (J), center-to-center distance between hexagonal structures (K), and their axis angle (L). (M) Area of the imaged self-assembled patches is plotted in function of time and fitted with an exponential fit (red line).
Fig. 2
Fig. 2. Probing the hNgR1 interaction with μ1σ3 heterohexamers and predicting the hNgR1–σ3 binding interface. (A) Representation of the experimental setup, with an hNgR1-functionalized AFM tip and self-assembled σ3μ1 heterohexamer patches on a mica substrate. FD and force–time curves are collected, from which forces and LRs are extracted. (B) AFM topography image of the scanned σ3μ1 heterohexamers and (C) the corresponding adhesion map of the same area. Colored scales indicate height and force, respectively. (D) Examples of FD curves recorded in FFV mode (using a linear movement of the tip) that display either specific (#1 and #2) or nonspecific (#3) adhesion events. (E) Examples of FD curves recorded in PFT mode (using a sinusoidal movement of the tip) that display either specific (#1 and #2) or nonspecific (#3) adhesion events. (F) Distribution of rupture forces as a function of their LR measured between hNgR1 and self-assembled σ33μ13 heterohexamers, from AFM experiments conducted with rectangular (data points on the left; lower LRs) or sinusoidal (data points on the right; higher LRs) tip movement. The solid line represents the Bell–Evans fit (for simple ligand–receptor bond) and the dashed line represents the Williams–Evans model prediction (for multiple simultaneous uncorrelated bonds). Error bars indicate SD. (G) Representation of the experimental AFM setup, operated in FV mode with an hNgR1-functionalized tip and single σ33μ13 heterohexamers grafted onto a gold-coated surface. (H) Box plot of the BP calculated for the hNgR1-single heterohexamers interaction and control experiments, including this same interaction with the addition of EDTA (5 mM), the interaction between hNgR1 and a surface coated with NHS/EDC (without heterohexamers), and an AFM tip with tris-NTA (without hNgR1) and a single-heterohexamers-coated surface. (I) DFS plot showing the distribution of rupture forces as a function of their LR, measured between hNgR1 and single heterohexamers. The solid line represents the Bell–Evans fit (for simple ligand–receptor bond). For contact time plots, data points represent mean BP calculated for each contact time and were fitted using a least-squares fit of a monoexponential decay. For all DFS and contact time plots, the error bars indicate SD. For all BP plots, one data point represents the BP obtained for one map of 1024 FD curves. The horizontal line within the box indicates the median, boundaries of the box indicate the SEM, and the whiskers indicate the SD. All data are representative of at least n = 3 independent experiments. (J) Structural representation of the complex between hNgR1 (in blue surface) and the two σ3A (in light-grey surface) and σ3B (in dark-grey surface) subunits. (K) Root-mean-square deviation (RMSD) of indicated chains computed using hNgR1 as the reference for the MD trajectory alignment. Plots are colored in blue, light grey, and dark grey for hNgR1, σ3A, and σ3B, three MD replicates are shown.
Fig. 3
Fig. 3. Thermodynamical characterization of the interactions between mNgR1 and either reovirus T1L or single μ1σ3 heterohexamers, and predicting the mNgR1–σ3 binding interface. (A) Representation of the experimental setup, with an AFM tip functionalized with a reovirus T1L virion and mNgR1 proteins grafted on a gold-coated surface, operated in FV mode. (B) Box plot of the BP calculated for the T1L–mNgR1 interaction, with (control) and without addition of EDTA (5 mM). (C) DFS plot showing the distribution of rupture forces as a function of their LR, measured between T1L virion and mNgR1. Binding probability is plotted (as inset) as a function of the contact time. (D) Representation of the experimental setup, with an AFM tip functionalized with mNgR1 and single σ3μ1 heterohexamers grafted on a gold-coated surface, operated in FV mode. (E) Box plot of the BP calculated for the mNgR1-single heterohexamers, with (control) and without addition of EDTA (5 mM). (F) DFS plot showing the distribution of rupture forces as a function of their LR, measured between mNgR1 and single heterohexamers. For all DFS plots, the solid line represents the fit of the data with the Bell–Evans fit (for simple ligand–receptor bond). For contact time plots, data points represent mean BP calculated for each contact time and were fitted using a least-squares fit of a monoexponential decay. For all DFS and contact time plots, the error bars indicate SD. For all BP plots, one data point represents the BP obtained for one map of 1024 FD curves. The horizontal line within the box indicates the median, boundaries of the box indicate the SEM, and the whiskers indicate the SD. All data are representative of at least n = 3 independent experiments. (G) Structural prediction of the complex between mNgR1 (in orange surface) and the two σ3A (in light-grey surface) and σ3B (in dark-grey surface) subunits. (H) RMSD of indicated chains computed using mNgR1 as the reference for the MD trajectory alignment. The plots are colored in orange, light grey, and dark grey for mNgR1, σ3A and σ3B, respectively. R1, R2, and R3 denote MD replicates.
Fig. 4
Fig. 4. Residues in common that are involved in the interactions between human and murine NgR1 with σ3B. (A) and (B) Heat maps of interacting residues in the initial complexes that occur frequently in the simulations. Cells of the heat maps are colored according to the increased number of interactions, from white to dark blue for the hNgR1 complex (A) and white to dark orange for the mNgR1 complex (B). (C) and (D) 3D representation of the key interactions established by residues Y160, Q162, and R206 of hNgR1 and mNgR1, and H230 of σ3B. The σ3, hNgR1 (C), and mNgR1 (D) structures are shown in grey, blue, and orange cartoons, respectively. Violet lines indicate the residue connections that are found during the simulations (for the type of interactions, see Table S1, for the complete overview of all contacts see Fig. S8, ESI†).
Fig. 5
Fig. 5. Spatial organization and curvature are critical determinants of NgR1–reovirus complex stability. Models of NgR1 binding interfaces with reovirus heterohexamers reconstituted on a planar support or within the curved virus capsid. The concave NgR1 interface binds more strongly to individual heterohexamers compared to densely packed self-assembled structures (lower koff), however the multimeric heterohexamer arrangement promotes a higher association rate (higher kon). The local curvature of the viral capsid in reovirus native topology allows for a greater accessibility of the NgR1-binding groove between σ3 subunits from adjacent heterohexamers, which plays a key role in the stability of the complex (lower koff). Created with BioRender.com.

References

    1. Grove J. Marsh M. The cell biology of receptor-mediated virus entry. J. Cell Biol. 2011;195:1071–1082. doi: 10.1083/jcb.201108131. - DOI - PMC - PubMed
    1. Yamauchi Y. Helenius A. Virus entry at a glance. J. Cell Sci. 2013;126:1289–1295. doi: 10.1242/jcs.130062. - DOI - PubMed
    1. Guglielmi K., Johnson E., Stehle T. and Dermody T., Attachment and cell entry of mammalian orthoreovirus, Reoviruses: Entry, Assembly and Morphogenesis, 2006, pp. 1–38 - PubMed
    1. Sabin A. B. Reoviruses: a new group of respiratory and enteric viruses formerly classified as ECHO type 10 is described. Science. 1959;130:1387–1389. doi: 10.1126/science.130.3386.1387. - DOI - PubMed
    1. Tyler K., Pathogenesis of reovirus infections of the central nervous system, Reoviruses II: Cytopathogenicity and Pathogenesis, 1998, pp. 93–124 - PubMed

Publication types

LinkOut - more resources